Transcription
TRANSPORTATION RESEARCH RECORD 149844Facilitating Transportation AgencyManagement Through PerformanceMeasurement: The NYSDOTExperience with the "ManagementPerformance Indicators" ReportRICHARD ALBERTIN, JACKIE ROMEO, LYNN WEISKOPF, JOHN PROCHERA,AND JOHN ROWENPerformance measurement is a powerful management tool to help anorganization accomplish its mission and build a more productive workenvironment. This paper describes steps undertaken by the New YorkState Department of Transportation (NYSDOT) to develop an executive-level performance measurement system-the "Management Performance Indicators" report (MPI). It was developed to meet executivemanagement information needs, but over time has evolved into a toolfor monitoring and assessing departmental performance. Its development and evolution are explored, as well as benefits derived from itsuse. Components of the MPI are surveyed, as well as lessons learned inits use and its future within the agency. The MPI is a managementresource for NYSDOT, providing early warning of potential problemsand allowing modification of processes to improve performance.Longevity and continued success of the MPI are based on its flexibility,ability to hold the interest of top management, and the atmosphere ofcooperation it encourages among program areas. Executive focus onprogram areas identified by the MPI has improved the department's productivity in numerous program areas. Its introduction has also fostereddevelopment of more reliable data and a team spirit among managers toaddress potential areas of concern. A performance measurement systembenefits all levels and all functions of an organization. Usefulness of anexecutive-level MPI can be expanded through extension of performancemeasurement into all NYSDOT areas.Measurement and evaluation are important planagement tools formonitoring performance of programs. They take place on all levelsand across all functions on a continuous basis. Performance measurement can help accomplish an organization's goals, and at thesame time build a productive work environment. Private industrieshave used performance measurement systems to facilitate improvements of existing corporate or divisional reporting systems;enhance communication links, enabling managers to stay in tunewith critical activities in the organization; and improve programmanagement capabilities. The need to improve performance andenhance communication exists in the public sector just as it does inprivate sector corporations.OVERVIEWWhat Is the MPI?The New York State Department of Transportation (NYSDOT)staff created the "Management Performance Indicators" report (theMPI) to provide upper-level managers with current information andspecific data on the performance of major processes. It has met threeprimary objectives identified by NYSDOT's executive managers:1. It should provide a continuous view of how NYSDOT is performing as an organization,2. It should help managers identify potential problem areas earlier, and3. It should strengthen communication among department managers.Advantages and Benefits of the MPIA periodic report such as the MPI has many important advantages:1. Executive management regularly receives reports and analysis on the progress of important programs so they can direct corrective action and/or provide positive feedback,2. Program managers have more incentive to try to improve theirperformance because they are being reviewed,3. The data used to monitor program performance becomes morereliable because it is being monitored by executive management,4. Where information is not available, reporting "pushes" development of data systems to assist management in monitoring criticalprocesses, and5. A baseline is established for historical performance of keyperformance measures.Why Was It Created?Management Systems Bureau, New York State Department of Transportation, Building 4, Room G-18, Albany, N.Y. 12232.In 1985, NYSDOT began moving its management culture towardgreater use of operational planning and goal-oriented managementto improve performance and manage resources more effectively.
45Albertin et al.These initiatives, however, required performance indicators anddata to measure achievement of goals and plans. When a new commissioner of Transportation began his tenure at NYSDOT in 1986,he discovered that executive management could not review currentNYSDOT performance in a single document. Individual reports andstaff briefings were available, but it was difficult to synthesize theflood of information from NYSDOT' s many programs to understand how NYSDOT was doing in areas of greatest concern. Tosolve this problem, the Management Systems Bureau (MSB) wasasked to develop a prototype-the "MPI," or Management Performance Indicators report.Issues in Its Development VCirculation was restricted, at least initially, to key department executives. It was uncertain what such a report would reveal or how itmight be used outside the department.The first reports were internal working documents, distributed tokey department managers. They provided the basis for discussionamong executive staff to identify and focus management efforts onareas of greatest concern. The key indicators were viewed as preliminary, based on available data. It was anticipated that data accuracy and reliability would improve over time. As will be described,this proved to be a critical success factor for the report's longevityand acceptance.How Was It Created?MSB had been established within the department as "internal" management consultants, and was ideally positioned todevelop the MPI. MSB's work includes policy analysis, organizational assessments, systems analysis, and quantitative analysis.These activities put them in close contact with department management as well as provided them with an opportunity to becomefamiliar with departmental operations.The first step was to develop a list of potential measures representing key indicators (in the joint opinion of each organizationand MSB) for NYSDOT's major activities. To assist in this effort,MSB staff reviewed department reports and statistics and searchedthe literature. MSB's familiarity with program area activities aswell as the often excellent rapport its staff had established (throughprevious assignments) went a long way in breaking down anybarriers between the commissioner's staff and program staffsthat might have created reluctance on the part of program managers.Unfortunately, most of the measures initially identified indicatedresults (e.g., how many bridges were designed or traffic signalsinstalled) but did not indicate efficiency or effectiveness. Althoughhelpful, such indicators do not tell how well an organization delivers its key products and services.The literature search found that only a few other transportationorganizations were producing performance reports. Most were project-related, reporting on the status of iJffdividual projects, then"rolling them up" into summary reports. These are certainly useful,but measure only parts of an agency's performance.The result of this joint effort with various program managers wasa list of nearly I 00 possible measures covering virtually everydepartmental service and product. Obviously, these were far toomany for an executive report. After several meetings, the commissioner -and staff selected 15 measures to be developed andreviewed-5 to be reported quarterly and 10 monthly. Indicatorsmay be reported either monthly or quarterly, depending on rate ofchange or cyclical nature of the data.The decision to limit the number of measures was based onmanagement preference, reasonableness of the number to beanalyzed, and amount of MSB staff time available to develop thereport. This required two staff members to work half-time for 9months to identify potential indicators, and to work with executivemanagers to select specific measures to be included in the report.It then required one person full-time and another person quarter- Itime over a 3-month period to work with program area staff trans-Vlating the indicator ideas into actual performance measures. Currently, the MPI requires one person half-time to maintain andenhance the report, plus another person quarter-time to produce it.jVTHE MPI TODAYHow It Is PreparedThe Monthly ReportAn MSB team of analysts prepares the MPI each month, receivingdata from various staff members responsible for the activities measured in the report. Typically, the MPI team prepares the graphsand tables that are the basis of the analysis. The format for pre- /sentation of performance indicators has been standardized for consistency and easy comprehension. This format includes: I) adetailed description of each measure, 2) an explanation of impactof the performance of the indicator, 3) the data source, 4) the goal(target), if any, 5) a trend analysis, and 6) data presentation in bothtabular and graphic formats. A typical MPI report is represented inFigure I.The team's analysis for each indicator usually consists of one totwo pages and includes historical trends, comparisons amongregions, and comparisons of performance to an administratively setgoal or standard. (NYSDOT has 11 administrative-geographical"regions.")New IndicatorsThe consensus-building process previously described in theMPI's development continues today as new indicators are identified and developed. The MPI team, in conjunction with programpersonnel, produces a package for each indicator containinggraphs, tables, and narrative that highlight trends and developments. This package is then discussed and reviewed with programarea managers.If agreement is reached, the package is forwarded to the program's assistant commissioner and/or the regional director(s) forfinal approval. Once final approval is obtained, the indicatorbecomes part of the MPI report. When data is unavailable for developing an indicator, the MPI team sometimes works with the program area to develop a supporting data system.How It Has ChangedIn 1993, another new comm1ss1oner of Transportation wasappointed. After being briefed on the report and hearing comments
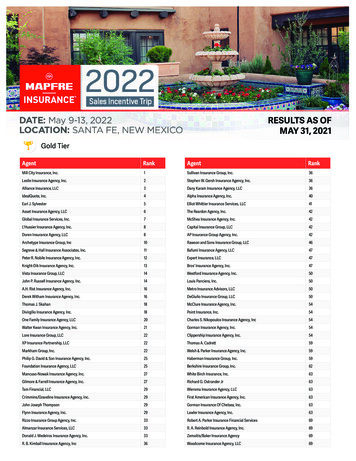
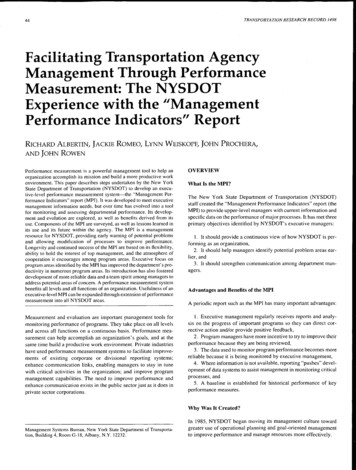
46TRANSPORTATION RESEARCH RECORD 1498DESCRIPTION:The following graph and table report on the level of orders-on-contractsreceived for construction contracts that have been completed over the lasttwelve months. The graph presents the final amount paid for a contract asa percentage over or under the original bid price, for all contracts in a Region.Since the February 1993 MPI. this indicator has included only constructioncontracts which have been completed. Comparisons to prior MPl's, whichinclude canceled construction contracts and emergency/contingency contracts (where bid amount and final amount may bear little relation to eachother), are invalid.IMPACT:Positive percentages indicate that, on average, projects cost more than theawarded amount. Negative percentages indicate that, on average, finalcosts were lower than the awarded amount. Ideally, there should be nodifference between the awarded amount and the final project cost.However, in the construction industry, orders-on-contract in the range oftwo to four percent are considered acceptable depending on the nature andtype of work.SOURCE:Construction DivisionTREND:Contracts Closed:In a typical MPI, the current month's performance is compared to the priormonth and the prior year performance. Both statewide ·and regionalperformance is analyzed. Occasionally, the MPI will include a long-termanalysis.FIGURE 1Typical MPI report; table and bar graph show hypothetical data.from program staff, he readily agreed to continue the MPI. He did,however, make one significant change: the report is now widely distributed throughout the department (to both the main office andregions). This decision has brought immediate benefits. Mid-levelmanagers are now actively involved in analysis of these measuresand many use them in their day-to-day work. The indicators are regularly discussed, as well as causes for particular trends. There is alsospirited but friendly competition among regional groups as to their"standings."With expanded distribution of the MPI, opportunities occurred to ask users directly what changes they would like to see.In January 1994, MSB distributed a survey to improve usefulnessof the MPI. This was the first time since the report began in1989 that recipients were asked directly for their input. Comments were requested on each component (analysis, tables, graphs)for the current indicators (both monthly and quarterly). Recipients were encouraged to offer comments, suggestions, andalternative measures of assessing NYSDOT performance. Usingsurvey results as a base, discussions were held with executivemanagers. The result was a work program to "fine-tune" current indicators, develop additional ones, and discontinue othersto better reflect the changing needs of NYSDOT managers.The MPI reader survey produced the following top-rated new indicators.(continued)1. Summary of the current letting program with respect to milesof roads and number of bridges to be constructed or rehabilitated(planned versus actual).2. Report on the department's ability to accurately assess construction costs.3. Report on the department's ongoing highway and bridgemaintenance program (planned versus actual).4. Report on recruitment and promotion of women and minorities within the department.5. Report analyzing the cost of producing the Capital Program.The MPI team plans to ask readers periodically for their feedbackto ensure that the report will maintain its relevancy and usefulness.The MPI Today: What It ContainsThe MPI format corresponds to NYSDOT' s major functions. It presents data and analysis of key activities in the NYSDOT capital program: project scoping, design, and construction; project cost estimating; obligation and disbursement of funds; administrativesupport; and specific areas of executive interest.When warranted, MSB develops and includes special indicatorson a time-limited basis to track performance of activities having
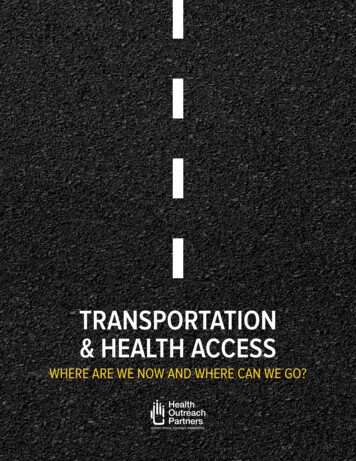
47Albertin et al.Orders-On-ContractContracts Closed from 4/93 to 3/9415%.c:i13%0E ("Ci:O10%E 8%CDClc('O.cu.c5%Q)(.)Q;3%0.0%254367891011Region Last MonthD This MonthStatewide Average (5.4%)ORDERS-ON-CONTRACTCONTRACTS CLOSED(4/01 /93 to 3/31 ons)Amount(Millions) 37.4 59.7 51.6 43.7 74.8 35.8 25.0 120.5 36.5 161.8 263.8 910.6 38.9 62.0 56.3 45.9 77.2 38.4 26.5 125.8 36.9 165.9 285.9 1 o/o2.5%8.4%5.4%Source: Construction DivisionFIGURE 1 (continued)high levels of executive or program interest. For example, inApril 1988, the department accelerated efforts to recruit and hireentry-level engineers and to expand affirmative action efforts forthese titles. The goal was to recruit the most qualified entrylevel engineers while accelerating the process of diversifying NYSDOT' s engineering forces. This indicator summarized the results ofNYSDOT' s efforts in accomplishing the established goal, and wasdropped from the report when the goal had been achieved.4/'The following discussion describes each current indicator in theMPI. As previously noted, indicators are reported either monthly orquarterly, depending on the rate of change or cyclical nature ofthe data.Capital Program Management: Letting ProgramIndicatorsThe Letting Program measures NYSDOT's progress in obligatingfederal aid and state aid funds during the current fiscal year.Monthly and cumulative performance is measured against quarterly and fiscal year targets. This information is aggregated on astatewide basis and also presented by region.Letting-to-Award Processing measures NYSDOT's efficiency inawarding construction contracts. It reports the percent of contractsthat progressed from acceptance of bid to contract award within adepartment standard period of 46 days. It also presents information
48on the median number of days required to process a contract, andthe longest and shortest processing times.Capital Program Management: Project DevelopmentIndicators /Status of Project Development: 5-Year Program measures thedepartment's progress in predesign (planning) and preconstructionproject development for all projects scheduled to be let in the current 5-year capital construction program. It compares actual projectdevelopment elapsed time against the most recent target schedules.Projects are represented in one of six phases of development: notyet begun, scoping, preliminary design, final design, submission ofplans specifications and estimates, and let.Status of Project Development: Current Fiscal Year measures thedepartment's overall progress in project development for the current state fiscal year. Information on the number and current estimated value of projects in the scheduled phase of development iscompared to the actual phase of project development. The indicatortracks the percentage of the program on schedule, which ultimatelyallows NYSDOT to meet its annual letting target.Project Cost History measures NYSDOT's ability in accuratelyestimating construction costs of capital projects as they progressthrough the development process. Initial cost estimates establishedat the beginning of project scoping are compared to final cost estimates contained in engineers' estimates at the end of the detaileddesign process. Accuracy of the estimates is an important factor inthe department's ability to manage its 5-year Capital Program. Thisindicator is analyzed by project type and region. Currently, the Project Cost History Indicator is being modified to reflect feedbackfrom the MPI reader survey. Managers responded that a more accurate measure would compare project cost estimates at several pointsin the design process.Capital Program Management: Construction ProgramIndicatorsConstruction Schedule measures NYSDOT and contractor effectiveness in meeting construction completion targets. A contract isdefined as "on-time" if it is completed (i.e., the contractor's last dayof work occurred) on or before the completion date specified in theoriginal (awarded) contract. This indicator presents the number andvalue of construction projects scheduled for completion in the mostrecent 12-month period, and the percent and dollar value that werecompleted on schedule.Orders-on-Contract reports the level of change orders receivedfor construction contracts completed over the last 12 months, andinformation on change orders approved or being processed for allconstruction contracts under way at this time. Performance is compared within regions and by the department over time and againstcustomary construction industry standards.Real Estate Acquisition presents data on NYSDOT' s performance in making payments to property owners affected byright-of-way activity on federal aid projects. Federal law requiresthat the state either pay the property owner the full amount ofappraisal, or deposit the amount of the state's offer in an interestbearing account before the project's award date. This indicatorcompares NYSDOT' s performance against a goal of 100 percentpayment.TRANSPORTATION RESEARCH RECORD 1498Administrative and Financial Indicators/consultant Contracts Processing measures NYSDOT's efficiencyin the processing of consultant contracts for bridge and highwaydesign or construction inspection. This process consists of fivesteps: designation (selection), price and scope negotiation, draft ofcontract agreement, funding, and contract approval. This indicatorreports the median number of days required for each step and compares these medians to NYSDOT' s standard for each step. Thedepartment is moving to "just-in-time" processing, which deliversthe contract on a date requested instead of within a standard timeframe. When this shift is completed, this indicator will be revised toreport the percentage of contracts delivered by the requested date.Internal Affirmative Action Goal Attainment measures the department's performance in attaining its affirmative action hiring goals.Overall targets are set for each region and the main office, and theirperformance results are reported. At the commissioner's request,MSB has expanded this indicator to report on progress in improving the status of women and minorities in the department (i.e., hiresand promotions).Disadvantaged Business Enterprise (DBE) indicators measureNYSDOT's ability to meet federal and state goals for use of DBEand MBE (Minority Business Enterprise) construction contractors,subcontractors, and consultants. They report the percent of construction contract funds awarded to firms owned by one or moresocially and/or economically disadvantaged persons (minorities,women, and/or other disadvantaged persons.) Both the federallyassisted and state-funded programs are monitored. Participationgoals have been established for contractors and subcontractors,and the department's performance is measured against these goals.The department is currently establishing goals for consultant participation.General Fund Disbursements: State Operations and Local Assistance Accounts measure NYSDOT' s ability to manage accounts forState Operations and Aid to Localities. The department's projectedand actual cumulative disbursements are compared. If actual disbursements are much greater than projected, NYSDOT may riskexceeding its limit and may require additional disbursementapproval from the State Division of the Budget to fund operations.If actual disbursements are much lower than those projected,NYSDOT may risk reduced appropriations in future fiscal years.Current Areas of Executive InterestPublic Claims and Tort Liability measures NYSDOT' s ability tomanage its liability for actions (and nonactions) relative to its highway programs. This indicator presents data on claims filed againstthe department by the public for alleged departmental torts (e.g.,negligence in design, maintenance, etc.). The indicator also reportsthe number and value of torts closed and identifies whether theyhave been dismissed, discontinued, awarded funds, or settled.Departmental Safety measures managers' and employees' abilityto adhere to safety rules as measured by the number of personalinjuries, vehicle accidents, and lost-time days reported during thecurrent calendar year. These figures are reported on a regional basisfor departmental employees. Both preventable and total number ofpersonal injuries and vehicle accidents are reported. This indicatorwas recently revised and enhanced based on the feedback obtainedthrough the MPI reader survey. Lost-time days were added to themeasure.
49Albertin et al.MPI SUCCESS AND LONGEVITYSuccessReports alone do not improve performance, but the MPI report hashad an impact on how the department monitors programs and measures performance. Before the MPI' s existence, program managersdid not universally and consistently share, discuss, and examinetheir data; executive managers did not have regular performanceinformation in an easy-to-understand format; and performance wasnot generally compared to targets or historical data. Because of theMPI, the following events now occur. Executive managers hold regular monthly meetings focusingon program areas of interest, and program managers consequentlyare actively involved in improving and clarifying their data. Program data is regularly examined by a team of analysts whoare not directly involved in program area work, providing a valuable "outsider's" view and a quality assurance function. As a result,data systems and reporting have improved. For example, the MPIrecently added a new indicator for "Letting Program Accomplishments," which reports the number of bridges and lane miles that willbe reconstructed or rehabilitated as a result of capital projects let inthe current state fiscal year, and compares these figures to goals setearlier in the year. When this indicator first appeared, some regionshad yet to report information for their lettings. When they realizedthat executive management was reviewing this information, this·important data quickly began appearing. Executive managers now have a single source for much important information readily available (and in an easy-to-understand format) to provide the public and outside control agencies with information on exceptional and/or improved performance, achievementof goals, and areas where action is being taken for improvement. Forexample, in 1987, 405 days was the median required for processingof a consultant contract. After review and modification, the medianprocessing time fell to 217 days in 1993. Similarly, during calendaryear 1990, NYSDOT staff had 585 preventable personal injuries.With implementation of a state-wide training initiative and management emphasis on prevention, these declined to 436 by 1993.o Perhaps the greatest success of the report is in opening a twoway dialogue between executive management and program areas.Attitudes of the program managers have changed from hesitationand reluctance to readiness to suggest their own indicators for inclusion in the report. The Real Estate Acquisition indicator discussedearlier is an example of an indicator suggested for inclusion fromthe program area.As knowledge and acceptance of the report expand, and the baseof historical information grows, optimism increases about the futureof the report and continued successes such as those described above.LongevityThe longevity and continued success of the report are due to the following four significant factors.Ensuring Flexibility and RelevanceVirtually every measure has evolved since it was originally developed to better reflect the true circumstances yielding the indicatedresults. NYSDOT' s experience has indicated that even the moststraightforward indicators must be carefully developed and revisedto present a truer picture of the activity measured. For example, theConstruction Schedule indicator originally did not take into accountthe seasonal nature of construction. Data presentation was revisedto consider this factor.Indicators that are no longer relevant are discontinued. For example, the MPI included an interstate pavement striping indicator tomonitor regional performance in meeting goals to convert 4-in.striping to 6-in. pavement striping. The indicator was discontinuedat completion of a 3-year conversion program.I/Continued Interest from Top ManagementAs mentioned earlier, each month the executive assistant to thecommissioner selects a measure to discuss at the executive staffmeeting. Although this measure is often selected because of anunusual trend (in either a positive or negative direction), great careis taken to ensure that every measure is periodically discussed at theexecutive staff meeting. In this way, every measure receives attention, and continued program interest is encouraged.Close Coordination between MSB and the OrganizationResponsible for the Activity Being MeasuredThis includes joint development or revision of the measure, priorprogram manger review of the analysis to be included in the report,and joint development of all presentations to executive management. In instances of disagreement over interpretation of results,every effort is made to reconcile the differing views. In the rareinstances when that is not possible, the program manager's dissenting analysis is also included in the presentation. This combinationof close and regular contact creates a bond of trust tending to alleviate apprehension that can often exist in such a reporting system.As a result, people can more quickly address the message, insteadof arguing with or criticizing the messenger.MP/ Discussions at Executive Staff Meetings Focus onProblems, Not PeopleBecause program managers have "bought into" the measures andbecause they know the measurements, open discussion of issuesraised by the MPI lose any accusatory, inquisitorial edge. Executives can more quickly identify reasons for trends, what managersare doing to address them, future prospects, and what NYSDOTresponses are needed.LESSONS LEARNED AND FUTURE ACTIONSObservations and OpportunitiesOver the years, performance measurement has gradually expandedinto the lower levels of NYSDOT' s organization. Some managersembraced performance measurement wholeheartedly, even beforeintroduction of the MPI. Unfortunately, use of performance measurement as a management tool is not universal. In part, this may bebecause of the difficulty of measuring some activities. In other
TRANSPORTATION RESEARCH RECORD 149850instances, it may simply be a case of a manager being uncomfortable with the tool. Another factor may be unintentional messagespresented by an executive report. If performance for a particularprogram area is not measured, it is sometimes wrongly perceivedthat this program is not important. To address this misconception,the department may ask all organizations to develop and maintaintheir own key indicators and highlight appropriate indicators in theexecutive report on a rotating basis.The department also struggles with the issue of how to measuremore difficult areas such as planning. Delivery of required plansand systems on time and within estimated resources has been thefocus to date, but has produced only limited success. A new indicator under development measures the Preliminary Engineering (PE)costs for construction projects. One component of this PE cost isplanning. NYSDOT has begun reporting on the level of planningeffort expended by project type and by region. This is a first step inestablishing a benchmark concerning planning levels for construction projects.As ability to understand the usefulness and importance of performance measurement expands, the focus of the measures sometimes changes. NYSDOT' s performance measures generally concentrate on output (volumes and costs), but an effort to measurequality has begun in several activities. An example of this effort isthe Real Estate Acquisitions indicator, reporting on NYSDOT'sperformance in making payme
The New York State Department of Transportation (NYSDOT) staff created the "Management Performance Indicators" report (the MPI) to provide upper-level managers with current information and specific data on the performance of major processes. It has met three primary objectives identified by NYSDOT's executive managers: 1.