Transcription
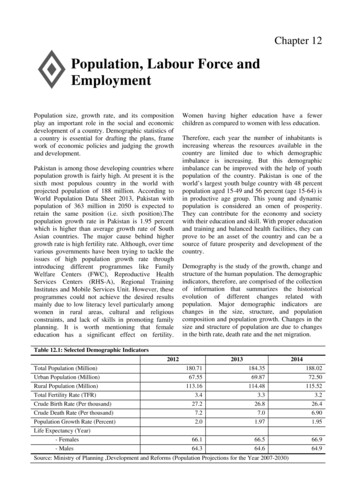
Chapter 12 Population, Labour Force andEmploymentPopulation size, growth rate, and its compositionplay an important role in the social and economicdevelopment of a country. Demographic statistics ofa country is essential for drafting the plans, framework of economic policies and judging the growthand development.Pakistan is among those developing countries wherepopulation growth is fairly high. At present it is thesixth most populous country in the world withprojected population of 188 million. According toWorld Population Data Sheet 2013, Pakistan withpopulation of 363 million in 2050 is expected toretain the same position (i.e. sixth position).Thepopulation growth rate in Pakistan is 1.95 percentwhich is higher than average growth rate of SouthAsian countries. The major cause behind highergrowth rate is high fertility rate. Although, over timevarious governments have been trying to tackle theissues of high population growth rate throughintroducing different programmes like FamilyWelfare Centers (FWC), Reproductive HealthServices Centers (RHS-A), Regional TrainingInstitutes and Mobile Services Unit. However, theseprogrammes could not achieve the desired resultsmainly due to low literacy level particularly amongwomen in rural areas, cultural and religiousconstraints, and lack of skills in promoting familyplanning. It is worth mentioning that femaleeducation has a significant effect on fertility.Women having higher education have a fewerchildren as compared to women with less education.Therefore, each year the number of inhabitants isincreasing whereas the resources available in thecountry are limited due to which demographicimbalance is increasing. But this demographicimbalance can be improved with the help of youthpopulation of the country. Pakistan is one of theworld’s largest youth bulge country with 48 percentpopulation aged 15-49 and 56 percent (age 15-64) isin productive age group. This young and dynamicpopulation is considered an omen of prosperity.They can contribute for the economy and societywith their education and skill. With proper educationand training and balanced health facilities, they canprove to be an asset of the country and can be asource of future prosperity and development of thecountry.Demography is the study of the growth, change andstructure of the human population. The demographicindicators, therefore, are comprised of the collectionof information that summarizes the historicalevolution of different changes related withpopulation. Major demographic indicators arechanges in the size, structure, and populationcomposition and population growth. Changes in thesize and structure of population are due to changesin the birth rate, death rate and the net migration.Table 12.1: Selected Demographic Indicators2012Total Population (Million)Urban Population (Million)Rural Population (Million)Total Fertility Rate (TFR)Crude Birth Rate (Per thousand)Crude Death Rate (Per thousand)Population Growth Rate (Percent)Life Expectancy (Year)- Females- 901.9566.164.366.564.666.964.9Source: Ministry of Planning ,Development and Reforms (Population Projections for the Year 2007-2030)
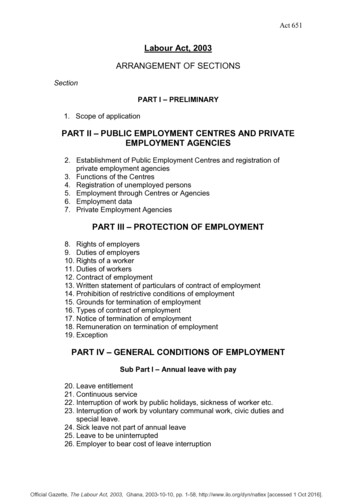
180Pakistan Economic Survey 2013-14Crude Birth & Death RateFig-12.1: Population OverviewCrude birth rateCrude death ratePopulation 0102011201220132014Source: Ministry of Planning ,Development and ReformsCrude Birth Rate: Crude Birth Rate (CBR) is theannual number of live births per one thousandpersons. CBR of more than 30 per thousand isconsidered high and a rate of less than 18 perthousand is considered low. The global CBR in 2013was 20 per thousand, while the CBR in Pakistan hasbeen marginally improved from 26.8 percent in 2013to 26.4 percent in 2014.Crude Death Rate: Crude Death Rate (CDR) isdefined as total death per one thousand persons in ayear. CDR of less than ten per thousand isconsidered as low while above twenty per thousandis considered as high. The global CDR was 8persons per one thousand in mid 2013. However,improvements in health services and expansion inmedical facilities in Pakistan have led to decline inCDR from 7.0 percent in 2013 to 6.9 percent in2014. These rates are often referred as crude ratesbecause they do not take into account population agestructure.Life ExpectancyLife expectancy is the number of years a personwould be expected to live, starting from birth and itmeasures quantity rather than quality of life.Globally it is observed that high life expectancy isassociated with high income per capita, improvednutrition, better hygiene, access to safe drinkingwater, effective birth control and immunization andother better medical facilities. Life expectancy inwomen is higher than men. Currently, the global lifeexpectancy for both male and female is 70 years.However, while considering it gender wise, the lifeexpectancy for males is 68 years and for females is73 years- a difference of five years. In Pakistan, theaverage life expectancy has improved from 64.6 in2013 to 64.9 in 2014 for males and for females it hasimproved from 66.5 in 2013 to 66.9 in 2014.Population GrowthPopulation growth rate is another importantindicator used to describe the change in populationand play a focal point in the economic developmentof a country. Rapid population growth can generatefood security problem, environment problem andurban congestion and it is the major factor behindthe international migration. In Pakistan populationgrowth rate has shown improvement and itdecreased from 2.0 percent in 2012 to 1.97 percentin 2013 and 1.95 percent in 2014.Table: 12.2 Percentage of Population 2012-13Age .553.3155-591.381.162.5460-641.070.821.8965 and above1.841.363.20Total51.3548.65100Source: Pakistan Labour force survey 2012-13Age Composition of populationAge composition of population refers to distributionof population by age and sex. The data onpopulation by age and sex is vital for demographers,health administrators and other policy makers etc.for planning and execution of various healthdevelopment programmes. The organization ofpopulation by rural/urban, sex and marital status andage unveils the features of population compositionand provides disaggregated data for target orientedanalysis.
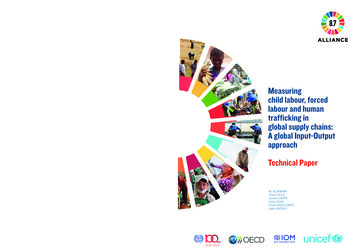
Population, Labour Force and EmploymentAge composition of population is important forseveral reasons. The estimates of proportion ofchildren and older persons is important for theprovision of national expenditures on schools ,childcare, immunization and reproductive healthservices vis-a vis expenditure on old age socialsecurity systems and health care for chronic anddegenerative diseases. Table 12.2 presents the agestructure of the population of 2012-13.Fig-12.2: Population Pyramid ofPakistan 2012-1365 and 15-1910-145-90-4Age% Female50Population (%)556 percent population is in the age group of 1564.This productive age population is the main sourceto ensure accelerated economic growth. Policymakers may take advantage of this growing workingclass in reducing dependency burden in the future.For making the strategies to reduce poverty leveland tapping their potential into productive economicactivities, policy makers may focus on the provisionof livelihood earning skills through short termvocational training aimed at provision of employableskills.Population by Martial Status% Male1018110Table 12.2 shows that 41 percent population is in theage group of 0-14 and this group is economicallyunproductive and need food, clothing, education andmedical care. They depend upon working populationfor their necessities.Adult population is considered as wealth of a nationin terms of human resource. This Table shows thatMarital status is defined as the personal status ofeach individual in relation to the marriage laws orcustoms of the country. Population distribution bymarital status is the percentage distribution of thepopulation in a given age group by the differentmarital status categories. Following Table 12.3shows the percentage of married population indifferent age brackets. The lowest age bracket is 1019 in this age bracket around 7 percent people aremarried, which means that average marriage age inPakistan has increased. The rate of women and menwho have never married shows the decreasing trendwith the increasing age. According to PakistanLabour Force survey 2012-13, 94 percent of thepopulation of the age bracket 35-39 is married. Themost phenomenal increase in married populationmay be seen in the age bracket 20-29 wherepercentage of married population has increased 73percent. This is the most fertile age of populationgrowth. The changes in marriage patterns have adirect impact on fertility and population growth rate.Table 12.3: Percentage of Population by Marital Status 2012-13Age groupTotalNever marriedtotal (10 year and 65 and over1000.89Source: Pakistan Labour Force Survey 2012-13Regional DemographicsPakistan belongs to Asian continent which is thehome of 60 percent of global population. Rapiddemographic changes have been witnessed in thisregion. China and India account for more .020.150.340.470.520.450.570.440.390.450.44half of Asia’s total population. In absolute termsChina has shown significant improvement incontrolling fertility rate through successfulgovernment policies. Its total fertility rate hasdeclined from 5.5 in 1970 to 1.5 children per
182Pakistan Economic Survey 2013-14woman. On the other hand in case of India,though the fertility rate is still higher than China,however it has shown good performance bylowering its fertility rate from 5.5 in 1970 to 2.4in 2014. In the light of current fertility rate, it isprojected that India will pass China in populationsize in about 15 years, becoming the world’s mostpopulous country, with about 1.5 billion people.If compared these indicators with Pakistan, it isobserved that Pakistan is lagging behind thesetwo countries with fertility rate of 3.2 in 2014.Asia has experienced remarkable demographicchanges, but the process, magnitude andconsequence of these changes have variedsignificantly. When observed by region, South Asiahas led the change over the past six decades — thelowest fertility and mortality rates in the world havebeen recorded in some East Asian populations inrecent years. The comparison of the data presentedin Table 12.4 shows that Pakistan is laggingbehind other neighboring countries in all theindicators discussed except Afghanistan.As a result the population growth is relativelyrapid and this rapid population growth makes itdifficult for economies to create enough jobs tolift large numbers of people out of poverty.Table 12.4: Family Planning Indicators of Regional CountriesCountryTotal FertilityContraceptivePopulation GrowthRatePrevalence Rate epal2.6501.8Pakistan3.2351.9Sri Lanka2.1680.8Source: CIA fact sheet 2014Population Projections for the 10th Five Year People’s Plan 2010-15World Population Data sheet 2013MMR(2010)460240180372006017026035Population dynamics are important to promote theeconomic development and security in Pakistan. Atpresent, Pakistan is the 6th most populous country inthe world. However, population welfare programmesare playing important role to create awarenessamong people.industrial sector, large-scale migration of ruralresidents to towns and cities takes place. During thisprocess, the growth rate of urban areas is typicallyincreasing and the pace of overall populationincrease. Table 12.4 presents the details of urban andrural population.Reduction in population growth is one of the toppriorities of the government to balance betweencountry’s resources and population. In this context,Family Planning Programs contribute significantlyas there is negative correlation between the TotalFertility Rate (TFR) and the ContraceptivePrevalence Rate (CPR). The decline in the TFRcould be more substantial if there is greater use ofcontraceptives in the country. Contraceptiveprevalence rate has increased from 30 percent in2013 to 35 percent in 2014. The increase incontraceptive prevalence rate in Pakistan is causedby increase in female literacy, awareness throughmedia and easy access to contraceptive techniquesand tools.In Pakistan cities are growing rapidly as a result ofthe movement of people from rural areas in search ofjobs, opportunities to improve their lives and tomake a better future for their children. Moreover, thelack of basic facilities in rural areas like; electricity,sanitation, safe drinking water, health care andschooling are some of the reasons for rapidurbanization. The population in rural areas decreasedfrom 62.1 percent in 2013 to 61.4 percent in 2014whereas the population in urban areas increasedfrom 69.87 million (37.9 percent) in 2013 to 72.5million (38.56) percent in 2014. Urbanization is notsimply the growth of populations living within legaladministrative boundaries of towns and cities. It alsotransforms both urban and rural lifestyles. Theannual population growth in urban areas is expectedto increase further in coming years which may causesocio economic problems in future.UrbanizationUrbanization is one of the serious global problems.As development takes place from agricultural to an
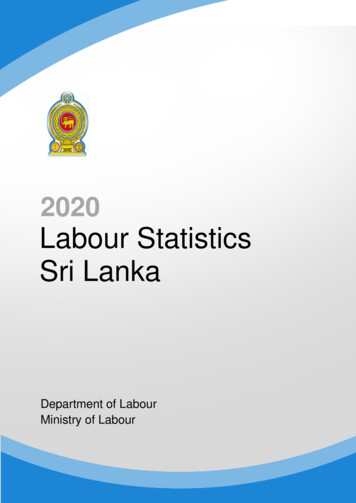
Population, Labour Force and Employment183Fig-12.3: Urbanization140120100806040200200920102011Urban PopulationMillennium Development GoalsMDGs were set up in the United s were made by all the countries toreduce poverty and hunger and disease, greatersurvival prospects for mothers and their infants,better educated children, equal opportunities forwomen, and a healthier environment. Accordinglyeight Millennium Development Goals with 48indicators provided a framework of time-boundtargets. There are eight MDGs and these are to beachieved by 2015i)Eradication of extreme poverty and hungerii)Achievement of universal primary educationiii)Promotion of gender equality and women’sempowermentiv)Reduce child mortalityv)Improve maternal healthvi)Combat HIV/AIDS, malaria, tuberculosis andpoliovii) Promotion of environmental sustainabilityviii) Develop a global partnership for development.Pakistan has adopted 16 targets and 41 indicatorsagainst which progress towards achieving the eightgoals of the MDGs is measured. Time series data isavailable only for 33 indicators due to resourceconstraints and low expenditure in these sectors.Pakistan is on track to achieve the targets against 11indicators whereas its progress on 22 indicators isoff track. The goals particularly relevant topopulation welfare are goal 3, 4 and 5 which arediscussed below.Promotion of Gender Equality and Women’sEmpowermentEducation is the most important factor which paves2012Rural Population20132014the way to development process in all areas of lifeand in turn leads to gender equality and womenempowerment. The first indicator under MDG 3therefore aims to eliminate gender disparity inprimary and secondary education by 2005 and in alllevels of education by 2015.Gender parity is at the core of the MDGs. Pakistanhas improved slightly in gender parity in primaryeducation, secondary education and youth literacybut still progress on these indicators is off track.Gender parity in education for primary has improvedfrom 0.82 percent in 2001-02 to 0.89 percent in2012-13, in secondary education the increase is from0.75 percent in 2001-02 to 0.89 percent in 2012-13.Youth literacy Gender Parity Index (GPI) hasincreased from 0.65 percent in 2001-02 to 0.82percent in 2012-13.The second important indicator of goal 3 is share ofWomen in Wage Employment in the NonAgricultural Sector, which is defined as the share offemale workers in the non-agricultural sectorexpressed as a percentage of total employment in thesector. This indicates the degree to which labourmarkets are open to women in industry and servicesectors, which affects not only equal employmentopportunity for women but also economic efficiencythrough flexibility in the labour market and reflecteconomic factors in social empowerment of women.The empowerment and sovereignty of women andthe improvement of their political, social, economicand health status is vital for the achievement ofsustainable development of any country. Womenparticipation in economic development and decisionmaking process is well recognized in Pakistan andthegovernmenthasshownconsiderableimprovement in empowering women in botheconomy and decision making. In Pakistan, the shareof women in non-agricultural wage employment hasbeen set at 14 percent. This share of women
184Pakistan Economic Survey 2013-14employment has consistently increased from 8.07percent in 1990-91 to 10.12 in the year 2012-13 butit is still behind in achieving this target.Historically, in Pakistan women did not havemeaningful representation in the country’slegislative forums. The situation greatly improvedwith the passage of time as their representation rosefrom 0.9 percent and 1.0 percent in 1990-91 and 18percent (60 seats reserved for women out of 342seats) and 17 percent in 2011-12 in both the NationalAssembly and Senate, respectively. Moreover,women Parliamentarians have contributed throughlarge number of resolutions raised and passed, andquestions asked in the Parliament.Reducing Child Mortality and MaternalMortalityInfancy and childhood periods of human life areoften threatened by major potential risks to survivaldue to a number of reasons. In Pakistan, a number ofinterlinked elements like poverty, malnutrition,mother’s health, medical care etc significantlyaffects the rates of Under-five mortality, infantmortality and maternal mortality.Pakistan has set the objective of reducing the underfive child mortality (U5MR) by two thirds. Underfive mortality fell from 117 deaths in 1990/91 to 89deaths per 1,000 live births in 2012/13; and theinfant mortality rate during this period reduced from102 to 67.5 deaths per 1,000 live births.While looking at MDG 5 regarding improvement inmaternal mortality in Pakistan it can be said that thegovernment is putting serious efforts to achieve thistarget. By 2015, Pakistan planned to reduce thematernal mortality rate (MMR) by three-quartersand ensure universal access to reproductive health.MMR has been almost halved (down from 490 in1990 to 260 in 2010 per 100,000 live births), and theuse of contraceptive has almost tripled (up to 35.4percent) in 2012-13.The proportion of birthsattended by Skilled Birth Attendants (SBAs) directlyimpact on the maternal mortality rate. The share ofdeliveries attended by skilled personnel has gone upto 52 percent in 2012-13 from 24 percent in 200102.The total fertility rate at 3.2 percent remainsconsiderably higher than the target of 2.1percent.Thesituation demands immediate attention andconsistent efforts to improve this rate further.EmploymentEmployment is the key mechanism through whichthe benefits of the growth can be distributed to thepoor segment of the society. Access to decent workis thereby vital in the process towards reduction inpoverty and income inequality. Provision ofemployment opportunities depends upon availableresources, technological base, advancement, andinstitutional strategies. Similarly, human resource,skills, and technical competency determine theoutcome of employment which contributes inachieving sustained economic growth.Pakistan is the 10th largest country in the worldaccording to the size of the labour force.Employment-Unemployment Statistics of thecountry is an important input for policy and planningpurposes. The latest statistics shows that the totallabour force has increased from 50.0 million in2005-06 to 59.7 million in 2012-13. It shows thatmore than 9 million people joined the labour forceduring this period. On the other side, the number ofemployed labour force increased from 46.95 millionto 56.0 million during this period. This means thatall the increase in labour force could not be adjustedin employment sector and therefore unemployedpeople increased from 3.10 million to 3.73 millionduring the same period. The details of labour forceand employment status is presented in the followingTable.12.5Table-12.5: Civilian Labour Force, Employed and Unemployed in our .0950.7953.21Unemployed3.102.682.692.933.12Source: Pakistan Bureau of Statistics (Labour Force Survey 2012-13)The country has the blessing of demographicdividend. The population between the age of 15-49are filled with tremendous and towering ambitions.It will be a great wastage of human resources ifthese youth are not given an opportunity to exercisetheir talent. The increase in unemployment showsthat the potential of youth was not fully utilized inPakistan in the past. Unemployment is a multi-2010-1157.2453.843.40(in million)2012-1359.7456.013.73dimensional and complex issue which starts avicious cycle of associated problems likeinvolvement of youth in bank and householdburglaries, social insecurity, lawlessness, use ofdrugs, etc. Therefore it is the government’sresponsibility to provide the youth proper facilitiesin getting abreast with the knowledge of the modernera. To minimize the problem of unemployment and
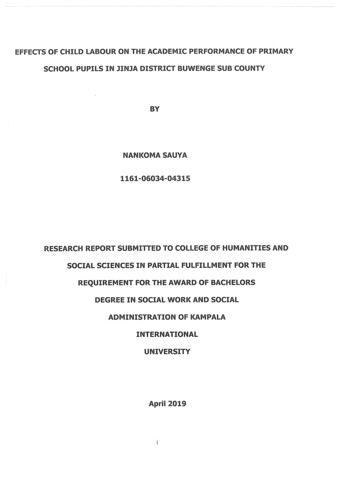
Population, Labour Force and Employmentto utilize the national work force for the bettermentof the country, the present government has launcheda number of youth promotion and youth investmentschemes. Involvement of the youth in these schemeswould bring quicker and better results in terms ofchange in lifestyle and socio-economic developmentof the country.Labour Force ParticipationThe labour force participation rate is a measure ofthe proportion of a country’s working-agepopulation that engages actively in the labourmarket, either by working or looking for work. Itprovides an indication of the relative size of the185supply of labour available to be engaged in theproduction of goods and services. The breakdown ofthe labour force by sex and age group gives a profileof the distribution of the economically activepopulation within a country.The labour force participation rate is calculated byexpressing the number of persons in the labour forceas a percentage of the working-age population. Thelabour force is the sum of the number of personsemployed and unemployed. The working-agepopulation is the population above a certain ageideally aged 15 and older-prescribed for themeasurement of economic indicators.Table-12.6: Crude and Refined Participation Rates(%)Indicators2009-102010-112012-13Crude Activity (Participation) Rates 19.319.419.3Indicators2009-102010-112012-13Refined Activity (Participation) Rates rce: Pakistan Bureau of Statistics (Labour Force Survey 2012-13)Age Specific Labour Force Participation RateIt is instructive to look at labour force participationrates for males and females by age group. Labourforce activity among the young (15 to 24 years)reflects the availability of educational opportunities,while labour force activity among older workers (55to 64 years or 65 years and over) gives an indicationof the attitude towards retirement and the existenceof social safety nets for the retired persons from thegovernment job. Labour force participation isgenerally lower in females than males in each agecategory. Male Labour force participation rate istouching to 100% in some age groups, whereasfemale Labour force participation rate is still lowerthan 30% in some groups. Sincere and committedefforts from government in terms of creating moreopportunities for female can enhance femaleparticipation rate in economic activity. This reality isevident from developed economies, where theprofile of female participation is increasinglybecoming similar to that of men and the rates arealso approaching to male levels.
186Pakistan Economic Survey 2013-14Table-12.7: Age Specific Labour Force Participation Rate 950-5455-5960 .926.613.6Source: Pakistan Bureau of Statistics (Labour Force Survey 2012-13)Fig-12.4: Age Specific Participation Rate1202009‐10 Male2010‐11 Male2012‐13 Male2009‐10 Female2010‐11 Female2012‐13 3435-3940-4445-4950-5455-5960 Age Group (Years)Employment by SectorsPakistan has endowed a rich and vast naturalresource base, covering various environmental andclimatic zones; hence the country has great potentialfor producing all types of food commodities.Agriculture has an important direct and indirect rolein generating economic growth. The importance ofthis sector is manifold as it feeds people, providesraw material for industry and is the base of ourforeign trade. Almost 67.5 percent people are livingin the rural areas and are directly involved in thissector. The number of labourers engaged inAgriculture accounts for 43.7 % of the total labourforce. The total labour force working in theAgricultural sector has decreased from 45 percent in2009-10 to 43.7 percent in 2012-13. The mainreason of this change is due to technicaltransformation, labour is being replaced bymachines, thus limiting work opportunities inagricultural sector and this coupled with naturalcalamities in the form of droughts and floods haveled reduction in the income levels and thereby hasled to decline in its employment.The manufacturing and construction sectors are alsoplaying an imperative role in the provision ofemployment. In these sectors the total participationrate has increased while the female participation ratehas declined in 2012-13 as compared to 2009-10.The wholesale and retail trade sectors do not providebetter employment opportunities and therefore theshare of employment has reduced during this period.The community/social and personal services sectorcomprises various subsectors; overall the share ofemployment has increased from 11.2 percent in2009-10 to 13.3 percent in 2012-13.
Popullation, Labouur Force and EmploymenntTable-12.8: Employmentt Shares by SectorsS(%)Major ture/ forestry/45.0336.6744.945.136.275.4hunting & structionn6.78.500.37.08.90.2Wholesale & retail16.3220.222.116.220.41.6tradeTransport/ sttorage &5.26.600.35.16.60.1communicatiionCommunity/social &11.2111.211.210.810.811.5personal servvice*Others2.43.000.22.12.60.3Source: Pakistan Bureau ofo Statistics(Laabou Force Suurvey 2012-133)Note: Labourr Force Survey was not pubblished in 5.57.00.2213.313.911.551.62.00.22Fig-12.5 (AA): Sector-wise Employmennt Share (20112-13)113%%2%Agriculturee / forestry / huntiing & fishing44%Manufacturring6%ConstructioonWholesale & retail trade14%Transport / storage & commmunicationCommunityy / social & persoonal serviceOthers7%14%%Fig 12.5 (B)-Sector-wwise Employmment Share (22009-10)11%%3%Agriculturee / forestry / huntting & fishing45%5%ManufactuuringConstructioonWholesale & retail trade16%Transport / storage & commmunicationCommunityy / social & persoonal serviceOthers7%13%Formal andd Informal SectorSThe informmal sector playspa mommentous rolle indeveloping countries’ ecconomies inccluding Pakiistan.The role ofo the inforrmal sector in solvingg theunemploymment problemm of less devveloped counntrieshas becomee the focus ofo a conceptuual and empiiricaldebate in reecent years. TheT importannce of this sectornecessitatess that it shhould be ussed as a policyinstrument for the sollution of the most presssingprobblems such as unemployyment, poveerty, incomeeineqqualities, etcc. The impoortance of thetinformallsectoor can be measured by its conntribution toonatioonal incomme and employmentt and itssconttribution to financialfcreedit as comppared to thattof thhe formal secctor.The informal seector generaates the highher level offempployment, 73.6 percent in 2012-13 as compared tooformmal sectors, annd 26.4 perceent in the samme period.
188PPakistanEcoonomic Surveey 2013-14Table-12.9: Formal and informaliSector-Distributtion of Non-AAgriculture 100.01100- Formal26.7726.726.926.225.928
Adult population is considered as wealth of a nation in terms of human resource. This Table shows that 56 percent population is in the age group of 15-64.This productive age population is the main source to ensure accelerated economic growth. Policy makers may take advantage of this growing working class in reducing dependency burden in the future.