Transcription
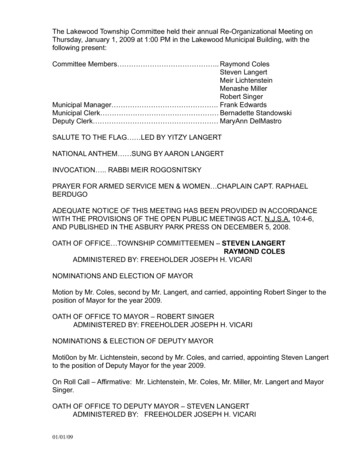
Resolving the halftone resolution issue:how many dpi does it take to make an lpi?by Brian P. LawlerWhen scanning an image, or working with imagesis based on misunderstanding of the basic conceptsfrom digital cameras, one should understand theof image elasticity and the relationship of images tomathematics of halftone reproduction. It’s easytheir final halftone patterns.math; it requires only multiplication or division toArmed with the information in this handout,get the needed information.you will be able to work with images and turnAs with any complex85 lpi133 lpi150 lpisubject, understanding the Oversample Rateconcept is the most1.25:11.13 MB2.74 MB3.47 MBimportant factor in finding1.5:11.61 MB3.93 MB4.98 MBsuccess. With resolution1.75:12.18 MB5.34 MB6.8 MBissues the concept is to scanan image with an adequate2:12.84 MB6.96 MB8.85 MBamount of information soThis chart demonstrates how an 8.5 x 11 inch full-bleed image changes in size according to itsthat an excellent halftoneimage results. Too much – oversample ratio and halftone frequency. Curiously, the 8.85 MB and 4.98 MB files reproducethe same. Which would you rather store? Which would you rather transfer across a network?or too little – information inthem into excellent printed halftones. The resultingthe scan can either ruin the image or cause aimages will be effective for the desired purpose asdeadline to be missed and run-up unnecessarylong as you work within the practical limitations ofexpense in production.image elasticity, and as long as you are careful toDigital images are elasticscan correctly and to work from good originalsA digital photograph, made up of pixels in rowswhenever possible.(often called a raster image), can be reproducedlarge or small – these images are elastic – to aThe concept of oversamplingpoint. I often read or hear preposterousOversampling is the process of scanning more thaninformation about digital images, information thatone pixel for each halftone dot in the finalreproduction. The idea is sound: to prevent theduplication of a pixel value in halftone patternsThese images illustrate(sometimes called pixelization), one must providethe relationship betweenthe halftone generating device with enoughhalftone dots and theinformation as to provide a unique tonal value forpixels in the file thatcreated them.each and every potential halftone dot in the finalimage.We need to oversampleCertainly there are areas in a photographpixels for conventionalwhere the pixels are of the same reflective value inhalftones – but to whatthe file, and the halftone dots in the the finaldegree?reproduction will be the same. This is fine, as longas these similarly-toned pixels represent theConventional wisdomtonality of the original image.dictates that theWhat we don’t want to happen in an image isoversampling ratioshould be 2:1. But manyfor a single pixel in an image to generate two orhave disproved thismore halftone dots in the the final halftone. Whentheory, opting instead forthis happens, you get jagged edges on diagonallower ratios – values oflines (computer scientists call them jaggies). These1.25:1 or 1.5:1 – whichare pixels that don’t replicate the tones in theprovide good images thatoriginal image accurately.print as excellentMany theories exist on the issue of scanning,halftones, and are usuallyandmost of them work. Whether you abide by theindistinguishable fromconventional wisdom of two pixels per halftone dothalftones printed fromhigher resolution files.(2:1) or a lower relationship (1.5:1 or 1.25:1 forexample), you will usually get a good image. JustCopyright 1996-2003 Brian P. Lawler. All rights reserved.ELECTRONIC EDITIONv.12 5/15/031
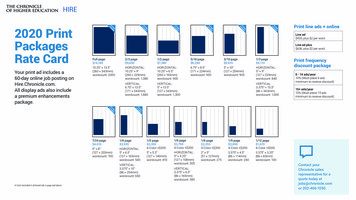
remember that there is no absolute right or wrongwith regard to this process (despite what I say fromtime to time).Another thing to remember is that there issuch a thing as too much image resolution. AdobePostScript RIPs, (and I assume those devices thatmimic Adobe RIPs) set an image resolution limit of2.5 times the halftone frequency, thus the upperlimit is 2.5. Providing any more than that willresult in useless processing in the RIP to reduce theoversampling ratio to 2.5 or less before processingthe halftone.the same digital data to make dotless patterns forthe description of tonal information.Called stochastic, or VoltsThermal noiseTemperatureBandwidthin HzNyquist’s Theorem30% gray tone30% halftonepatternTonal values are represented by halftone dots as apercentage of printed area. The halftone dots on the rightrepresent 30 percent of the possible printed area on the page,thus create the illusion of a 30 percent gray value. This ratioof inked-to-non-inked area is called “Dot Area.”Conventional halftone dotsWhen we use halftone patterns, the printed imageis creating a simulation of tonality. It’s really just anoptical illusion that there are varying tones of grayor color on the printed page. In reality there is justone solid color of ink. To create the illusion oftonality, halftone dots are rendered with varyingareas. Small black dots reproduce the light tones inthe original, while larger black dots reproduce themid-tone values in the original, and tiny white dotsreversed-out of black reproduce the shadows in theoriginal.Our eyes and brain work together to averagethe reflective values of halftone dots into perceivedtonality. We look at little dots of solid ink, and wethink we see tonal variation, thus halftone patternswork. The halftone process was invented bylithographer Frederic Ives in 1878 (He was half ofthe famous Currier & Ives partnership).While most halftone patterns are based onvariations of round or elliptical dots, it’s notnecessary for halftone images to be made of dots atall!screening, the technique is to disperse the spotcomponents of the halftone pattern randomly tocreate the illusion of tonality. If an imagesettermakes a single halftone dot by drawing a cluster ofspots in a circular pattern, what would happen ifthose same component spots were distributedrandomly (or pseudorandomly) around the samecell area of the halftone dot – but not clusteredtogether? Interestingly, these stochastic techniquesresult in the same image, but with no recognizablepattern of dots!There are several advantages of using stochasticpattern images in print. First, these images have noscreen angles, which makes it possible to printmore than four colors to make a full-color imagewithout creating moiré patterns.Second, stochastic images appear to have moredetail, and this is most likely a result of theinformation in an array of dots centering itselfwhere the image had detail information, ratherthan in the center of the halftone cell as is the casewith conventional electronic halftone images.Nyquist’s TheoremHarry Nyquist was an electrical engineer whoworked at AT&T Bell Labs from about the 1919until his retirement in 1954. The theorem thatcarries his name was a watershed for engineersinvolved in signaling and signal-to-noise ratiocalculations.From 1912-1915, Nyquist did hisundergraduate work at University of NorthDakota, where he also received his Maser’s degree.He then went to Yale, where he received his Ph.D.in 1917. Nyquist lived and worked in the era oftelegraphy, and was employed after completing hisdoctoral work by AT&T, the American TelephoneStochastic tonal patternsRecent developments in screening technique haverevived a system developed in the 1950s that usesTest ETest ATest DTest BTest C1:11.25:11.75:11.5:12.0:1USM: 50%USM: 70%USM: 75%USM: 80%USM: 100%2Copyright 1996-2003 Brian P. Lawler. All rights reserved.ELECTRONIC EDITIONv.12 5/15/03
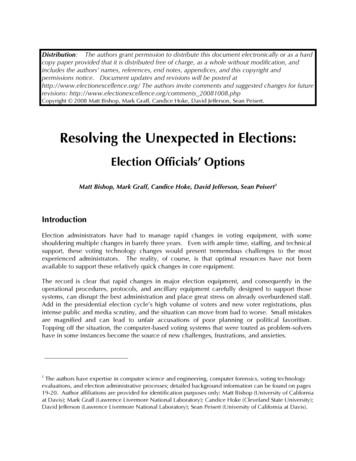
A conventional halftone sampled at 120 pixels per inchA simulated stochastic halftone sampled at 75 pixels per inchand Telegraph Company, at their research labs inNew Jersey.Prior to Nyquist’s work, there was nomathematical standard for signal strengthcalculations. Radio engineers would transmit largeamounts of energy to get a signal to a receiversuccessfully. Nyquist’s research showed that twicethe noise value needed to be broadcast to get asignal to a receiver successfully. Any more thantwice the noise value was wasted.It was a great relief for broadcast engineers torely on Nyquist’s Theorem, saving muchuncertainty and energy in getting their signals fromPoint-A to Point-B through “the ether.”More is not always betterA conventional halftone sampled at 90 pixels per inchMany people, believing that if 2:1 yields a goodhalftone (it does) believe that 4:1 will yield evenbetter halftones (it doesn’t). Nyquist tells us thattwice the sampling value is needed, and my testingshows that any more than 2:1 is wasted; halftonequality does not improve with higher samplingrates. Ratios beyond 2:1 simply waste time andmoney (Adobe engineers, fully aware of Nyquist,put the 2.5:1 resolution limit in PostScript for thisexact reason).The concept of Nyquist’s Theorem is valid: weneed to sample four pixels per halftone dot (a 2:1linear ratio) or slightly fewer in order to achievesuccess in halftone reproduction. But how manyfewer?Experimentation will demonstrate that ratiossignificantly lower than 2:1 work quite well. I havefound that this is often determined by imagecontent; people-pictures reproduce nicely withlower ratios, while highly detailed images ofmachinery, furniture or fabrics usually requirehigher ratios.A conventional halftone sampled at 75 pixels per inchCopyright 1996-2003 Brian P. Lawler. All rights reserved.ELECTRONIC EDITIONv.12 5/15/033
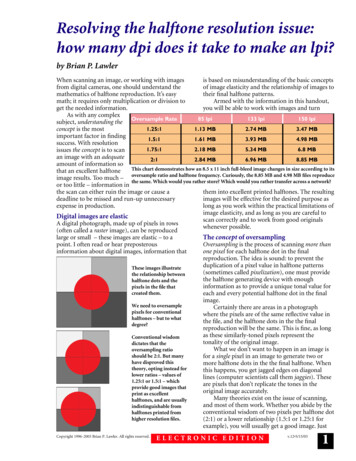
Oversampling ratio testsOne way to determine the best ratio of pixels tohalftone dots is to test the process with a series ofscans, and then print the results. Shown at thebottom of page 2 is a chart of recommended scans.They range from 1:1 to 2:1. Notice that each scanis named with a letter that does not relate to theoriginal (the same image is split by a prism andfiltered through color separation filters). Thefourth PMT sensor sees a monochromatic image,filtered only by a neutral-density filter, but with alarger aperture than the other three. The largeraperture gives a microscopic “advance look” attonal changes in the image being scanned. TheseAn oscilloscope monitoring the neutral gray photomultiplier tube on a drum scanner sees tonality as a function of varyingvoltages. When the voltage changes quickly, an edge is sensed. By adding a momentary spike to the high and low points on thesignal, the scanner changes the density at that edge by drawing larger and smaller halftone dots. The technique is called UnsharpMasking. The same technique takes place in programs like Adobe Photoshop by analysis of pixels and their neighbors. Whentonal differences are found, the edges are enhanced by a computer algorithm that darkens and lightens the pixels along the edgesof tonal change.image size. This is handy when evaluating theimages after printing. Prepare the test by scanninga good image at various resolutions.Remember also that apparent sharpness is afactor in your resolution experiments. In the chartat the bottom of page 2 are recommendations forresolutions as well as unsharp masking amounts.Lower sample rates usually require sharpening tomatch the appearance of higher-ratio sampledimages. Let’s take a quick tangent to discussunsharp masking .Unsharp masking conceptUnsharp masking gets its name from a maskingfilm that was used when color separations weremade on process cameras and precision enlargers.The masking film was used to adjust the density ofindividual colors to compensate for the variationsin density of the three color separation filters –red, green and blue – used to make separations.When masking films were used in contactexposures, the edges of tones were enhanced by theslightly unsharp emulsion of the masking film.Lithographers learned to use these masking filmsto modify the appearance of sharpness in the colorseparations they made; the process became knownas unsharp masking.Most drum scanners have an electronicvariation on the theme of unsharp masking. Highend drum scanners feature four photo-multipliertubes that analyze the tonality of the originalimage. Three of the PMT sensors see alreadyseparated red, green and blue images of the4Copyright 1996-2003 Brian P. Lawler. All rights reserved.tonal changes are monitored by an unsharpmasking logic circuit; when a tonal change ofappropriate value occurs, the circuit modifies theother three signals to enhance the edge where thetonal change takes place (see illustration, above).Thus unsharp masking is a syntheticenhancement of tonal edges to make those edgesdarker – or lighter – than they would have been ifthey had been left alone.Almost every image intended for halftonereproduction is made better by some unsharpmasking. The resulting images are visibly superiorto those not sharpened.Unsharp Masking in practiceUnsharp masking requires understanding the threevariables in the Unsharp Mask control panel inAdobe Photoshop. The first element in the controlis Percentage. The range is 1 to 500 “percent”(Photoshop’s settings are odd compared the rest ofthe industry which uses a scale of 0-100), withreasonable values between 1 and about 200percent.In general, larger files need more unsharpmasking. A five megabyte file will be sharpenednicely in the 75 percent range, while a 25 megabytefile will require about 125 percent for about thesame visual impact.The second variable in Photoshop unsharpmasking is the Diameter, designated in pixels. Avalue of 1 is usually adequate here as largernumbers tend to draw outlines around things! Asfiles get larger, you can increase the DiameterELECTRONIC EDITIONv.12 5/15/03
setting to get an effective unsharp masking edge.The third variable is the Threshold value. Thissetting determines how much tonal change musttake place for an unsharp masking event to takeplace. With photos of delicate subjects, diffusefacial detail for example, a number in the 3 to 4range is adequate. A zero value will sharpen everytonal difference, which may be too heavy-handed.You must be the judge of the correct setting forThreshold depending on the image.Now, back to the scanning test The method is to scan at a variety of oversampleratios, then make halftone film from the images;proof the results and evaluate them in a blind test(where the resolution values are not known to thejudges). All should be made from a goodphotograph, scanned on a capable scanner (youcan substitute a Kodak Photo CD, and job-out thescanning in the process).Choose a halftone frequency appropriate toyour printing process. For commercial offsetprinting use 150 lpi; for newsprint, use 85 or 100lpi. Quality web-printed publications (Time andNewsweek are good examples) typically use 133 lpi.If you are unsure of the correct halftone frequency,ask your printer to give you the best value for theirprocess.After completion, have a group of impartialjudges view the results, voting for the image thatseems to be the “best.” The results will likelysurprise you.If you really want to push this issue, scan aphotograph of a person for one set of tests, and aphotograph of wicker furniture (or somethingwith lots of detail) for the other. You’ll then see thedifference between the effects of resolution onimages with different amounts of detail.Time equals moneyTime really is money in this business, as a minutesaved in a typical prepress cost center is usuallyworth 1.00 or more (average is 1.25 per minute).One advertising agency that ran this test foundthat the savings was really worth the effort. Priorto running the test, the firm was routinelyscanning images at 3:1, resulting in full-page, fullbleed, four-color files of 79.7 megabytes!After doing the test, and satisfying themselvesthat lower resolutions yielded equal results, theysettled on a ratio of 1.5:1. These same ad files werereduced to about 19.9 megabytes, a savings of 60percent in every area of production – disk space,network transfer time, and – most importantly,imagesetter RIP time.If you could reduce your prepress storage,network communications and imagesetting timeby 60 percent without a quality loss, wouldn’t youdo it?Copyright 1996-2003 Brian P. Lawler. All rights reserved.If you translate this firm’s savings into intoproductivity, this means that there is more diskspace, more time available on the network, andmore work completed in a shift. Translate thesavings into dollars, and you discover that forevery 100 spent on the old plan there is now 60(more than half their money!) available forincreased salaries, new equipment, and expansion– all better investments than digits needlesslywritten to a hard disk!Running the tests takes about one businessday. This may seem like a waste of time, but theresult is well worth the effort.Resolution mathWhere do we start when it comes to calculatingresolution sizes and scan ratios?The math needed to calculate the resolution ofany file is really quite simple. It is a three-elementmultiplication equation that yields a value forresolution. I’ll present three variations here fordifferent situations:1. You want to scan an imageand need to know the resolution2. You have an image already scanned (or adigital photograph) and need to know howlarge it can be in print for a given halftonefrequency3. You have a space to fill, and need to knowhow many pixels of data to scan or captureto fill the space.First, the calculation for scanning resolution:Q x lpi x % R where Q is the oversample ratio you havechosen from your test, used as a multiplier; lpi isthe halftone frequency expressed in lines-per-inch,and % is the percentage of enlargement orreduction expressed as a decimal number. R is theresulting resolution. Following is an example ofthis formula at work. Use a pocket calculator tomake the calculations:A 5 x 7 reflective photo needs to be enlarged to9 inches vertical (7 inches to 9 inches). We beginby calculating the enlargement by dividing whatwe want by what we have: 9/7 or 128% – whichwhen expressed as a decimal number is 1.28.The oversample value – Q – we will choose forthis example is 1.5, that being a reasonable valuethat neither pushes the limits of quality, nor clogsthe system with digital cholesterol. Our halftonefrequency is 150 lpi.Armed with these three variables, we can nowcomplete our resolution calculation:1.5 x 150 x 1.28 288The Associative Law applies here, so you canELECTRONIC EDITIONv.12 5/15/035
multiply these numbers in any order and still getthe same result: 288. Use this value to set theresolution of the scanner (some scanner controlpanels allow you to set the percentage with asoftware control; for this formula to work, youmust leave this setting at 100%).Fixed-resolution calculationsWith fixed-resolution images, the equation has thesame elements, but the math is twisted around toaccommodate the fact that we have no control overthe scanner – the file has already been scanned.Fixed-resolution images are those from CDROMs, files supplied by clients and servicebureaus, stock photos, Internet-source images, andphotographs from digital cameras.We have an image; we need to know how largethat image can be in print. The formula for fixedresolution images is:D(Q x lpi)where D (in pixels) is the dimension you arecalculating (I usually check the longest dimensionfirst), Q is the oversample value, and lpi is thescreen frequency in lines-per-inch. Following is anexample:We plan to use a digital photograph whosedimensions are 1960 x 3008. We are planning toreproduce this image in a full-page broadsheetnewsprint ad (13.5 x 22 inches) in the local dailypaper. The newspaper uses a screen frequency of100 lpi. We will probably need to crop the imageafter we open it, so we’ll see if this image is largeenough. We’ll use a Q value of 1.25 here (as low asI ever go with conventional halftones). Here’s themath:3008(1.25 x 100)Mathematics rules tell us that we must execute thepart in parentheses first, so we multiply the Q bythe lpi (1.25 x 100) first, then perform the division.so we end up with:3008125or 24.064 inches (vertical). This is the maximumdimension to which I can enlarge this image underthese circumstances. When I test the otherdimension (1960 pixels) I get a reproduction sizeof 15.68 inches, just enough to fill that broadsheetpage (horizontally)with a small amount of roomfor cropping.variables described here: screen frequency, Qvalue, and number of pixels. If you have thesefacts, you can calculate the usefulness of any fixedresolution image for any task – be it a postcard ora billboard.When you have a space,but need to know the number of pixelsIf you have a space in a page layout, and need tocalculate how much of a digital file you need to fillthe space, the formula is:Q x lpi x inches pixelsThe product of this equation is the number ofpixels needed to fill the space. Let’s see an example:We have designed a full-page ad, and allowed aspace for a photo that is 9 inches tall by 3.25 incheswide. We are printing by web-fed offset, at 133 lpi.The Q value chosen is 1.41† and we will multiplythem all together to get the number of pixels weneed in the image.1.41 x 133 x 9 1687.7You can’t have a partial pixel, so it’s best to seek1688 pixels (or 1700 to be more cavalier!). In thisexample we’ll use a scanner to prepare the file:We’re looking for an image with at least 1700pixels in the vertical dimension to fill the 9-inchspace.Most scanners have controls for the resolutionof the resulting image. We should set the scannerto produce an image with these dimensions, orslightly more, and the result will be satisfactory –or better. This is one of a series of essays on the use ofcomputers in the graphic arts. Others are availableon a variety of subjects from black and whitescanning to managing color images for the WorldWide Web. You are welcome to download theothers from my FTP site, and reproduce them foryour associates and clients. You may not charge forthem, nor change the content in any way.Brian P. LawlerGraphic Arts Consultant6045 Madbury CourtSan Luis Obispo, California 93401 USATelephone: 805 544-8814Fax: 805 544-8445Email: brian@thelawlers.comhttp://www.thelawlers.comBUT YOU CAN’T DO THAT!!!A person attending one of my seminars exclaimedone day that digital photos just can’t be enlargedthat much – but it’s simply not true. Digital imagesare elastic; their ultimate size depends on the6Copyright 1996-2003 Brian P. Lawler. All rights reserved.†1.41 is the hypotenuse (diagonal) of a square. Severalindustry experts have proffered this value as a valid Qnumber because it is the diagonal of a potential halftonecell. The value works fine, but I think that’s a happycoincidence.ELECTRONIC EDITIONv.12 5/15/03
A “virtual” light source shines through a “virtual”halftone screen onto a grid of pixels that werescanned from the original image.The virtual halftone screen containsfrequency information andscreen angle.The scanned file – or bit-map – of the imageshown here at 2:1 halftone frequency.Each pixel has a numeric value from0 (black)to 255 (white).Average of 118, 089, 101, 096 101(or 101/256 or 39.45 white or 38.45% reflective black)This average value is carried to the halftone generator where a spot function is applied toconvert the value into a halftone dotof the required size and shape.This example shows a spiral-shapeddot, growing from the center out,and the imagesetter spots that willbe turned on to mark that dot onthe film.Different spot functions result indifferent shapes of halftone dots. or at smaller sizesA pattern of these dot-formationscreates a halftone pattern – the illusionof tonality – when they are smallenough to be confused by our braininto tones.Copyright 1996-2003 Brian P. Lawler. All rights reserved.ELECTRONIC EDITIONv.12 5/15/037
He then went to Yale, where he received his Ph.D. in 1917. Nyquist lived and worked in the era of telegraphy, and was employed after completing his doctoral work by AT&T, the American Telephone Thermal noise Temperature Bandwidth in Hz Resistance BoltzmannÕs Volts Constant Test E 1:1 USM: 50% Test A 1.25:1 USM: 70% Test B 1.5:1 USM: 80% Test D