Transcription
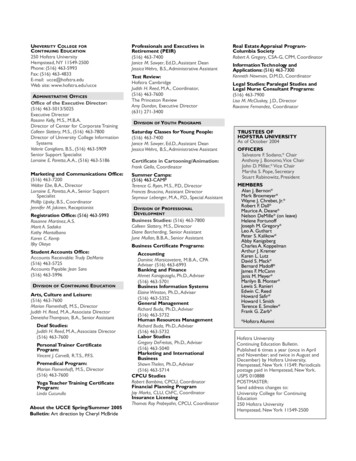
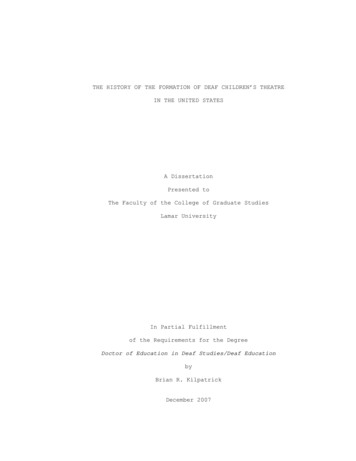
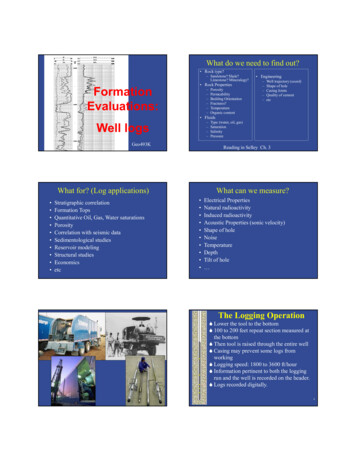
What do we need to find out? Rock type?– Sandstone? Shale?Limestone? Mineralogy?FormationEvaluations: Rock dding OrientationFractures?TemperatureOrganic content Engineering–––––Well trajectory (coord)Shape of holeCasing JointsQuality of cementetc Fluids––––Well logsGeo493KReading in Selley Ch. 3What for? (Log applications) Stratigraphic correlationFormation TopsQuantitative Oil, Gas, Water saturationsPorosityCorrelation with seismic dataSedimentological studiesReservoir modelingStructural studiesEconomicsetcType (water, oil, gas)SaturationSalinityPressureWhat can we measure? Electrical PropertiesNatural radioactivityInduced radioactivityAcoustic Properties (sonic velocity)Shape of holeNoiseTemperatureDepthTilt of hole The Logging Operation Lower the tool to the bottom 100 to 200 feet repeat section measured atthe bottom Then tool is raised through the entire well Casing may prevent some logs fromworking Logging speed: 1800 to 3600 ft/hour Information pertinent to both the loggingrun and the well is recorded on the header. Logs recorded digitally.6
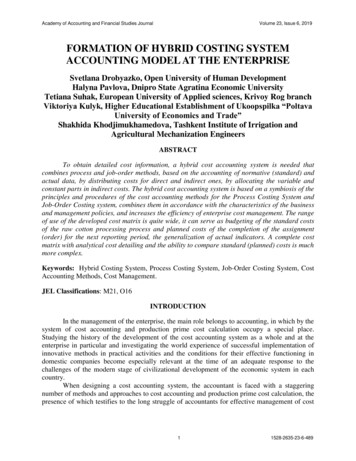
TitleServices AssociatedWith Data on LogBasic InformationCompany, Well NameLocationAPI NumberPermit NumberOther ServicesDuring Same TripWellbore EnvironmentDetailed Location &Depth, Diameter,Elevation InformationTemperature,KB Kelly BushingDF Derrick FloorMud ParametersGL Ground LevelEquipment & PersonnelLogging Engineer &8WitnessesLog Types Lithologic Logs– Spontaneous Potential (SP)– Gamma Ray (GR) Porosity Logs– Neutron– Density– SonicSpontaneous Potential (SP) cousticFMIMany more One of the Oldest Logging Measurements– Used Commercially in 1931 Discovered as Noise in Resistivity Found to be Related to Presence of Sandstone Lithology tool Resistivity Logs (Fluid Type)– Resistivity– InductionThe well works likea batteryE -K log (aw/amf)E is in millivoltsSurfaceaw water salinityamf mud salinityIon flow is easier inpermeablesandstonesDown hole
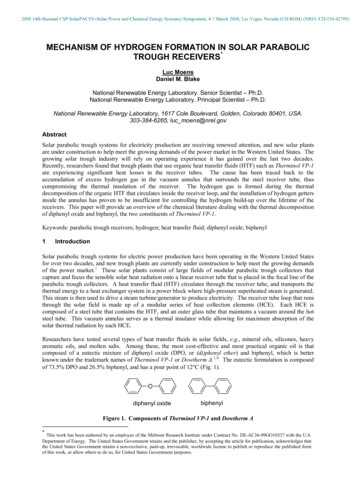
SP has PoorLimestoneResponseLimestonesTypical SP logGamma Ray LogSpontaneousPotential (SP)Drift SP readings aredepth-dependent SP andGamma Ray Gamma Ray in APIUnits Plotted on the left ofthe well Shales swing rightLithology logMeasures natural radioactivityUses a scintilometer (Geiger counter)Potassium (K), Uranium (U), Thorium (Th),Phosphorous (P)K abundant in clay shalesUnaffected by fluidsHigh U reducing environ. abundantorganic matter“API units”, relative to a standardMarcellus Gamma RayMahantango Fm.Green low GRPurple high GRPimpinella 1Lower MarcellusOnondaga LimestoneMegaEnergy Op. Inc.
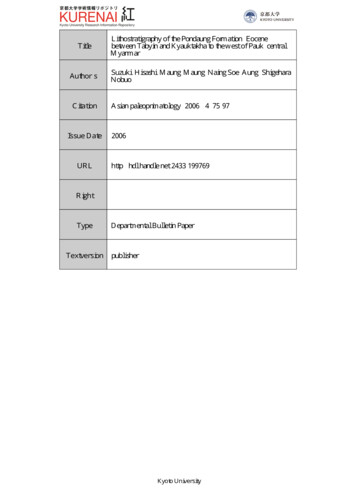
Spectral Gamma RayDistinguishes the different sources of gamma raysClaycontentOrganiccontentThe Borehole EnvironmentResistivity Log Applications Determination of Hydrocarbon-Bearing vs.Water-Bearing Zones Water Saturation Sw Geopressure Detection Depth of Invasion Stratigraphic CorrelationResistivityR resistivity(ohms)Increasing ResistivityResistivity of Saline Water - RwResistivity of Water and FormationResistivity of Water, Hydrocarbons,and FormationResistivity of Tight Formation(no porosity)Resistivity Tool Background Three Classes– Electrode Logs– Laterologs Focused Electrodes– Induction Measure Resistivity in OhmsNormal Resistivity ToolSpacing of electrodes determines penetration
Guard or Laterolog ToolThe guard electrodes focus the current in a narrowdiskInduction (Conductivity) ToolReceiver coil measures the induced electrical fieldcreated in the rocks by the transmitter coilWorks with oil based mud, or airLog Presentation and ScalesLog ScaleOhmsID, IM, LL8 measureresistivity at differentdistances form theborehole.ID deep inductionResistivity logs :sphericallyfocussed (SFL),mediuminduction (ILM),anddeep induction(ILD)IM medium inductionLL8 shallow inductionModel ResistivityLogsGas zone (50 )Water zone (2-20 Is there oil inthese reservoirs?Calculating Water SaturationSw (Rxo/Rt)5/8(Rmf/Rw)Rxo Resistivity of flushed zoneRw Resistivity of formation waterRmf Resistivity of mud filtrateFlushed zoneUninvaded zoneRt Resistivity of uninvaded zone
Resistivity Imaging LogsMudResistivityDataFMI FormationMicro ImagingWellbore EnvironmentDepth, Diameter,Temperature,Mud Parameters32Resolution vs. InvestigationSonic LogsMeasures of interval travel time in formation t ( sec/ft) 1/V t is related to Density which depends on:Lithology, Porosity, and Fluid Content Used to generate Synthetic Seismic tracesto link wells logs to seismic data33Log meas.Source-receiverarrangement for asonic logging toolPorosityGloverRock matrixPore fluid36
SlowFastSonic LogExampleCreating synthetic seismic data:ConvolutionWhich unit is thebest reservoir(low shale andhigh porosity)?WaveletAcoustic impedancefrom Sonic logSeismicReflectivitySyntheticSeismicWell KGS Brungardt #1Ellis Co., KansasDensity LogCorrelate seismic data (in time) to well data (in depth)Sonic Log Tool emits gamma raysDetects returning scattered gamma raysGamma ray absorption is proportional to rockdensity Measures Density - ρ Tied to Lithology, Porosity, and Fluid ContentPorosity CalculationDensity LogDPHI % PorosityRHOB Bulk Densityg/cm3
Neutron Log (CNL) Tool has a neutron sourceH absorbs neutrons and emits gamma raysTool detects the emitted gamma raysH is mostly in formation fluids (water andhydrocarbons) Can be run through casing Reads low in gas zones Cannot distinguish oil from waterPorositycalibration If lithology isknown,neutron anddensity logscan becalibrated EF photoelectric indexCross overindicates gasGamma Ray Response to Grain SizeApplications of logs Stratigraphic studies– Sedimentary facies Well correlation Reservoir models Structural interpretation– Fault recognition48
Relating log character to sedimentary faciesBuilding a reservoirmodel model1. Definefacies in core3. Predict facies in wellswithout core, but with good logs2. Relatefacies to log1600 wells4. Fill the gaps between wells108 Million Cells28 coresLog Datum Terminology KB - Kelly Bushing elevation. MD - Measured Depth along the wellborefrom the Kelly bushing (usually) SS – Subsea Depth (Relative to Sealevel) TVD – True Vertical Depth, (important fornon-vertical wells) SSTVD - Sub-Sea True Vertical DepthDIRECTIONAL DRILLINGCorrelationExampleMajor Sandson SPCorrelation of directional wellsDirectional WellVertical Well
Logging While DrillingData TransmissionMWD (or LoggingWD)Measurement While Drilling Tools are part of bottom hole assembly (BHA). Gamma ray, directional survey, tool face,borehole pressure, temperature, vibration, shock,torque etc. Telemetry for steering well Results transmitted digitallyMud Pulse Telemetry (Pressure pulses)Electromagnetic Telemetry (Using conductivity ofdrill pipe)Wired Drill Pipe (The future. Faster and better, butdelicate) mud pulser telemetry55GeosteeringFull Logs in Horizontal wells How do you move the logging tools through thehorizontal well? FMI and Dipmeter LogsFMI Formation Micro ImagerResistivity toolsDipmeterDipmeter InterpretationOlder, simplerversion of FMIVertical dipvariation ischaracteristic of thestructure
Take Home Ideas Well logs provide key data for understanding thesubsurface Lithology, porosity and fluids are 3 importantlog families Usually you can’t measure these propertiesdirectly, so you must use proxies or indirectmeasurements Multiple logs used in combination are mostpowerful
– Sedimentary facies Well correlation Reservoir models Structural interpretation – Fault recognition Gamma Ray Response to Grain Size 48. Relating log character to sedimentary facies Building a reservoir model model 1. Define facies in core 2. Relate facies to log 3. Predict facies in wells without core, but with good logs 4. Fill the gaps between wells 28 cores 1600 wells 108 .