Transcription
CONTRIBUTING FACTORS TO FIREFIGHTERLINE-OF-DUTY DEATHIN THEUNITED STATESAuthored by,Dr. Lori Moore-Merrell, Sue McDonald, Ainong Zhou, Elise Fisher, Jonathan MooreSEPTEMBER 30, 2006Page 1
AbstractObjective: The objective of this study was to analyze retrospective data from theyears 2000-2005 (six years) to identify and quantify the major factors thatcontribute to firefighter line-of-duty death (LODD) in the United States. Theidentified contributing factors were to be examined for frequency of occurrenceand clustering with other factors.Results are to be used to develop riskmanagement programs for fire departments.Methods: A retrospective study was conducted using data compiled from sixyears of verified firefighter LODD from four reputable industry sources. Sourcesinclude the National Fire Protection Association (NFPA), the National Institutefor Occupational Safety and Health (NIOSH), the United States FireAdministration (USFA) and the International Association of Fire Fighters (IAFF).For each LODD, factors contributing to the death were recorded from federalinvestigations and eyewitness reports. The contributing factors were thenanalyzed for frequency of occurrence and clustering with other factors. Factorsmentioned in less than 5% of the LODD cases were excluded from the clusteranalysis. Factors and clusters were stratified according to department type, age offirefighter, scene type, population density of the jurisdiction (proxy fordepartment size) and census region.Results: There were 644 cases with sufficient information to be included in thestudy. Frequency analysis revealed that the dominant contributing factors toLODD are health/fitness/wellness (53.88%), personal protective equipment(19.41%) and human error (19.1%). Cluster analysis was performed revealingcontributing factors frequently occurring together.Four main clusters wereidentified with these contributing factors. Cluster 1 included incident command,training, communications, standard operating procedures, and pre-incidentplanning. Cluster 2 included vehicles, personal protective equipment, equipmentfailure, and human error. Cluster 3 included privately owned vehicles, accidental,and civilian error. Cluster 4 included company staffing, operating guidelines andPage 2
health/fitness/wellness. Cluster 4 alone (regardless of other clusters) was shownto be responsible for more than 44.72% of all firefighter on duty deaths during theyears studied. Cluster 4 in conjunction with other clusters was shown to beresponsible for an additional 16% of all firefighter line-of-duty deaths during theyears studied.Conclusions:Ninety-seven and one half percent of all firefighter LODD occurring between theyears of 2000-2005 are attributable to an identifiable cluster of contributingfactors. Approximately half of all firefighter LODD that occurred between theseyears are attributable to a cluster of three factors that are under the direct controlof the individual firefighter and chief officers. The information revealed in thisstudy imposes a considerable burden on decision makers and fire service leadersas well as firefighters themselves. It offers substantial guidance for shaping localfire department policy decisions and operational priorities.Keywords: LODD, contributing factor, risk management, firefighterYear after year, there are notable advancements in the fire service industry. Theseadvancements range from building code improvement to sprinkled buildings, from betterprotective gear to technologically advanced apparatus. Many profound advances havealso been made in both laws and programs designed to improve worker safety and healthfor all workers in the United States. For example, since the 1970s, FEMA, USFA,OSHA and NIOSH have initiated and published numerous projects to improve the abilityof employers and employees to recognize, avoid and control occupational safety andhealth hazards. Special projects and training programs were conducted for small andmedium-sized businesses, high-hazard industries, leaders of organized labor, supervisors,apprentices, and others.Generally, these improvements were made with the bestinterests of the worker in mind. However, the reduction of deaths or reduced frequencyand severity of injuries and illnesses is unevenly distributed. While some industries andparticular trades have enjoyed a reduction in injuries, diseases, and death, many otheroccupations have experienced little or no change at all. For example, the fire fightingPage 3
profession illustrates the selective impact of past safety and health initiatives. Despitethe advances made in safety and health areas, firefighters are still being killed, injuredand diseased at an alarming rate.The provision of fire suppression and emergency medical services entailssporadic high levels of physical exertion, uncontrolled environmental exposures, andpsychological stress from observing intense human suffering. Firefighters experienceinordinate numbers of line-of-duty deaths, deaths due to occupational diseases, forcedretirements, and line-of-duty injuries. Fire fighter fatalities and injuries occur at a rateone and one half times those of police officers1-2.There are approximately 296,850 career fire fighters and 800,050 volunteerfirefighters in the United States3. In spite of the improvements mentioned, scores offirefighters are injured and approximately 100 firefighters are killed in the line of dutyeach year4. One anticipated outcome of this study is to enhance risk managementcapability of local governments by enabling fire departments to recognize factors thatcontribute to firefighter line-of-duty death and take action to interrupt or otherwisecontrol these factors thereby managing the risk associated with a LODD resulting in anenhancement to firefighter safety.A similar effort currently underway is the “Near Miss Project” supported by theInternational Association of Fire Chiefs (IAFC), the Volunteer and CombinationOfficers’ Section of the IAFC and the IAFF. The intent of this project is to improvefirefighter safety through sharing lessons learned about incidents of injury producingbehavior. “Near Miss” data are being compiled for analysis to assess firefighter injuryproducing behavior in order to alter the behavior and lower the risks of an incident. Oncedata are compiled and the analysis complete, results can be used to improve command,on-scene operations, and firefighter training thus reducing injury and LODD.5 Thissystem is based on lessons learned from the aviation industry where near miss reportingsignificantly improved the safety record of the nation’s air travel. “Near Miss” reportinganticipates the same result as those discovered in the aviation industry whereas the earlierthe risk or error chain leading to a disaster is interrupted, the more likely the catastrophecan be avoided. Likewise, the intent of this study is to better identify the chain or clusterof events leading to a firefighter LODD allowing recommendations for risk managementPage 4
strategies to interrupt the chain. The results of this study will be helpful in honing andcategorizing the contributing factors used in the “Near Miss Project.”METHODSStudy DesignSubjects selected for inclusion in the study were those identified and recorded asfirefighter LODD for the years of 2000 through 2005. The data were compiled from sixyears of verified firefighter LODD from four reputable industry sources. Sources includethe National Fire Protection Association (NFPA), the National Institute for OccupationalSafety and Health (NIOSH), the United States Fire Administration (USFA) and theInternational Association of Fire Fighters (IAFF).Data compiled included cases of line-of-duty deaths as well as knowncontributing factors, date of incident, date of death, firefighter age, sex, city, state, zipcode, population density, type of department, department staffing, response time to theincident, type of occupancy, type of building, type of injury leading to death, and injuriesof firefighters related to the death. Data for each LODD and associated contributingfactors were compiled from reports profiling the incident leading to death ascommunicated by witnesses on scene and recorded by one of the four organizations listedabove. In addition to the witness accounts, NIOSH post incident investigation reportswere also used to record contributing factors to LODD for cases resulting in aninvestigation. A total of 644 cases had sufficient information available for inclusion inthe study.Data SynthesisThis study was based on data extracted from the U.S. Fire Administration (USFA)On-Duty Fatality Notices, for years 2000, 2001, 2002, 2003, 2004 and 2005 and from indepth firefighter fatality investigation reports for the same years by the National Institutefor Occupational Safety and Health (NIOSH). These data were cross-referenced withLODD recorded by both the NFPA and the IAFF. Firefighter deaths associated with thetragedy at the World Trade Center in 2001 were excluded from the study.Page 5
USFA criteria for qualifying as a line-of-duty fatality (also known as on-dutyfatality) were followed for this study. According to USFA, on-duty fatalities include anyinjury or illness sustained while on-duty that proves fatal. The term on-duty refers tobeing involved in operations at the scene of an emergency, whether it is a fire or non-fireincident, responding to or returning from an incident, performing other officiallyassigned duties such as training, maintenance, public education, inspection,investigations, court testimony, and fundraising, and being on-call, under orders, or onstandby duty, except at the individual’s home or place of business.A fatality may be caused directly by an accidental or intentional injury in eitheremergency or non-emergency circumstances, or it may be attributed to an occupationallyrelated fatal illness. A common example of a fatal illness incurred on-duty is a heartattack. Fatalities attributed to occupational illnesses also would include a communicabledisease contracted while on-duty that proved fatal, when the disease could be attributedto a documented occupational exposure.Injuries and illnesses are included when the death is considerably delayed afterthe original incident. When the incident and the death occur in different years, theanalysis counts the fatality as having occurred in the year in which the incident tookplace.An individual who experiences a heart attack or other fatal injury at home as he orshe prepares to respond to an emergency is considered on-duty. A firefighter whobecomes ill while performing fire department duties and suffers a heart attack shortlyafter arriving home or at another location may be considered on-duty since the inceptionof the heart attack occurred while the firefighter was on-duty. Prior to December 15,2003, a firefighter who became ill as the result of a heart attack or stroke after going offduty needed to register some complaint of not feeling well while still on-duty in order tobe included in the USFA study. On December 15, 2003, the President of the UnitedStates signed into law the Hometown Heroes Survivors Benefit Act of 2003. The lawpresumes that a heart attack or a stroke is in the line of duty if the firefighter was engagedin non-routine stressful or strenuous physical activity while on-duty or within 24 hoursafter engaging in such activity. 6It is the position of the USFA that there is no established mechanism foridentifying fatalities resulting from illnesses, such as cancer that develop over longPage 6
periods of time, which may be related to occupational exposure to hazardous materials orproducts of combustion.Though the IAFF tracks and strenuously supports thatfirefighter deaths due to cancer or other diseases resulting from long-term or otherwisefatal on-the-job exposures are LODD, these were excluded from this study.Thisexclusion is based on the delayed long-term effects of such toxic hazard exposures.Study ProtocolData were compiled from eyewitness reports and post incident investigationreports from four nationally recognized sources for firefighter LODD information.Identified cases of LODD were evaluated for sufficient information for inclusion in thestudy. Next, each case was individually cross-referenced with all data sources to assureall available information was collected on each case and to assure no cases were countedtwice. Data tables were prepared with all study relevant information.Data were then analyzed to identify and define contributing factors of firefighterLODD.As contributing factors were identified, a variable key was constructedcontaining each variable name and the definition as referenced in data source reports.Frequency analysis as well as cluster analysis was performed on all cases.Data AnalysisInitial analysis identified the overall dominant contributing factors as well as thedominant factors in each of five strata. Strata included firefighter age, department type,scene type, population density, and census region.Next, data were analyzed forclustering between contributing factors and the frequency of that cluster. Four obliqueclusters of the contributing factors were identified using the VARCLUS Procedure usingthe SAS software (Version 9.1, SAS Institute). Those contributing factors with no morethan 5% mentioned were excluded from the cluster analysis.A binary score wascalculated for each cluster based on presence/absence of any of its constituentcontributing factors. Finally, these contributing factor clusters were evaluated for thesignificance of their contribution to firefighter LODD in the six years studied. Therelative contribution of these clusters was also evaluated within each stratum identifiedpreviously. All data analyses were conducted using the SAS software.Page 7
RESULTSThere were 644 cases identified with sufficient information for inclusion in thestudy. Firefighter LODD characteristics are shown in Table 1. Age information was notavailable for four of the cases and department type was not identified in one case.Additionally, the state of occurrence was not identified in three cases. Stratified analyseswere limited to cases with sufficient strata specific data.As is expected, based on the make-up of the fire service, the majority of LODDcases are male (96%).For the years and cases included in the study, more firefighterLODD occur in volunteer departments (52%)as compared to career (39%) orcombination (9%) and the majority of firefighters dying are over the age of 45 (52%).Regionally, more firefighter LODD occurs in the south (34%) than in any other censusregion.Page 8
Table 1Characteristics of firefighter LODD cases included in the study (N 644)AgeLess than 2525-3536-4546-55Greater than 55UnidentifiedGenderMaleFemaleDepartment TypeCareerVolunteerCombinationOtherCensus 620 (96%)24 (4%)2523335811691272181273Contributing Factors were identified. Each factor was identified from case studiesor eyewitness reports, defined from literature or descriptions contained in LODD reportsand assigned a variable name for the study. The contributing factor, definition andvariable name are listed below.¾ Incident Commander (IC) – Individual responsible for the combination offacilities, equipment, personnel, procedures, and communications operatingwithin a common organizational structure with responsibility for the managementof assigned resources to effectively accomplish stated objectives pertaining to anincident or training exercise.7¾ Incident Safety Officer (ISO) – An individual appointed to respond to orassigned at an incident scene by the incident commander to perform the dutiesPage 9
and responsibilities specified in NFPA standard 1521 and 1584. This individualcan be the health and safety officer or it can be a separate function.8¾ Personal Alert Safety System (PASS) – Device certified as compliant withNFPA standard 1982, that senses movement and/or lack of movement andautomatically activates an audible alarm signal (which can also be manuallyactivated) to alert and assist others in locating a firefighter or emergency providerin danger.9¾ Staffing/Crew Size (STAFF) – (Fire Crew or Company) A group of members:(1) Under the direct supervision of an officer; (2) Trained and equipped toperform assigned tasks; (3) Usually organized and identified as engine companies,ladder companies, rescue companies, squad companies, or multi-functionalcompanies; (4) Operating with one piece of fire apparatus (engine, ladder truck,elevating platform, quint, rescue, squad, ambulance) except where multipleapparatus are assigned that are dispatched and arrive together, continuouslyoperate together, and are managed by a single company officer; (5) Arriving atthe incident scene on fire apparatus.10 An organized group of firefighters underthe leadership of a crew leader or other designated official.11¾ Rapid Intervention Team (RIT) – Two or more firefighters assigned outside thehazard area to assist or rescue at an emergency operation as required by 6-4.4 ofNFPA 1500, Standard on Fire Department Occupational Safety and HealthProgram.12¾ Training (TRAIN) – The process of achieving proficiency through instructionand hands-on practice in the operation of equipment and systems that areexpected to be used in the performance of assigned duties.13¾ Communications (COMM) – Radio, telephone and messenger service networksthroughout the emergency response system necessary to facilitate directPage 10
communication from the incident commander to officers, firefighters andemergency providers in tactical operations.14¾ Standard Operating Guidelines (SOG) – An organizational directive thatestablishes a common practice or course of action during tactical ommanderandfirefighters/emergency responders to adapt to variations in incident types withinthe same category (e.g. single family residential structure fire vs. high risestructure fire) while providing overall consistency in tasks to be conducted onevery incident.¾ Standard Operating Procedures (SOP) – A written organizational directive thatestablishes or prescribes specific operational or administrative methods to befollowed routinely for the performance of designated operations, actions oradministrative functions.15¾ Privately Owned Vehicle (POV) – A motor vehicle owned and operated by anindividual firefighter, used in the response to a call for service.¾ Pre-Incident Plan (PIP) – A document developed by gathering general anddetailed data at a specific facility to be used by responding personnel to determinethe resources and actions necessary to mitigate anticipated emergencies.16¾ Emergency Vehicle (VEH) – Any vehicle operated by a fire department memberincluding those used for rescue, fire suppression, emergency medical services,hazardous materials operations, wildland, or other functions.17¾ Personal Protective Equipment (PPE) – The equipment provided to shield orisolate personnel from infectious, chemical, physical, and thermal hazards.18¾ Health/Fitness/Wellness/Medical (HFWM) – The state of uniform personnelsignifying a deficiency or absence of physical, mental, or emotional capability toPage 11
withstand the stresses or strains of living and functioning in the workplace. Thisadverse state results from cumulative factors including job exposures, stress andpersonal behavior including poor diet and general lack of exercise.¾ Structural Failure (SF) – Structural collapse brought on by fire that precludesbuildings or structural components from functioning as designed.¾ Emergency Equipment Failure (EEFAIL) – The unacceptable differencebetween expected and observed performance of emergency equipment.¾ Act of Violence (VIOL) – Exertion of physical force to injure, abuse or causedeath.¾ Act of Nature (NAT) – An extraordinary and unexpected natural event, such as ahurricane, tornado, earthquake or even the sudden death of a person.¾ Accidental (ACC) – Arising from extrinsic causes occurring unexpectedly or bychance happening without intent or through carelessness and often withunfortunate results.¾ Human Error (HE) – A mistake made by a person rather than caused by apoorly designed process or the malfunctioning of equipment.¾ Dangerous Substance (DS) – Synonymous with the term hazardous materialsdefined as a combustible liquid, corrosive material, infectious substances,flammable compressed gases, oxidizing materials, poisonous articles, radioactivematerials, and other restrictive articles.19 Also includes articles or substancescapable of posing a significant risk to health, safety, or property when transportedby land, air, rail or sea.20Page 12
¾ Civilian Error (CE) – Persons who are members of the general public and whoare not fire service or other emergency services personnel21 who in an act orcondition of ignorant or imprudent behavior unintentional cause an adverse event.Following contributing factor identification and definition, raw frequency scoresand percent mentioned were determined for each factor. Dominant contributing factorswere identified by percentage for the overall dataset and in various categories asdescribed in Table 2 below.Page 13
Table 2.Dominant Contributing Factors by Strata (Top 3 Percentages shown)StrataContributing Factor (% LODD)OverallHWFM (53.8) PPE (19.4) HE (19.1)AgeLess than 25HE (60.87) VEH (40.6) PPE (34.8)25-35SOP (33.7) VEH (31.5) PPE (30.3)36-45HWFM (51) SOP (21.1) IC (18.4) PPE (18.4)46-55HWFM (66.6) SOG (20.7) PPE (16.1)Greater than 55HWFM (75.8) SOG (11.1) PPE (11.1)Department TypeCareerHWFM (42.8) EEFAIL (26.2) PPE (21.1)VolunteerHWFM (61.4) HE (20.1) VEH (15.9) PPE (15.9)CombinationSOG (62.1) HWFM (58.6) PPE (32.8)Census RegionNortheastHWFM (66.3) SOG (15.4) HE (13.6)MidwestHWFM (55.1) PPE (28.4) SOP (23.6)SouthHWFM (54.1) PPE (21.1) HE (20.1)WestHWFM (35.4) EEFAIL (31.5) HE (26.7)Population DensityLess than 500/sq mileHWFM (47.6) PPE (32.4) SOG (30.3)501 – 1500/sq mileHWFM(56.5) SOG(17.0) EEFAIL(15.6)VEH(15.6)1501 – 3000/sq mileHWFM (54.8) PPE (23.1) HE (20.2)Greater than 3000/sq mileHWFM (57.7) SOP (23.1) PPE (21.5)Scene TypeStructure FireHWFW (48.7) IC (43.9) SOP (38.6)Responding/ReturningHE (53.5) VEH (47.2) CE (43. 3)Station/HomeHWFM (89.6) SOG (28.8) PPE (11.2)TrainingHWFM (63.2) EEFAIL (23.5) SOG (23.5)WildlandEEFAIL (44.4) HFWM (35.2) IC (14.8) SOP (14.8)Page 14
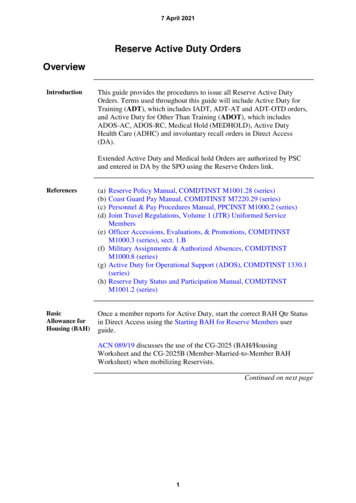
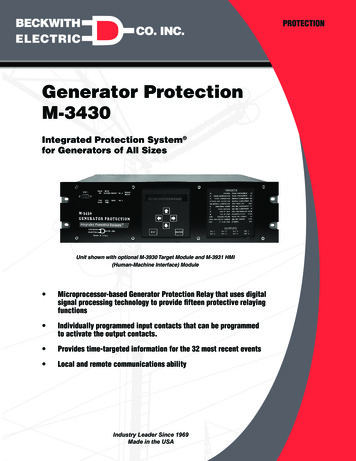
According to cluster analysis, four clusters of contributing factors were identified.Those contributing factors with no more than 5% mentioned were excluded from thecluster analysis. Composite cluster variables are listed in Table 3 below.Table 3 Composite Cluster VariablesContributing Factor ClustersCluster 1: Incident Command, Training, Communications, SOP, Preincident PlanningCluster 2: Emergency Vehicle, Personal Protective Equipment,Emergency Equipment Failure, Human ErrorCluster 3: Privately Owned Vehicle, Accidental, Civilian ErrorCluster 4: Staffing/Crew Size, Standard Operating Guidelines,Health/Wellness/Fitness/MedicalThe four clusters identified by the analysis are responsible for 97.52% of allLODD in the years studied. The remaining LODD (2.48%) were not explained by anycontributing factor cluster. Among the composite clusters, Cluster 4 alone, excluding itsinteraction with any other contributing factors, is responsible for 44.72% of LODD.Cluster 2 alone is responsible for another 14.13%. A combination of Cluster 2 andCluster 3 are responsible for an additional 8.70% of LODD. The remaining 32.45% ofLODD are explained by another cluster alone or in combination as described in Figure 1below.Page 15
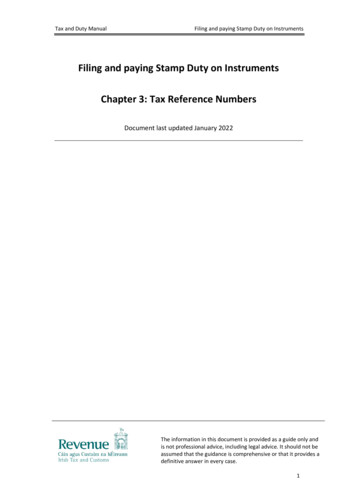
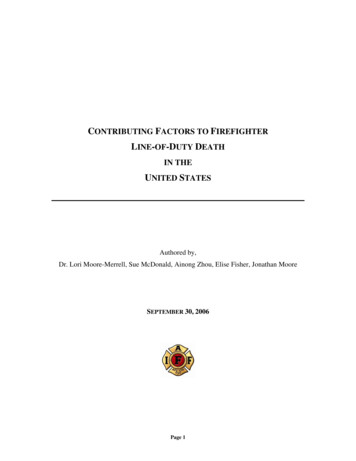
Figure 1. Overall Model of Composite Clusters for LODD 2000-2005Overall ModelOther19.4%BCFS Cluster 444.7%BCFS Clusters 2 & 46.1%BCFS Clusters 1 & 27.0%BCFS Clusters 2 & 38.7%BCFS Cluster 1:BCFS Cluster 2:BCFS Cluster 3:BCFS Cluster 4:BCFS Cluster 214.1%Incident Command / Training / Communication / Standard Operating Procedure / Preincident CommandEmergency Vehicle / Personal Protective Equipment / Emergency Equipment Failure / Human ErrorPrivately Owned Vehicle / Accidental / Civilian ErrorStaffing / Crew Size / Standard Operating Guidelines / Health-Wellness-Fitness-MedicalThe relative contribution of these clusters within each stratum was evaluated as anattempt to hone contributing factor clusters to specific environments making riskmanagement efforts more direct and efficient. Strata evaluated included firefighter age,type of department, census region, population density and scene type.Firefighter age strata were defined as 25 and Under, 26-35, 36-45, 46-55, andOver 55. Cluster 2, comprised of emergency vehicle, personal protective equipment,emergency equipment failure, and human error, was responsible for more than 26% ofLODD in firefighters 25 and under while a combination of Clusters 2 and 3 wasresponsible for an additional 22%. Cluster 4 was responsible for the majority of deaths inall other age groups with the percentage of attributable deaths increasing with age. Forfirefighters over 55, Cluster 4 was responsible for nearly 70% of LODD. Figures 2 – 6show contributing factor clusters by firefighter age group.Page 16
Figure 2. Age Group 25 and UnderAge Group -- 25 and UnderOther17.4%BCFS Cluster26.1%BCFS Cluster5.8%BCFS Clusters 1 &11.6%BCFS Clusters 2 &21.7%BCFS Clusters 1 &17.4%BCFS Cluster 1:BCFS Cluster 2:BCFS Cluster 3:BCFS Cluster 4:Incident Command / Training / Communication / Standard Operating Procedure / Preincident CommandEmergency Vehicle / Personal Protective Equipment / Emergency Equipment Failure / Human ErrorPrivately Owned Vehicle / Accidental / Civilian ErrorStaffing / Crew Size / Standard Operating Guidelines / Health-Wellness-Fitness-MedicalFigure 3. Age Group 26-35Age Group -- 26-35BCFS Clusters 1, 2 & 35.6%BCFS Cluster 35.6%BCFS Cluster 15.6%Other9.0%BCFS Cluster 214.6%BCFS Clusters 2 & 46.7%BCFS Clusters 1 & 210.1%BCFS Clusters 1, 2 & 411.2%BCFS Cluster 1:CommandBCFS Cluster 2:BCFS Cluster 3:BCFS Cluster 4:BCFS Cluster 420.2%BCFS Clusters 2 & 311.2%Incident Command / Training / Communication / Standard Operating Procedure / PreincidentEmergency Vehicle / Personal Protective Equipment / Emergency Equipment Failure / Human ErrorPrivately Owned Vehicle / Accidental / Civilian ErrorStaffing / Crew Size / Standard Operating Guidelines / Health-Wellness-Fitness-MedicalPage 17
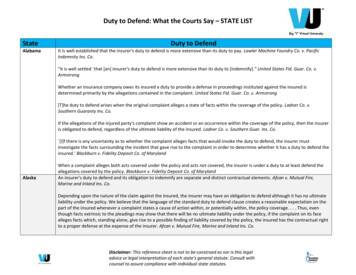
Figure 4. Age Group 36-45Age Group -- 36-45Other15.0%BCFS Clusters 2, 3 & 44.8%BCFS Clusters 1, 2 & 44.8%BCFS Cluster 439.5%BCFS Clusters 2 & 34.8%BCFS Clusters 2 & 46.8%BCFS Clusters 1 & 29.5%BCFS Cluster 1:BCFS Cluster 2:BCFS Cluster 3:BCFS Cluster 4:BCFS Cluster 215.0%Incident Command / Training / Communication / Standard Operating Procedure / Preincident CommandEmergency Vehicle / Personal Protective Equipment / Emergency Equipment Failure / Human ErrorPrivately Owned Vehicle / Accidental / Civilian ErrorStaffing / Crew Size / Standard Operating Guidelines / Health-Wellness-Fitness-MedicalFigure 5. Age Group 46-55Age Group -- 46-55Other16.1%BCFS Clusters 2 & 35.7%BCFS Clusters 2 & 47.8%BCFS Cluster 456.5%BCFS Cluster 214.0%BCFS Cluster 1:BCFS Cluster 2:BCFS Cluster 3:BCFS Cluster 4:Incident Command / Training / Communication / Standard Operating Procedure / Preincident CommandEmergency Vehicle / Personal Protective Equipment / Emergency Equipment Failure / Human ErrorPrivately Owned Vehicle / Accidental / Civilian ErrorStaffing / Crew Size / Standard Operating Guidelines / Health-Wellness-Fitness-MedicalPage 18
Figure 6. Age Group Over 55Age Group -- Over 55BCFS Clusters 2 & 45.5%Other9.0%BCFS Cluster 27.6%BCFS Clusters 2 & 38.3%BCFS Cluster 469.7%BCFS Cluster 1:BCFS Cluster 2:BCFS Cluster 3:BCFS Cluster 4:Incident Command / Training / Communication / Standard Operating Procedure / Preincident CommandEmergency Vehicle / Personal Protective Equipment / Emergency Equipment Failure / Human ErrorPrivately Owned Vehicle / Accidental / Civilian ErrorStaffing / Crew Size / Standard Operating Guidelines / Health-Wellness-Fitness-MedicalThe next strata evaluated were department type. These strata were defined ascareer, volunteer and combination. Figures 7-9 show the contributing factor clustersmost responsible for LODD in these strata. While Clusters 4 and 2 were responsible forhalf of LODD in Career Departments, Cluster 4 alone was responsible for more than 56%of LODD in Volunteer Departments. Cluster 4 alone was responsible for nearly 40% ofLODD in Combination Departments while Cluster 4 in combination with Cluster 2 wasresponsible for an additional 15.5%.Page 19
Figure 7. Career DepartmentsDepartment Type -- Career OnlyBCFS Clusters 1, 2 & 44.8%BCFS Clusters 1 & 45.2%BCFS Clusters 2 & 46.8%Other11.1%BCFS Cluster 430.6%BCFS Clusters 2 & 37.9%BCFS Clusters 1 & 29.1%BCFS Cluster 1:BCFS Cluster 2:BCFS Cluster 3:BCFS Cluster 4:BCFS Cluster 224.6%Incident Command / Training / Communication / Standard Operating Procedure / Preincident CommandEmergency Vehicle / Personal Protective Equipment / Emergency Equipment Failure / Human ErrorPrivately Owned Vehicle / Accidental / Civilian ErrorStaffing / Crew Size / Standard Operating Guidelines / Health-Wellness-Fitness-MedicalFigure 8. Volunteer DepartmentsDepartment Type -- Volunteer OnlyOther19.2%BCFS Clusters 1 & 25.1%BCFS Cluster 456.3%BCFS Cluster 28.7%BCFS Clusters 2 & 310.8%BCFS Cluster 1:BCFS Cluster 2:BCFS Cluster 3:BCFS Cluster 4:Incident Command / Training / Communication / Standard Operating Procedure / Preincident CommandEmergency Vehicle / Personal Protective Equipment / Emergency Equipment Failure / Human ErrorPrivately Owned Vehicle / Accidental / Civilian ErrorStaffing / Crew Size / Standard Operating Guidelines / Health-Wellness-Fitness-MedicalPage 20
Figure 9. Combination DepartmentsDepartment Type -- Career & Volunteer CombinationBCFS Cluster 1BCFS Clusters 1, 2 & 3 5.2%6.9%Other3.4%BCFS Clust
Cluster analysis was performed revealing contributing factors frequently occurring together. Four main clusters were identified with these contributing factors. Cluster 1 included incident command, training, communications, standard operating procedures, and pre-incident planning. Cluster 2 included vehicles, personal protective equipment .