Transcription
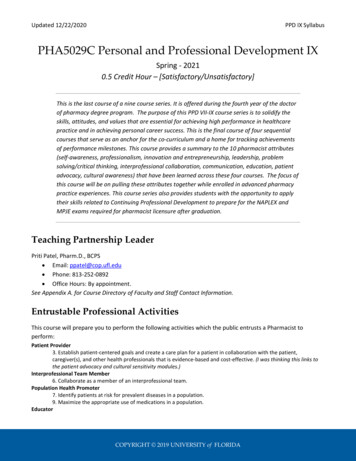
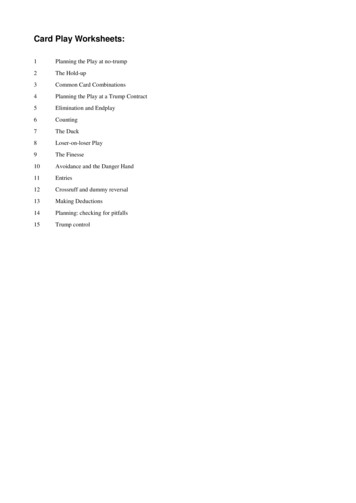
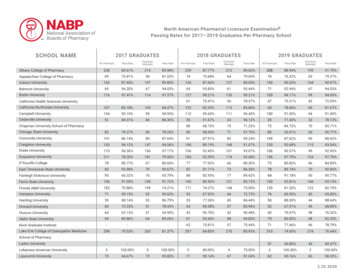
North American Pharmacist Licensure ExaminationPassing Rates for 2017—2019 Graduates Per Pharmacy SchoolSCHOOL NAME2017 GRADUATES2018 GRADUATES2019 GRADUATESAll AttemptsPass n College of 79.37%Auburn 0.20%14490.97%Belmont 6794.03%Butler alifornia Northstate .46%6081.67%Campbell .00%9491.49%Cedarville o State 6550.77%Concordia 2%9588.42%Creighton 2.68%11593.04%Drake 0.57%9992.93%Duquesne 7.79%13497.76%D’Youville 4.85%East Tennessee State 7090.00%Fairleigh Dickinson 6590.77%Ferris State 2.81%14693.15%Florida A&M 1.20%12282.79%Hampton 6065.00%Harding 4488.64%Howard 4568.89%Husson 3876.32%Idaho State bany College of PharmacyCalifornia Health Sciences UniversityChapman University School of PharmacyKeck Graduate InstituteLake Erie College of Osteopathic MedicinePass RateFirst-timeAttemptsPass RateAll AttemptsPass RateFirst-timeAttemptsPass Rate22987.77%21289.62%20888.94%19591.79%Pass RateAll AttemptsSchool of PharmacyLarkin University--------5156.86%4360.47%Lebanese American 00.00%Lipscomb 6098.33%2.25.2020
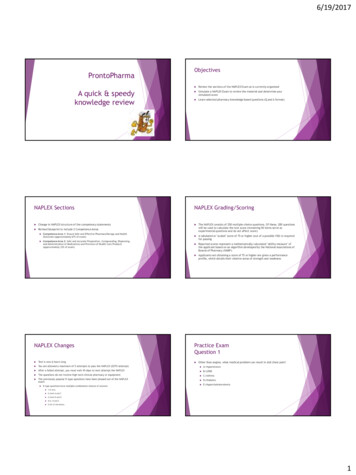
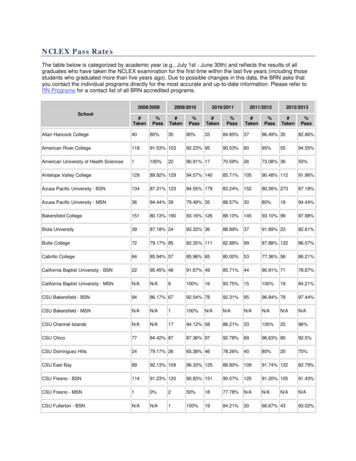
North American Pharmacist Licensure ExaminationPassing Rates for 2017—2019 Graduates Per Pharmacy SchoolSCHOOL NAME2017 GRADUATES2018 GRADUATES2019 GRADUATESAll AttemptsPass RateFirst-timeAttemptsLoma Linda 6492.19%Long Island 2.73%16876.79%Manchester 6091.67%Marshall 7082.86%Massachusetts College of Pharmacy, %25784.05%Massachusetts College of .94%23874.79%Mercer 0.44%12893.75%Midwestern University, 9%20077.50%Midwestern University, 42%13686.76%North Dakota State 6992.75%Northeast Ohio Medical 6493.75%Northeastern 09%10491.35%Notre Dame of Maryland 4372.09%Nova Southeastern 5.25%22985.59%Ohio Northern 0.65%12992.25%Ohio State 1.30%12892.97%Oregon State %9279.35%Pacific University, 684.38%Palm Beach Atlantic 6272.58%Philadelphia College of Osteopathic 8176.54%Philadelphia College of 72%13992.09%Presbyterian 4.44%Purdue 5.74%13596.30%Regis 6791.04%Roosevelt 5687.50%Rosalind Franklin 6287.10%Roseman University of Health 41%21482.71%Rutgers 0.76%17590.86%Samford 5.82%12087.50%Pass RateAll AttemptsPass RateFirst-timeAttemptsPass RateAll AttemptsPass RateFirst-timeAttemptsPass RateWorcesterGeorgia2.25.2020
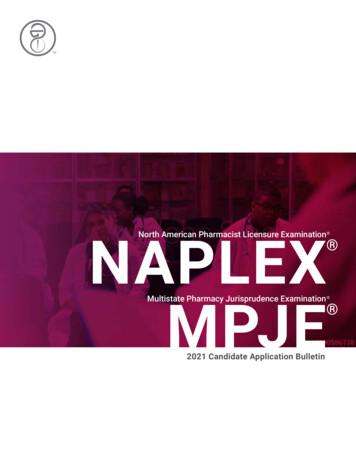
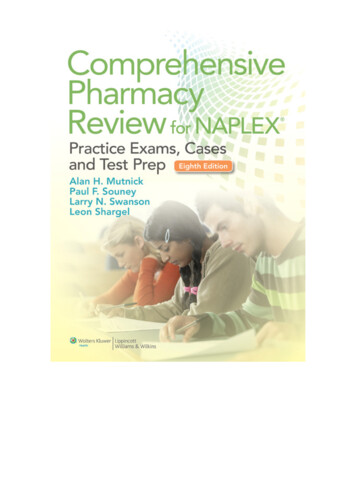
North American Pharmacist Licensure ExaminationPassing Rates for 2017—2019 Graduates Per Pharmacy SchoolSCHOOL NAME2017 GRADUATES2018 GRADUATES2019 GRADUATESAll AttemptsPass RateFirst-timeAttemptsShenandoah %6485.94%South Carolina 8%17297.09%South 87.84%South Dakota State 4%7697.37%South University School of 97%11379.65%Southern Illinois 7295.83%Southwestern Oklahoma State 4192.68%St John Fisher 7.37%St Johns 6.53%22687.61%St Louis College of 08%22482.14%Sullivan 7483.78%Temple 9.43%11892.37%Texas A&M 64%10494.23%Texas Southern 0.00%9981.82%Texas Tech University Health Sciences %13889.86%Thomas Jefferson 2%8293.90%Touro University, 8295.12%Touro University, New 12%Union %37100.00%University at 6%12091.67%University of 11586.09%University of 04%10894.44%University of California, San 100.00%University of California, San .23%10496.15%University of 5377.36%University of 0%9592.63%University of 08%12392.68%University of %8589.41%University of 9.66%University of 0%21988.13%University of 6%13492.54%Pass RateAll AttemptsPass RateFirst-timeAttemptsPass RateAll AttemptsPass RateFirst-timeAttemptsPass Rate2.25.2020
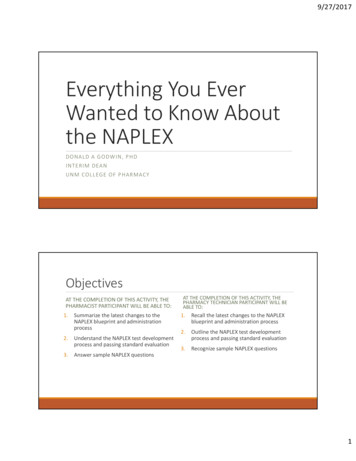
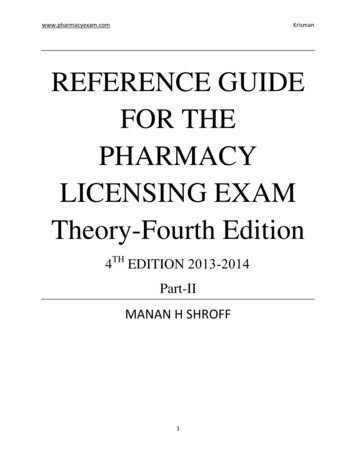
North American Pharmacist Licensure ExaminationPassing Rates for 2017—2019 Graduates Per Pharmacy SchoolSCHOOL NAME2017 GRADUATES2018 GRADUATES2019 GRADUATESAll AttemptsPass RateFirst-timeAttemptsUniversity of .00%University of 5%12497.58%University of Illinois, 6%16387.73%University of 592.63%University of %13092.31%University of 18%13897.10%University of Louisiana at 91.40%University of 62%14287.32%University of Maryland Eastern 23%University of 96.20%University of .94%16093.75%University of 86.07%10988.07%University of Missouri, Kansas 4885.14%University of 3.10%University of 8100.00%University of New 368.67%University of New .14%University of North 70%12294.26%University of North Texas System College 0%University of 291.46%University of 1.45%10990.83%University of Puerto 4%University of Rhode %10493.27%University of Saint .67%University of South 991.01%University of Southern 5.93%16996.45%University of .16%18193.92%University of Texas at 8895.45%8596.47%9290.22%8793.10%Pass RateAll AttemptsPass RateFirst-timeAttemptsPass RateAll AttemptsPass RateFirst-timeAttemptsPass RatePharmacyUniversity of Texas at TylerUniversity of the Incarnate Word2.25.2020
North American Pharmacist Licensure ExaminationPassing Rates for 2017—2019 Graduates Per Pharmacy SchoolSCHOOL NAME2017 GRADUATES2018 GRADUATES2019 GRADUATESAll AttemptsPass RateFirst-timeAttemptsUniversity of the Pacific, 6.89%19196.86%University of .65%University of 6%University of 7898.72%University of Wisconsin, 7%14797.28%University of 3.33%Virginia Commonwealth 6.83%12397.56%Washington State .82%14190.07%Wayne State %9695.83%West Coast University----3568.57%2965.52%5565.45%4566.67%West Virginia 6991.30%Western New England 5891.38%Western University of Health 42%12895.31%Wilkes 6991.30%Wingate University School of 10179.21%Xavier University of 686.74%1386988.34%1801283.09%1797081.91%All Graduates from ACPE Accredited Programs1537986.28%All NAPLEX Administrations1818981.96%Pass RateAll AttemptsPass RateFirst-timeAttemptsPass RateAll AttemptsPass RateFirst-timeAttemptsPass Rate2.25.2020
Auburn University Belmont University Butler University California Health Sciences University California Northstate University Campbell University . South University School of Pharmacy Southern Illinois University Southwestern Oklahoma State University St John Fisher College St Johns University . 222020