Transcription
The AAPS Journal, Vol. 17, No. 4, July 2015 ( # 2015)DOI: 10.1208/s12248-015-9756-2Research ArticleCalculations for Adjusting Endogenous Biomarker Levels During AnalyticalRecovery Assessments for Ligand-Binding Assay Bioanalytical MethodValidationJohn F. Marcelletti,1,3 Cindy L. Evans,1 Manju Saxena,2 and Adriana E. Lopez1Received 16 December 2014; accepted 19 March 2015; published online 23 April 2015Abstract. It is often necessary to adjust for detectable endogenous biomarker levels in spiked validationsamples (VS) and in selectivity determinations during bioanalytical method validation for ligand-bindingassays (LBA) with a matrix like normal human serum (NHS). Described herein are case studies ofbiomarker analyses using multiplex LBA which highlight the challenges associated with such adjustmentswhen calculating percent analytical recovery (%AR). The LBA test methods were the Meso ScaleDiscovery V-PLEX proinflammatory and cytokine panels with NHS as test matrix. The NHS matrixblank exhibited varied endogenous content of the 20 individual cytokines before spiking, ranging fromundetectable to readily quantifiable. Addition and subtraction methods for adjusting endogenouscytokine levels in %AR calculations are both used in the bioanalytical field. The two methods werecompared in %AR calculations following spiking and analysis of VS for cytokines having detectableendogenous levels in NHS. Calculations for %AR obtained by subtracting quantifiable endogenousbiomarker concentrations from the respective total analytical VS values yielded reproducible andcredible conclusions. The addition method, in contrast, yielded %AR conclusions that were frequentlyunreliable and discordant with values obtained with the subtraction adjustment method. It is shown thatsubtraction of assay signal attributable to matrix is a feasible alternative when endogenous biomarkerslevels are below the limit of quantitation, but above the limit of detection. These analyses confirm thatthe subtraction method is preferable over that using addition to adjust for detectable endogenousbiomarker levels when calculating %AR for biomarker LBA.KEY WORDS: analytical recovery; biomarkers; ligand-binding assay; matrix effects.INTRODUCTIONBioanalytical method validation (BMV) of ligandbinding assays (LBA) involving biomarkers endogenouslypresent in substantial quantities in matrix (e.g., serum,plasma, etc.) can create challenges to accurate quantitationof that analyte as a spiked entity in the sample (1–3). This isbecause the assay frequently cannot distinguish betweenadded analyte and the endogenous component. The challengeof adjusting for endogenous analyte content in matrixbecomes apparent when assaying validation samples (VS)and attempting to accurately quantitate the spiked component. This same challenge presents itself during selectivitydeterminations when multiple individual matrix samples aretested for matrix effects by addition and quantitation ofspiked analytes.1Immunoanalytical Operations, Tandem Labs, Laboratory Corporation of America Holdings, 13112 Evening Creek Drive South, SanDiego, California 92128, USA.2Immunochemistry Services, Intertek Pharmaceutical Services, SanDiego, California, USA.3To whom correspondence should be addressed. (e-mail:jfmphd@yahoo.com)Two basic methods have been described to adjust forendogenous biomarker levels in percent analytical recovery(%AR) calculations involving analyses of such VS or selectivitysamples. One method (termed addition method herein) uses acomparison of the observed VS results vs. the expected totalconcentration, the latter of which being derived by addition of thenominal value of the spike plus the observed experimental valuefrom the unspiked matrix control. The other adjustmentcalculation is termed the subtraction method. Thus, the concentration of the tested biomarker observed in the matrix blank issubtracted from the amount observed in the spiked VS, and thenet difference vs. nominal spiked value is used to calculate %AR.Both addition (e.g., 4–8) and subtraction (e.g., 9–13)methods are used for endogenous analyte adjustment,although the latter is the predominant calculation in theimmunoanalytical field. Frequently, it is stated that theendogenous analyte concentration had been taken intoaccount for %AR calculations, but the exact method was illdefined (e.g., 14–16). As will be described in BResults, thechoice of calculation method can be a critical factor regardingconclusions on the reliability of the assay and resulting data.Considering that both addition and subtraction methods are9391550-7416/15/0400-0939/0 # 2015 American Association of Pharmaceutical Scientists
Marcelletti et al.940currently being used, it is essential to describe in full thecalculation employed for %AR determinations.Opinions have been put forth of late supporting thesubtraction method, although arguments for or against theaddition method have not been widely published. Theseminal article by the AAPS Ligand-Binding AssayBioanalytical Focus Group described both addition andsubtraction for calculating %AR when endogenous signal ispresent within the range of a LBA (17). However, the relativemerits of subtraction vs. addition methods were not addressedin that 2003 publication. Specifics about %AR calculationswere not substantially discussed in the recently released 2013FDA BMV draft guidance, nor in the Crystal City Vworkshop report (18). Nevertheless, influential publicationssupport use of the subtraction method (e.g., 19–21).Moreover, recent white papers on biomarker BMV by theGlobal CRO Council and by the Global BioanalysisConsortium Harmonization Team state that the subtractionmethod should be used for adjusting endogenous biomarkercontent in selectivity determinations (22,23).Crucial to this discussion and to the generalized appreciation for the importance of calculation method are published results showing direct comparisons of the two methodsusing experimental data. Such analyses have not been widelypublished. Therefore, we undertook just such a comparisonusing examples from our ongoing BMV studies in normalhuman serum (NHS) with two Meso Scale Discovery(MSD ) multiplex cytokine assays, the ProinflammatoryPanel 1 and Cytokine Panel 1 systems. Endogenous levels ofthe 20 cytokines were observed in NHS to varied degrees andhad to be accounted for during BMV.Case studies were selected based on the presence ofdetectable endogenous analytes and used to directly compare%AR results with subtraction and addition calculationmethods. As shown in BResults, it was observed thatsubtraction consistently yielded more convincing %ARvalues under conditions where addition gave unreliableconclusions. Another issue along these lines relates toendogenous analytes that are above the limit of detection(LOD), but below the limit of quantitation (BLOQ). Weobserved herein that subtraction of assay signal attributableto the matrix is a feasible approach to account for detectableendogenous analyte levels in %AR calculations.MATERIALS AND METHODSPreparation of Calibration Standard and Validation SamplesThe MSD V-PLEX Proinflammatory Panel 1 andCytokine Panel 1 kits for human samples were purchasedfor these studies (Meso Scale Discovery, Rockville, MD,catalog numbers K15049G and K15050G, respectively). Thekits were supplied with lyophilized calibration standard (CS)blends, a mixture of the 10 cytokines to be measured by eachrespective multiplex panel. The CS blend was reconstitutedwith MSD assay buffer for use in standard curves and forspiking NHS as described below.Twenty NHS samples were purchased from Bioreclamation(Hicksville, NY) and screened for suitability for use in a NHSmatrix pool by running in the assays with and without spiked CSblend to monitor %AR of the individual cytokines. Sera for theNHS pool were selected based on the lack of appreciablepositive or negative matrix effects on analyses of the spikecytokines, meeting acceptance of 80–120% AR using thesubtraction calculation. The NHS pool consisted of eightindividuals selected from the initial lot of 20 NHS purchased.Seven levels of VS were prepared by spiking this pool of NHSwith the reconstituted CS blend at escalating concentrations. AllVS contained at least 95% NHS. VS and any reconstituted CSpreparations were stored at 70 C. All kit components had anexpiration of 3 years from the date of manufacturer, whilereconstituted preparations were given a 30-day expiration.Multiplex Assay SystemThe assay methods followed closely to those of theproduct insert, except as required to incorporate NHS matrix.Briefly, reconstituted CS blend was serially diluted in assaybuffer to obtain the desired concentrations for the standardcurves. Diluted calibrators were added 50 μL/well directly tothe plate without further dilution. VS and NHS samples werediluted in assay buffer for a final minimum required dilution(MRD) of 1:2 (50%; Proinflammatory Panel) and 1:4 (25%;Cytokine Panel) when added 50 μL/well. All determinationswere assayed in duplicate (two wells). The plate wasincubated 2 h at room temperature with orbital shaking.The wells were washed with buffer (PBS with 2% Tween-20)before the addition of 25 μL/well assay diluent containing amixture of 10 SULFO-TAG -labeled, cytokine-specific detection antibodies. The plates were incubated again at roomtemperature for 2 h with orbital shaking. The wells werewashed with PBS-Tween. MSD read buffer was added to thewells, and the plate loaded into a MSD SECTOR Imager2400 instrument where a voltage was applied to the plateelectrodes, causing the capture labels to emit light aselectrochemiluminescence units (ECLU). A regression ofthe ECLU by the standard curve samples vs. concentrationswas performed with a 5-parameter logistic model (5-PL) usingWatson LIMS software (Version 7.3.0.01, Thermo FisherScientific, Inc., Waltham, MA) and the concentrations ofanalytes in the samples determined following adjustment fordilution.Relevant BMV DetailsThe BMV data presented herein were derived in amanner consistent with the principles of GLP referred tohereafter as regulated BMV. Lower limit of quantitation(LLOQ) is defined by the VS with the lowest passingconcentration of analyte in regulated BMV (18,24,25). Lessformal assay characterization protocols (variously termedexploratory, nonregulated, and method qualification) canuse other means to define LLOQ as described in theBDiscussion (25–27).Standard regulated BMV parameters were assessed withthese two biomarker panels, including accuracy and precision(A&P), selectivity, stability, etc. Only the A&P runs will bediscussed for this study. A total of six A&P runs wereconducted for each multiplex panel over multiple days by twoanalysts. Each run consisted of a 12-point CS blend curve, 3buffer blanks, and 3 replicate determinations of the 7 VS andNHS matrix pool, all of which assayed in duplicate. The CS
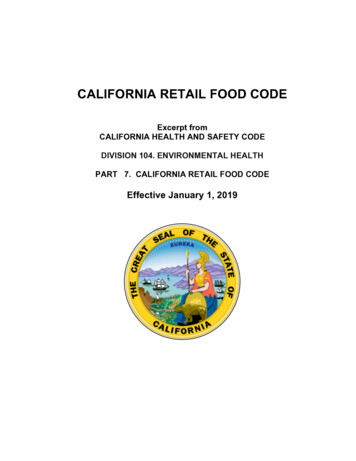
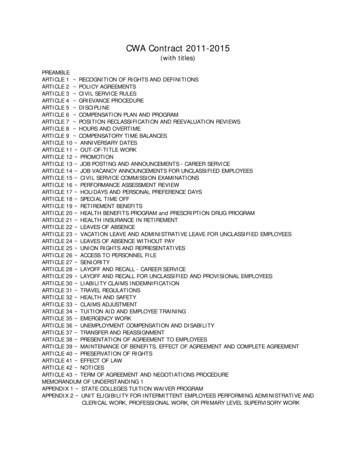
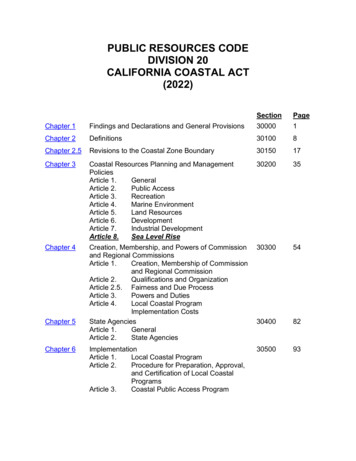
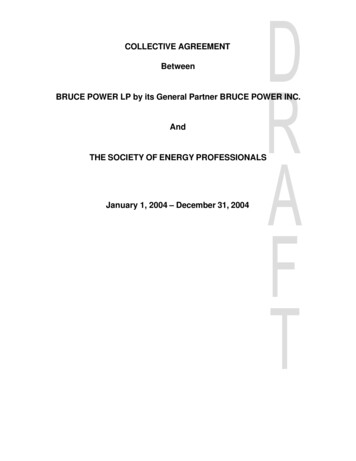
Calculations for Analytical Recoverycurve preparation was made fresh for each assay run, whilefrozen VS were used for all other determinations. Acceptancecriteria as applied to these analyses included percent coefficient of variation (%CV) 20% except for LLOQ where 25% was applicable. Percent AR was considered acceptableat 80–120%, except for LLOQ where 75–125% wasapplicable.CalculationsPercent total error (%TE) was used to describe accuracyand precision from multiples runs of VS. Percent TE as usedherein is the sum of inter-assay accuracy (percent relativeerror, %RE) plus inter-assay precision (percent coefficient ofvariation, %CV). Typical acceptance criteria are TE 30%,except at LLOQ where 40% is applicable (24). Percentspike was calculated by adding the nominal spike value withthe mean endogenous concentration of the matrix blankcontrol and dividing the nominal spike concentration by thetotal in the VS and multiplying by 100. LOD was definedusing the mean buffer blank ECLU plus 2.5 times thestandard deviation of that mean value.Raw mass units (e.g., pg/mL) reported for spiked VS, asgenerated by regression analysis with Watson software,reflects the combined presence of the spiked entity plus theendogenous component. Unadjusted %AR values are derived by division of these raw mass units by the respectivespike mass unit values multiplied by 100.The addition calculation method involved division of theobserved VS analytical result (measured concentration) bythe expected results, which is the sum of the nominal spikeplus the endogenous biomarker concentrations. The endogenous biomarker concentrations were determined by concurrent analysis of the NHS matrix blank during the A&P run ofthe VS. The equation for the addition %AR calculation is asfollows:% Analytical Recovery by Addition¼Measured Concentration 100Expected ConcentrationðNominal Spike Conc: þ Endogenous Conc:ÞThe subtraction calculation method involved eliminationof the endogenous component from the %AR determination.Thus, the measured amount of endogenous analyte wassubtracted from the total observed analyte concentration inthe VS, which was subsequently divided by the nominal spikeconcentration to yield AR. The equation for the subtraction%AR calculation is as follows:% Analytical Recovery by SubtractionNet Measured Spike¼ ðMeasured Conc: Endogenous Conc:Þ 100Nominal Spike ConcentrationAdjustments by subtraction were also conducted usingassay signal, ECLU. This adjustment involved calculating the941net ECLU attributable to the NHS matrix in the VS bysubtracting buffer blank mean ECLU from the matrix blankmean ECLU to generate a net matrix blank ECLU value.Acceptance criteria for mean ECLU values were CV 25%between replicate determinations and between duplicates foreach of those determination. Net matrix blank ECLU wasthen subtracted from the mean ECLU obtained with the NHSVS. Regression analysis vs. the buffer CS curves wassubsequently conducted, and the data processed withoutfurther adjustment.RESULTSCase Study 1: Endogenous Analyte Adjustments UsingIL-12/IL-23p40 A&P Run DataTable I shows a comparison of addition vs. subtractionmethods for endogenous analyte adjustment using data fromIL-12/IL-23p40 A&P assay runs. The cumulative A&P resultsestablished that the LLOQ for the assay was 17.5 pg/mL (notshown). Endogenous IL-12/IL-23p40 was detected in thematrix blanks in the range of 40.8–48 pg/mL, depending onthe run (inter-assay mean 42.3 pg/mL). Using a methoddescribed by others (1,17), parallelism was confirmed forendogenous IL-12/IL-23p40 in the NHS pool over a series offive dilutions, and following adjustment for the dilution factor,a CV of 9.0% was derived between sample means. Spike IL12/IL-23p40 was 5.83 pg/mL for all runs, approximately 12%of total IL-12/IL-23p40 analyte levels in the VS.Three runs are shown with unadjusted %AR failing forall runs. This confirms that accurate determinations ofrecovery required adjustment for the endogenous component.Run 1 shows near complete recovery of the spike (96%), withpassing %AR values regardless of adjustment method. Run 2yielded only an apparent 1.8 pg/mL net detectable spike(31% of the 5.83 pg/mL added) reflected in a failing %ARusing the subtraction method for adjustment. However, sincesuch a large part of the Bexpected value was due toendogenous analyte, the addition method yielded a passing%AR of 91%. Finally, run 3 shows an example of unacceptably high recovery using the subtraction method (146% ofspike) which would be considered passing using the additionmethod for adjustment. Thus, addition and subtractionmethods for adjusting endogenous analyte concentrations in%AR calculations can yield disparate AR conclusions.Case Study 2: Adjustment for Low Relative EndogenousIL-13 Levels with High Proportion IL-13 Spike ValuesShown in Table II are inter-assay results from 6 IL-13A&P runs using VS1, VS2, VS3, and VS4 (VS5, VS6, VS7,not shown for simplicity since unadjusted values passedcriteria). These data illustrate that the disparity in conclusionsgiven by the subtraction vs. addition adjustment methods wasnot restricted to biomarkers with very high endogenousanalyte levels. It was observed that endogenous IL-13 wasapproximately 3.7 pg/mL in the matrix blank as assessed bythe standard curve. Percent spike as a proportion of total IL13 in the VS ranged from 21 to 83% using the approximate3.7 pg/mL endogenous IL-13 value.
Marcelletti et al.942Table I. Case Study 1: IL-12/IL-23p40 A&P Runs Illustrate Disparity in %AR Conclusions Using Subtraction and Addition Adjustment 5.835.835.83Expected Observedpg/mLpg/mL53.853.646.642.647.850.5Net Spikepg/mL5.61.88.5%ARUnadjusted919% (Fail)731% (Fail)866% (Fail)%AR bySubtraction96% (Pass)31% (Fail)146% (Fail)%AR byAddition99.6% (Pass)91% (Pass)106% (Pass)Shown are values obtained from three A&P runs involving VS1 for IL-12/IL-23p40. Endogenous and observed IL-12/IL-23p40 values weredetermined by triplicate analysis of the matrix blank and VS1, respectively. Expected, net spike, and %AR values were obtained as describedin BMaterials and Methods. VS with %AR values between 80 and 120% were considering passing. Inter-assay mean endogenous level was43.2 pg/mL. Red text denotes failed VS, while blue identifies VS that passed acceptance criteria.%AR percent analytical recoveryUnadjusted %AR failed at all VS levels shown(Table II), confirming that accurate determinations of recovery required adjustment for the endogenous component. Theaddition method using 3.7 pg/mL endogenous IL-13 foradjustment yielded passing conclusions at all levels, includingthe 1 pg/mL spiked VS1. Consequently, from such data, itwould appear that the LLOQ of the assay is 1 pg/mL and the3.7 pg/ml endogenous analyte value was a valid determination. Using this endogenous IL-13 value with the subtractionmethod resulted in failed VS1 and VS2, but passed at VS3and VS4. However, the 3.7 pg/mL value should not beconsidered valid since it was BLOQ using the subtractionmethod, so the approach of using assay signal was investigated. Only VS4 passed using assay signal, identifying the LLOQfor the assay as 18 pg/mL based on these VS results.The validity of assay signal vs. mass units to calculated%AR was examined more fully by comparison of representative A&P results for IL-12/IL-23p40, IL-15, and IL-16. Amodest relationship (R2 0.6693) was observed between thenominal spiked VS concentrations and unadjusted observedresults (N 42 paired values); lack of a strong relationshipreflects the endogenous analytes that had not yet beenaccounted for in the determinations. Using the subtractionmethod and mass units within the range of the assays, a muchstronger relationship was observed between nominal spikeand derived results (R2 0.9650). This was comparable to massunits calculated by subtraction of matrix signal vs. nominalspike (R2 0.9809). There was a very strong relationship(R2 0.9886) between adjusted mass units as derived bysubtracting assay signal attributable to matrix vs. mass unitsderived by subtracting endogenous mass unit concentrationswithin the range of the respective assays. Preliminary resultswith individual NHS selectivity samples confirmed utility ofassay signal subtraction. However, this will have to beexamined in greater detail since selectivity usually involvessingle determinations with and without analyte and limitedinter-assay comparisons.These results demonstrate: (1) a potential pitfall usingthe addition method to determine LLOQ with VS, (2)potential issues associated with using mass units derivedTable II. Case Study 2: Adjustment for Low Relative Endogenous IL-13 Levels with High Proportion IL-13 Spikes Using Inter-assay Datafrom Six A&P RunsVSMeanEndogenous% Spikein VSMeanObservedVS11 pg/mL3.7 pg/mL21%4.23pg/mLVS23 pg/mL3.7 pg/mL45%6.25pg/mLVS36 pg/mL3.7 pg/mL62%9.62pg/mLVS418 pg/mL3.7 pg/mL83%22.1pg/mLAdjustmentUnadjustedAddition – pg/mLSubtracted – pg/mLSubtracted - ECLUUnadjustedAddition – pg/mLSubtracted – pg/mLSubtracted - ECLUUnadjustedAddition – pg/mLSubtracted – pg/mLSubtracted - ECLUUnadjustedAddition – pg/mLSubtracted – pg/mLSubtracted - dFailedFailedPassedPassedPassedShown are inter-assay values obtained from six A&P runs involving VS1, VS2, VS3, and VS4 for IL-13. Inter-assay mean endogenous andobserved IL-13 values were determined by triplicate analysis (N 18 for each from six runs) of the matrix blank and VS, respectively. PercentAR and TE values were obtained as described in BMaterials and Methods. Thirty percent TE was considered the cut point for failed vs.passed VS conclusions. Red text denotes failed VS, while blue identifies VS that passed acceptance criteria.%AR percent analytical recovery, %TE percent total error, VS validation samples, ECLU electrochemiluminescence units
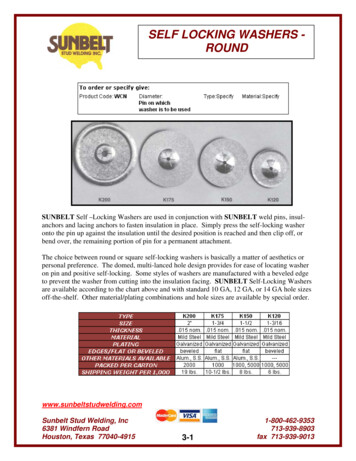
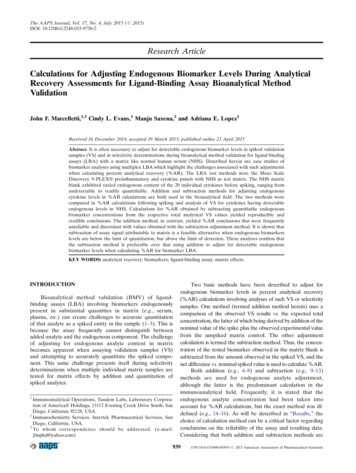
Calculations for Analytical Recovery943BLOQ for endogenous analyte adjustments, and (3) apparently successful use of assay signal for %AR calculationsinvolving analytes that are detectable, but not quantifiable inthis assay system.Case Study 3: Comparison of Addition vs. SubtractionAdjustment Methods with High Endogenous IL-16 LevelsAs shown in Table III, case study 3 confirms the disparitybetween addition and subtraction %AR calculations and alsoindicates the potential importance of cytokine spike toendogenous proportions in achieving a passing %AR.Shown are inter-assay A&P results (six runs) for IL-16, VS1through VS7 in NHS. The nominal spike range was 5 to494 pg/mL. Mean endogenous IL-16 was 167 pg/mL, withspiked quantities ranging from 3 to 75% of total IL-16content in the VS. Parallelism was established for endogenousIL-16 in the NHS pool over a series of five dilutions, andfollowing adjustment for the dilution factor, a CV of 16.1%was derived between sample means.Adjustments for endogenous IL-16 were necessary asindicated by unadjusted VS failing %AR at all levels(Table III). The addition method yielded passing %AR at alllevels, even the very lowest VS1 with 5.1 pg/mL (3%) spike. Thesubtraction method by mass units identified a spike of 56.5 pg/mL as the first passing VS concentration, with failed VS1, VS2,and VS3 for %TE reasons. These same low VS were BLOQafter subtraction of the signal attributable to NHS matrix.These results support the following conclusions, including that: (1) the addition method for endogenous analyteadjustment gave passing results regardless of spike toendogenous IL-16 proportions, (2) subtraction using massunits or assay signal yielded matching conclusions aboutwhich VS passed vs. which failed, and (3) spikes 25% maybe needed to consistently observe passing %AR using thesubtraction method for endogenous analyte adjustment.Requirements for VS Spike to Endogenous BiomarkerProportions to Consistently Observe Passing AnalyticalRecovery %TE ResultsThe data shown in Fig. 1 directly examines the relationships between spiked cytokine to endogenous cytokine levelsin VS vs. resulting %TE by subtraction and additionendogenous analyte adjustment methods with mass units(pg/mL). TE 30% was considered passing in this analysis(horizontal red lines). The proportions of spiked cytokine(panel a) and endogenous cytokine concentrations (panel b)in the various VS for analytes IFN-γ, TNF-α, IL-8, IL-12/IL23p40, IL-15, IL-16, and VEGF were plotted vs. the resultinginter-assay %TE from six A&P runs for each analyte usingthe two adjustment methods.Table III. Case Study 3: Comparison of Addition vs. Subtraction Adjustment Methods with High Endogenous IL-16 LevelsCalculation ParametersVS1VS2VS3VS4VS5VS6VS7Nominal Spiked Conc. (pg/mL)5.115.218.856.5132395494Mean Endogenous (N 18)167 pg/mLSpike % of Total IL-16 in VS3%8%10%25%44%70%75%Observed (mean pg/mL)170178179216295540649Mean net spike observed, pg/mL4.913.715.052.31313794883360% ARFail1172% ARFail954% ARFail381% ARFail224% ARFail137% ARFail131% ARFail94% AR11% TEPass96% AR295% TEFail94% AR11% TEPass90% AR99% TEFail98% AR7% TEPass79% AR96% TEFailBLOQN/ABLOQN/ABLOQN/A97% AR11% TEPass93% AR38% TEPass107% AR38% TEPass99% AR9% TEPass99% AR16% TEPass103% AR29% TEPass97% AR14% TEPass96% AR19% TEPass98% AR28% TEPass99% AR11% TEPass99% AR15% TEPass105% AR18% TEPassMean %AR, unadjustedMean %AR and %TE withaddition — pg/mLMean %AR and %TE withsubtraction — pg/mLMean %AR and %TE withsubtraction — ECLUShown are inter-assay values obtained from six A&P runs involving buffer and matrix blanks and seven VS for IL-16 (N 18 for each from sixruns). Calculations were conducted as described in BMaterials and Methods. VS with inter-assay %AR values between 80 and 120% (75–125% at LLOQ) were considering passing. Percent total error (%TE) 30% was considered passing, except at LLOQ where 40% wasacceptable. Blue text denotes VS conditions which passed acceptance criteria, while red VS failed criteria. BLOQ N/A indicates VS that couldnot be accurately quantitated and could not be assessed for pass or fail determinations. Notice that %AR values are mean inter-assay resultsand addition or subtraction calculations using mass units of mean observed or mean endogenous as shown in this table may not yield exactlythe same number%AR percent analytical recovery, %TE percent total error, ECLU electrochemiluminescence units, VS validation samples, BLOQ below thelimit of quantitation
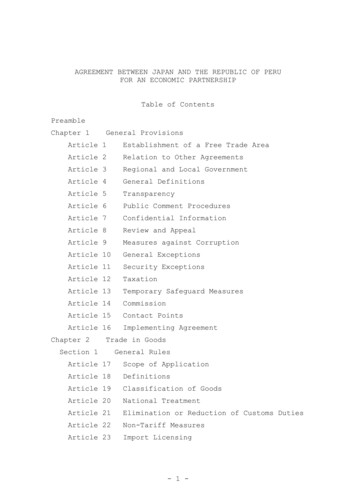
Marcelletti et al.944Fig. 1. Successful validation samples tend to have 25% spike regardless of endogenous biomarker concentrations. Cumulative A&P resultsinvolving six runs and seven VS each are shown for IFN-γ, TNF-α, IL-8, IL-12/IL-23p40, IL-15, IL-16, and VEGF. Percent TE and spike weredetermined as described in BMaterials and Methods. a presents the relationship between %TE and percent spike as a function of totalrespective biomarker in the VS. Red symbols for a represent %TE values calculated using the addition adjustment method, while black symbolsrepresent %TE values calculated using subtraction. b shows %TE calculated only by subtraction vs. endogenous biomarker levels for therespective cytokines. Black symbols in b illustrate %TE for VS having 25% spiked biomarker, and red symbols illustrate %TE for VS having 25% spiked biomarkerAs shown in panel a, using the subtraction calculation(black symbols), spikes 25% of total tended to yield high,unacceptable %TE in the upper left quadrant of thefigure. Indeed, none of the VS with 25% spike exhibitedpassing %TE. Conversely, spikes 25% tended to yieldlow %TE, as shown in the lower right quadrant of thefigure, with passing %TE 88% of the time. Increasing thepass cut point for TE to 40% yielded 95% passing VS,with 25% spike using subtraction. The addition calculation method yielded dramatically different conclusions, asfurther illustrated by the red symbols in panel a of Fig. 1.Fully 100% of the VS passed at a TE cut point of 30%,even with spikes as low as 2–3% of total cytokine (circleddata points in panel a).The relationship between baseline endogenous biomarker levels and %TE values was also investigated asshown in panel b of Fig. 1. Only %TE values calculatedusing the subtraction method are shown since the additionmethod yielded 100% passing VS regardless endogenousanalyte content. Percent TE values were broken downinto VS having 25% spike (black symbols) vs. those with 25% spike (red symbols). While increased variability wasobserved with increasing endogenous biomarker concentrations, this variability was largely restricted to VS having 25% spike. There is an apparent relationship withincreased endogenous biomarker levels which likely relates to correspondingly decreasing percent spike ratherthan endogenous concentrations per se. The data shown inFig. 1 indicate that high A&P variability in %TE for VSis less a function of high vs. low endogenous biomarkerlevels in the matrix and has more to do with theproportion of spike to endogenous concentrations.DISCUSSIONThe case studies presented herein clearly support thenotion that the subtraction method for adjusting endogenousbiomarker content in %AR calculations produces morereliable conclusions, as contrasted to the addition methodfor adjustment. Three individual case studies were describedin which experimental data were used to calculate %AR bythe two methods. Dramatically different conclusions aboutacceptability of VS values were observed in each case, withresults from the addition method often yielding ratherunreasonable passing conclusions. Figure 1 presented thecumulative results from six A&P runs, each for sevenbiomarkers using seven VS (total 49 VS) for each analyte.None of the 49 VS were considered failed for %AR reasonsusing the addition adjustment method. This goes for VScontaining as little as 2–3% spiked biomarker. This contrastswith the subtraction adjustment method where such smallamounts of spiked biomarker could not be reproduciblydocumented with the assays at hand.The data in Fig. 1 also indicate that successful %ARresults are less a factor of very high vs. low endogenousbiomarker concentrations, but rather the percent of spiketo endogenous analyte content. The findings from Fig. 1that approximately 25–30% spike to total biomarkercontent is needed for achieving reproducible %AR isconsistent with known accuracy and precision characteristics for LBA, 30–40% TE. Thus, it is reasonable thatcomparable %AR conclusion might be expected when applyinga 30% spike to an endogenous background of 10 or 100 pg/mL,as observed in Fig. 1, assuming sufficient sensitivity for the tworespective assays.
Calculations for Analytical RecoveryRelationships Between the Present Findings and OtherPublished WorksThe conclusions obtained from this study are entirelyconsistent with most current thinking on %AR calculationsfor adjusting endogenous biomarker content in spiked VSand selectivity samples (22,23). Accordingly, it is preferable tomake these calculations by subtracting
Watson LIMS software (Version 7.3.0.01, Thermo Fisher Scientific, Inc., Waltham, MA) and the concentrations of analytes in the samples determined following adjustment for dilution. Relevant BMV Details The BMV data presented herein were derived in a manner consistent with the principles of GLP referred to hereafter as regulated BMV.