Transcription
Remedial Education Reforms at California’s Community CollegesEarly Evidence on Placement and Curricular ReformsTechnical AppendicesCONTENTSAppendix A. Data and MethodsAppendix B. Figures and TablesOlga Rodriguez, Marisol Cuellar Mejia, Hans Johnsonwith research support from Sergio SanchezSupported with funding from the California Acceleration Project and the Sutton Family Fund
Appendix A. Data and MethodsDataOur quantitative approach utilizes student-level longitudinal data from the California Community CollegeChancellor’s Office Management Information System (COMIS). The dataset includes students enrolled acrossthe 114 community colleges that comprise the California Community College system, and includes informationon student characteristics (race/ethnicity, gender, low income status), course-taking behavior, course elements(title of course, levels below transfer level, credit status, transfer status and minimum/maximum number ofcredits), and student outcomes (grades, and credits earned).Data was also collected from an exhaustive scan of the latest college catalogs, websites, and other institutionaldocuments. This process allowed us to identify which colleges are already using multiple measures forplacement and/or offering co-requisite models as an alternative to traditional developmental sequences.Important DefinitionsFirst-time English (math) students: We create cohorts of students based on the term in which they took theirfirst English/math course anywhere in the system. They need not be first-time students in that term. Please notethat our numbers differ from the ones in the Basic Skills Cohort Tracker because in there cohorts are definedbased on the first term students ever took a course in the given subject area at the selected college. In otherwords, only courses at the focus college are considered when evaluating “first time in a basic skills subjectarea”. Meanwhile, our calculations take into consideration courses taken in any college in the system whendetermining first-time status. We restrict our sample to students with unique and valid student identifiers, whowere not enrolled as dual enrollment students. Slightly over half of students in our first-time math and Englishcohorts took their first math/English course during their first term ever in college—for 58 percent of first-timeEnglish students and 54 percent of first-time math students.Transfer-level courses: when we talk about transfer-level courses we are referring to the lowest-level Englishand math courses that are transferable to the University of California (UC) and/or to the California StateUniversity (CSU) systems on the basis of articulation agreements. These courses are also known as gateway orgatekeeper courses. For English only the first transfer-level composition course (C-ID ENGL 100) qualifies asthe gateway course. Considering that colleges’ math requirements vary according to the student’s program ofstudy, any transferable math course—including introductory statistics, trigonometry, college algebra, and precalculus—qualifies as a gateway course. Throughout the report we use the terms transfer-level and collegelevel interchangeably.One-year throughput rates: The proportion of a cohort of students who complete the transferable gatewaymath or English course within two primary semesters or three primary quarters of entering their first course inthe subject. For students attending multiple colleges (i.e. who take developmental course work in one collegeand transfer level in a different college), we assigned a positive outcome (i.e. completing the transferablecourse) to the college where the student took the developmental education course. We restrict our sample totransfer-seeking students (using the variable student goal from the success file in the COMIS data).Transfer-level success rates: Share of students who started in transfer-level that completed successfully thecourse in their first attempt (passed the course with a grade of C or better). Please note that this rate is notcalculated using all students enrolled in the transfer-level course, it is calculated only among the ones for whichthat was their first course.PPIC.ORGTechnical Appendices Remedial Education Reforms at California’s Community Colleges2
Early implementers: To identify the colleges that have engaged more actively in placement reform, we usedthe following criteria: Reported an annual increase of 10 percentage points or more in the share of first-time math/Englishstudents enrolling directly in transfer-level in 2016‒17; Saw increases in throughput rates relative to the prior year; Had a throughput rate higher than 50 percent; and Used robust multiple measures placement and/or offered co-requisite models.To inform our quantitative results, we collected information from interviews with faculty and staff fromCalifornia’s community colleges. In spring 2018, we interviewed 31 individuals—21 faculty (10 math and 11English) and 10 staff (assessment, counseling, and institutional research) at 16 colleges across the state. Thecolleges that we interviewed were among the colleges with increases of 10 percentage points or more in theshare of first-time math/English students starting directly in transfer-level. All the colleges that we interviewedwere either offering co-requisite models or using multiple measures placement (we talked with 9 of the 10colleges that offered co-requisite models in 2016-17). We spoke with each interviewee for about one hour overthe phone. Interviewees were asked a variety of questions pertaining to their background; how students assessand place into co-requisite and transfer-level math and English courses; how students enroll in and learn aboutco-requisite math and English courses, student experiences in co-requisite courses, aspects of the co-requisitecourse (e.g., motivation for offering it, course structure, and curriculum), professional development, as well asfunding and scaling up co-requisite and multiple measures reforms. Open-ended questions were used tofacilitate the collection of information based on questions that do not restrict the participants’ opinions(Creswell and Plano Clark 2011).The data collection and data analysis were carried out simultaneously to avoid the collection of repetitive andunfocused data (Merriam 1998). Particularly, after each interview was conducted, researchers debriefed,reviewed detailed data notes and audio recordings, and kept notes to capture reflections, emerging themes, andpoints that needed to be pursued further. This process of review and reflection informed all subsequentinterviews. In this manner, data collected from each interview was continuously assessed and informed futureinterviews until data collection was complete. The data was also organized and coded on a secure spreadsheet.This approach was used to come up with a number of patterns and themes.PPIC.ORGTechnical Appendices Remedial Education Reforms at California’s Community Colleges3
Appendix B. Figures and TablesTABLE 1MathFirst-timeMath cohortAlamedaShare of firsttime mathstudentsstartingdirectly intotransfer-levelmath (%),2016-17Increase fromprior yearOne-yearthroughput rate,Fall 2016 (%)Increase fromprior yearCo-requisiteremediationas of 2016201782139536(4)–Allan Hancock1,989243320–American River3,73723223(0)–Antelope stow6731983920–Berkeley Cerro CosoPPIC.ORGTechnical Appendices Remedial Education Reforms at California’s Community Colleges4
First-timeMath cohortShare of firsttime mathstudentsstartingdirectly intotransfer-levelmath (%),2016-17Increase fromprior yearOne-yearthroughput rate,Fall 2016 (%)Increase fromprior yearCo-requisiteremediationas of 20162017Compton1,3009(1)9(3)–Contra Costa1,06437329(4)–Copper Mountain419185296–Cosumnes River2,47119(2)22(3)–Crafton aca1,22657315719YESCypress2,62029329(2)–De Anza4,07134039(8)–Desert1,99316(1)16(2)–Diablo Valley3,88057348(3)–East L.A.4,76613212(3)–El Camino4,98120126(3)–Evergreen Valley2,10229526(2)–35331(9)50(5)–Folsom Lake1,681250281–Foothill1,81958(3)52(8)–Fresno 1,007256220–Glendale2,69232(1)341–Golden tnell2,04117327(1)–Feather RiverPPIC.ORGTechnical Appendices Remedial Education Reforms at California’s Community Colleges5
First-timeMath cohortShare of firsttime mathstudentsstartingdirectly intotransfer-levelmath (%),2016-17Increase fromprior yearOne-yearthroughput rate,Fall 2016 (%)Increase fromprior yearCo-requisiteremediationas of 20162017Imperial Valley1,74712421(2)–Irvine Valley3,13546042(10)–L.A. City2,03916312(1)–L.A. Harbor1,61615(2)17(3)–L.A. Mission1,47919515(0)–L.A. Pierce3,51422027(7)–L.A. Trade–Tech1,592406(1)–L.A. 1)32(3)–Las (7)19(5)–Long Beach City5,52323219(1)–Los 55424223(7)–2,670264240–75123521(1)–Mira 29744240(6)–Lake TahoeLassenMercedMerrittPPIC.ORGTechnical Appendices Remedial Education Reforms at California’s Community Colleges6
First-timeMath cohortShare of firsttime mathstudentsstartingdirectly intotransfer-levelmath (%),2016-17Increase fromprior yearOne-yearthroughput rate,Fall 2016 (%)Increase fromprior yearCo-requisiteremediationas of 20162017Moreno Valley1,609126120–Mt. San Antonio5,18431130(4)–Mt. San Jacinto3,855181280–Napa 11250382–Orange 7(3)–Palomar4,75529224(4)–Pasadena ods83832027(11)–Reedley2,01019(2)21(2)–Rio ento San Bernardino2,9999116(1)–San Diego City2,75128122(5)YESSan Diego Mesa3,59047243(1)–San DiegoMiramar1,87947545(4)–San Francisco City3,10841138(4)–San Joaquin Delta3,95915118(2)–Palo VerdePPIC.ORGTechnical Appendices Remedial Education Reforms at California’s Community Colleges7
First-timeMath cohortShare of firsttime mathstudentsstartingdirectly intotransfer-levelmath (%),2016-17Increase fromprior yearOne-yearthroughput rate,Fall 2016 (%)Increase fromprior yearCo-requisiteremediationas of 20162017San Jose City1,18530321(4)–San Mateo1,54845435(3)–Santa Ana2,92133429(6)–Santa Barbara City2,3105211568–Santa Monica5,61939625(0)–Santa Rosa3,11731(2)30(7)–Santiago Southwest 27(2)–Ventura2,55536238(1)–Victor Valley2,8456(0)142–West L.A.1,25519210(1)–West ideSOURCE: Authors’ analysis of COMIS data.PPIC.ORGTechnical Appendices Remedial Education Reforms at California’s Community Colleges8
TABLE 2EnglishFirst–timeEnglishcohortShare of first–time Englishstudentsstartingdirectly intocollegecomposition(%), 2016–175565910Allan Hancock2,06150American River3,233Antelope ValleyBakersfieldIncrease fromprior yearCo–requisiteremediationas of –4,4785212451–Barstow627275482–Berkeley ompton1,233241273–Contra Costa90732645(0)–Copper Mountain469393506–Cosumnes River2,382585545–AlamedaCerro CosoPPIC.ORGIncrease fromprior yearOne–yearthroughputrate, Fall 2016(%)Technical Appendices Remedial Education Reforms at California’s Community Colleges9
First–timeEnglishcohortShare of first–time Englishstudentsstartingdirectly intocollegecomposition(%), 2016–17Increase fromprior yearOne–yearthroughputrate, Fall 2016(%)Increase fromprior yearCo–requisiteremediationas of 2016–2017Crafton ,0875219574YESCypress2,68832050(1)–De Anza3,42936363(4)–Desert2,434332535–Diablo Valley3,253365613–East L.A.3,760244352–El Camino4,74140(1)491–Evergreen Valley1,590385371–33454(1)64(1)–Folsom Lake1,461353523–Foothill1,40851(6)65(9)–Fresno 339(9)–Glendale2,65055(1)61(3)–Golden l2,021344441–Imperial Valley1,613297424–Irvine Valley2,09651146713–L.A. City1,881265392–L.A. Harbor1,47032448(2)–L.A. Mission1,356270303–L.A. Pierce3,40218240(2)–Feather RiverGavilanPPIC.ORGTechnical Appendices Remedial Education Reforms at California’s Community Colleges10
First–timeEnglishcohortShare of first–time Englishstudentsstartingdirectly intocollegecomposition(%), 2016–17Increase fromprior yearOne–yearthroughputrate, Fall 2016(%)Increase fromprior yearCo–requisiteremediationas of 2016–2017L.A. Trade–Tech1,45241284014–L.A. Valley2,752428464–Lake �35739(3)65(4)–Lemoore1,064464572–Long Beach City3,901492636(1)–Los 9(2)48(2)–Moorpark3,09580078(1)–Moreno Valley1,6723715515–Mt. San Antonio5,61216(1)34(6)–Mt. San Jacinto3,9385026579–Napa 69411500–Orange Coast3,79257(1)60(6)–Oxnard1,11754258(4)–Las PositasLassenMercedMerrittMira CostaMissionPPIC.ORGTechnical Appendices Remedial Education Reforms at California’s Community Colleges11
First–timeEnglishcohortShare of first–time Englishstudentsstartingdirectly intocollegecomposition(%), 2016–17Increase fromprior year355321Palomar3,96249Pasadena City5,136PortervilleRedwoodsIncrease fromprior yearCo–requisiteremediationas of 16–75446148(3)–Reedley2,10025(0)30(1)–Rio ento City2,685372464YESSaddleback3,28635(3)552–San Bernardino2,30821(2)26(4)–San Diego City2,580254498–San Diego MesaSan DiegoMiramar3,2564713589YES1,63946115411–San Francisco City2,341308439–San Joaquin Delta3,59640047(2)–980498507–San Mateo1,2547738686–Santa Ana2,3477527511–Santa Barbara City2,346734631–Santa Monica5,61154751(0)–Santa Rosa3,02154(0)59(3)–Santiago asta1,41868458(5)–Sierra3,732699641–Palo VerdeSan Jose CityPPIC.ORGOne–yearthroughputrate, Fall 2016(%)Technical Appendices Remedial Education Reforms at California’s Community Colleges12
First–timeEnglishcohortShare of first–time Englishstudentsstartingdirectly intocollegecomposition(%), 2016–17Increase fromprior –Ventura2,249559624–Victor Valley2,313220499–West L.A.1,0736227484–West )–240,888446511–SiskiyousSouthwest rthroughputrate, Fall 2016(%)Increase fromprior yearCo–requisiteremediationas of 2016–2017SOURCE: Authors’ analysis of COMIS data.PPIC.ORGTechnical Appendices Remedial Education Reforms at California’s Community Colleges13
TABLE 3Math one–year throughput rates by starting course lan HancockAmerican RiverAntelope ValleyBakersfieldBarstowBerkeley CityButteCabrilloCanadaCanyonsCerritosCerro mbiaComptonContra CostaCopper MountainCosumnes RiverCrafton HillsCuestaCuyamacaCypressDe AnzaDesertDiablo ValleyEast L.A.El CaminoEvergreen ValleyFeather RiverFolsom LakeFoothillFresno CityFullertonGavilanGlendaleGolden WestGrossmontHartnellImperial �––––––All first–time 5Technical Appendices Remedial Education Reforms at California’s Community Colleges14
MathTraditionaldevelopmentalmathIrvine ValleyL.A. CityL.A. HarborL.A. MissionL.A. PierceL.A. Trade–TechL.A. ValleyLake TahoeLaneyLas PositasLassenLemooreLong Beach CityLos MedanosMarinMendocinoMercedMerrittMira CostaMissionModestoMontereyMoorparkMoreno ValleyMt. San AntonioMt. San JacintoNapa ValleyNorcoOhloneOrange CoastOxnardPalo VerdePalomarPasadena CityPortervilleRedwoodsReedleyRio HondoRiversideSacramento CitySaddlebackSan BernardinoSan Diego CitySan Diego MesaSan Diego MiramarSan Francisco CitySan Joaquin �––––––––––All first–time 3616Technical Appendices Remedial Education Reforms at California’s Community Colleges15
MathTraditionaldevelopmentalmathSan Jose CitySan MateoSanta AnaSanta Barbara CitySanta MonicaSanta RosaSantiago uthwest L.A.SouthwesternTaftVenturaVictor ValleyWest L.A.West ��–––––––71All first–time 5111626* N 10SOURCE: Authors’ analysis of COMIS data.PPIC.ORGTechnical Appendices Remedial Education Reforms at California’s Community Colleges16
TABLE 4English one–year throughput rates by starting course medaAllan HancockAmerican RiverAntelope ValleyBakersfieldBarstowBerkeley CityButteCabrilloCanadaCanyonsCerritosCerro mbiaComptonContra CostaCopper MountainCosumnes RiverCrafton HillsCuestaCuyamacaCypressDe AnzaDesertDiablo ValleyEast L.A.El CaminoEvergreen ValleyFeather RiverFolsom LakeFoothillFresno CityFullertonGavilanGlendaleGolden WestGrossmontHartnellImperial �–––All first–timeEnglish chnical Appendices Remedial Education Reforms at California’s Community Colleges17
EnglishTraditionalDevelopmentalEnglishIrvine ValleyL.A. CityL.A. HarborL.A. MissionL.A. PierceL.A. Trade–TechL.A. ValleyLake TahoeLaneyLas PositasLassenLemooreLong Beach CityLos MedanosMarinMendocinoMercedMerrittMira CostaMissionModestoMontereyMoorparkMoreno ValleyMt. San AntonioMt. San JacintoNapa ValleyNorcoOhloneOrange CoastOxnardPalo VerdePalomarPasadena CityPortervilleRedwoodsReedleyRio HondoRiversideSacramento CitySaddlebackSan BernardinoSan Diego CitySan Diego MesaSan Diego MiramarSan Francisco CitySan Joaquin �67–––85–––All first–timeEnglish 44Technical Appendices Remedial Education Reforms at California’s Community Colleges18
EnglishTraditionalDevelopmentalEnglishSan Jose CitySan MateoSanta AnaSanta Barbara CitySanta MonicaSanta RosaSantiago uthwest L.A.SouthwesternTaftVenturaVictor ValleyWest L.A.West 8All first–timeEnglish 4248* N 10SOURCE: Authors’ analysis of COMIS data.PPIC.ORGTechnical Appendices Remedial Education Reforms at California’s Community Colleges19
TABLE 5Math Access Rates by Race/EthnicityShare of first–time math students starting directly intotransfer–level math (%), IncomeAnnual change in the share of first–time math students goingdirectly to transfer–level math eCohortSize 75367525933312743272415532Los Medanos565767445630203553233720737College of 194918352121847153214188,124Average earlyimplementers555165565732Statewidewithout earlyimplementers271949183521SOURCE: Authors’ analysis of COMIS data.PPIC.ORGTechnical Appendices Remedial Education Reforms at California’s Community Colleges20
TABLE 6Math Throughput Rates by Race/EthnicityOne–year throughput rates (%), Fall 2016 ous5850887358Cuyamaca57557144Los Medanos515066College of theCanyons4436Statewide2719Annual change in the one–year throughput rates ino543635*6156191637524796231533950133623Average earlyimplementers534872465649Statewide withoutearly SizeFall2016SOURCE: Authors’ analysis of COMIS data.PPIC.ORGTechnical Appendices Remedial Education Reforms at California’s Community Colleges21
TABLE 7English Access Rates by Race/EthnicityShare of first–time English students starting directly intocollege composition (%), IncomeAnnual change in the share of first–time English studentsgoing directly to college composition eCohortSize2016–2017San 82Las 989792828285627281,209Santa Ana7573828191762730123415302,347Mt. Valley3734573258341514341616121,672Irvine Valley513858315946141414915162,096San ical Appendices Remedial Education Reforms at California’s Community Colleges22
Share of first–time English students starting directly intocollege composition (%), IncomeAnnual change in the share of first–time English studentsgoing directly to college composition eCohortSize2016–2017San 3547315938667856240,888Average earlyimplementers595465516855Statewidewithout earlyimplementers433547315938SOURCE: Authors’ analysis of COMIS data.PPIC.ORGTechnical Appendices Remedial Education Reforms at California’s Community Colleges23
TABLE 8English Throughput Rates by Race/EthnicityOne–year throughput rates (%), Fall 2016 cohortAfricanAmericanAnnual change in the one–year throughput rates (pp)CohortSize 964552(1)4173(4)7346857776772673(4)412(2)2670Santa Ana51487760705422(3)*(9)41,095Mt. San 586Canada6052814572596(1)3*310313Moreno Valley515065366550654(1)144870Irvine Valley675874467265131961113141,151San n Mateo68618054Solano646178Coalinga7470Las hiteLowIncomeTechnical Appendices Remedial Education Reforms at California’s Community Colleges24
San 63461112(0)(0)Average without earlyimplementers665116,713SOURCE: Authors’ analysis of COMIS data.PPIC.ORGTechnical Appendices Remedial Education Reforms at California’s Community Colleges25
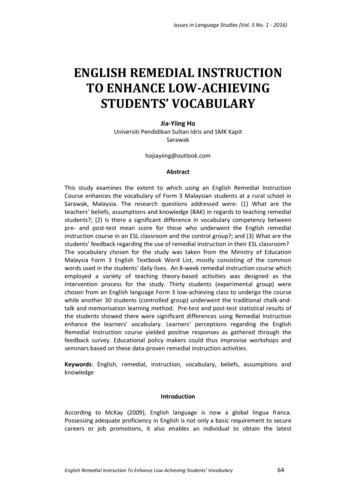
FIGURE 1Change in transfer–level math course success rates vs. changes in first–time math students starting in transfer–levelChange in transfer-level math coursesuccess rates (pp)3020100-10-20-30-20-100102030405060Change in the share of first-time math students enrolling directly in transfer level (pp)SOURCE: Authors’ analysis of COMIS data.FIGURE 2Transfer–level English course success rates vs. changes in first–time English students starting in transfer–levelChange in transfer-level Englishcourse success rates (pp)20151050-5-10-15-20-100102030405060Change in the share of first-time English students enrolling directly in transfer-level (pp)SOURCE: Authors’ analysis of COMIS data.PPIC.ORGRemedial Education Reforms at California’s Community Colleges26
The Public Policy Institute ofCalifornia is dedicated to informingand improving public policy inCalifornia through independent,objective, nonpartisan research.Public Policy Institute of California500 Washington Street, Suite 600San Francisco, CA 94111T: 415.291.4400F : 415.291.4401PPIC.ORGPPIC Sacramento CenterSenator Office Building1121 L Street, Suite 801Sacramento, CA 95814T: 916.440.1120F : 916.440.1121
Our quantitative approach utilizes student -level longitudinal data from the California Community College Chancellor's Office Management Information System (COMIS). . (assessment, counseling, and institutional research) at 16 colleges across the state. The colleges that we interviewed were among the colleges with increases of 10 percentage .