Transcription
Appendix
Investment ManagementMajor Contributor to Our Strong Capital PositionFinancial Implications of Potential SeparationCapitalEarningsPrice / EarningsImpactPotentialValuation ImpactRemainCo’s spot and stress capital position is weaker post-separation- Asset Management - spin requires debt to fund a repatriation ofcapital to RemainCo- RemainCo - issue stock or reduce future capital payout toneutralize impact on capitalNegativeCost of additional debtLoss of synergies between businessesAsset Management would face public company costsNegativeCurrently, no material multiple differentiationNeutral114
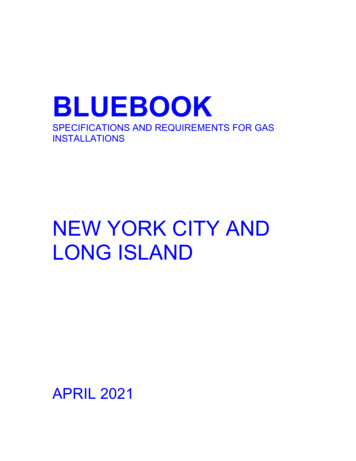
G-SIB, CCAR and Corporate Peer GroupsCCAR BanksG-SIB Members11-MemberCorporate Peer GroupBNY MellonBank of ChinaBNY MellonPNC Financial ServicesBlackRockBank of AmericaBanco Bilbao Vizcaya ArgentariaNorthern TrustSunTrust BanksCharles SchwabBarclaysBNP ParibasState StreetRegions FinancialCorporationFranklin ResourcesCitigroupCredit SuisseAmerican ExpressJP Morgan ChaseJP Morgan ChaseGoldman SachsCredit AgricoleDiscover FinancialBB&TMorgan StanleyHSBCDeutsche BankWells FargoGoldman SachsNorthern TrustJP Morgan ChaseIndustrial and Commercial Bankof ChinaKeyBankMorgan StanleyPNC Financial ServicesCapital OneCitigroupPrudential FinancialU.S. BancorpBank of AmericaState StreetMorgan StanleyRoyal Bank of ScotlandMitsubishi UFJ FGMizuho FGFifth Third BankStandard CharteredU.S. BancorpNordeaWells FargoState StreetSantanderUBSSociete GeneraleWells FargoSumitomo MitsuiUnicredit Group115
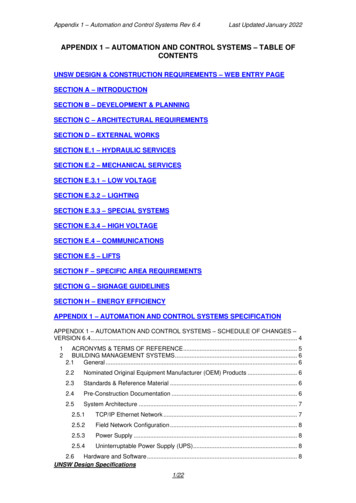
Estimated Fully Phased-In Basel III CET1 Ratio - Non-GAAP1( MM)Total Tier 1 capital9/30/14 21,019Adjustments to determine estimated fully phased-in Basel III CET1:Deferred tax liability – tax deductible intangible assetsIntangible deductionPreferred stockTrust preferred securitiesOther comprehensive income (loss) and net pension fund assets:Securities available-for-salePension liabilitiesNet pension fund assets—(2,388)(1,562)(162)578(675)—Total other comprehensive income (loss) and net pension fund assets(97)Equity method investments(92)—Deferred tax assetsOtherTotal estimated fully phased-in Basel III CET12 16,720 154,298Under the Standardized Approach:Estimated fully phased-in Basel III risk-weighted assetsEstimated fully phased-in Basel III CET1 ratio – Non-GAAP2Under the Advanced Approach:Estimated fully phased-in Basel III risk-weighted assets10.8% 167,933Estimated fully phased-in Basel III CET1 ratio – Non-GAAP210.0%1 Sept. 30, 2014 information is preliminary.2 Beginning with June 30, 2014, risk-based capital ratios include the net impact of including the total consolidated assets of certain consolidated investment management funds inrisk-weighted assets. These assets were not included in prior periods.116
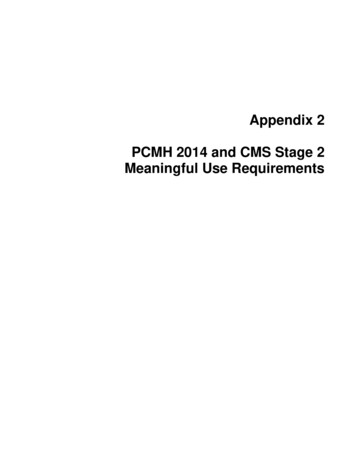
Business – Revenue and Pretax IncomeRevenue( MM)Investment ManagementInvestment ServicesPretax Income( MM)Investment ManagementInvestment Services4Q131Q142Q14LTM9/30/143Q14 1,061 970 1,036 1,003 /143Q14 301 277 202 276 1,0566486996897532,789NOTE: Pretax metrics for Investment Services and Investment Management exclude the impact of intangible amortization.117
DisclosuresAll statistics are global and represent the minimum number of BNY Mellon client relationships in each category. Fortune 500 (as of 12/31/13)// Fortune magazine, May 2013; Global 500 data Central Banks (as of June 2013)// CIA World Factbook, IMF, annual reports Pensions & EB Funds (as of 2/26/14)// Reprinted with permission of Pensions & Investments, Copyright 2013 // Metric is Plan Assets, millions (converted inthousands) Endowments (as of 2/26/14)// Reprinted with permission of NACUBO, Copyright 2013 // Metric is Total Market Value of Endowments, in thousands, as ofFYE 2011// Data source used by P&I Magazine Life & Health Insurance Companies (as of 2/26/14)// Reprinted with permission of A.M. Best Company, Inc., Copyright 2013 // Metric is 2012 Total Admitted Assets, in thousands QS World Universities Top 50 (of 400 listed) (as of 12/31/2013)// university-rankings/2013118
Historical Performance – Growth Rates2011201314,79815,0485080302--9Total Revenue – Non-GAAP 14,446 14,959Fee Revenue – GAAP 11,566 11,715302--9( MM)Total Revenue - GAAPLess: Net income attributable to noncontrolling interestsrelated to consolidated investment managementfundsImpact of Shareowner ServicesNet gain related to an equity investmentLess: Impact of Shareowner ServicesNet gain related to an equity investment2011-2013CAGRNet income applicable to common shareholders of TheBank of New York Mellon Corporation – GAAPAdd: Amortization of intangible assets, net of taxNet income applicable to common shareholders of TheBank of New York Mellon Corporation excludingamortization of intangible assets – Non-GAAP2%Add: M&I, litigation and restructuring chargesNet charge related to the disallowance of certain foreigntax creditsFee Revenue – Non-GAAP 11,264 11,7062%Net interest revenue – (GAAP) 2,984 3,0090%Noninterest expense- GAAPLess: Intangible amortization (excludes impact ofShareowner Services for 2011)M&I, litigation & restructuring 11,112 11,30641534239070189-Impact of Shareowner ServicesNet charge related to investment management funds,net of incentivesNoninterest expense– Non-GAAP-12 10,118 10,882( MM)2013 2,0402202,26045593Net charge related to investment management funds,net of incentives9Net income applicable to common shareholders of TheBank of New York Mellon Corporation, as adjusted – Non GAAP1 2,907Average common shareholders’ equity 34,832Return on common equity – Non-GAAP18.3%4%1 Non-GAAP excludes M&I, litigation and restructuring charges, the net charge related to the disallowance of certain foreign tax credits and the net charge related to investment management funds, net ofincentives, if applicable.119
Noninterest Expense – Non-GAAP( MM)4Q13Total noninterest expense – GAAP1Q142Q143Q14LTM 9/30/14 2,877 2,739 2,946 2,968 11,53082757575307M&I, litigation and restructuring charges2(12)122220332Charge (recovery) related to investment management funds, netof incentives-(5)109-104 2,793 2,681 2,640 2,673 10,787Less: Amortization of intangible assetsTotal noninterest expense excluding amortization of intangible assets,M&I, litigation and restructuring charges and the charge related toinvestment management funds, net of incentives – Non-GAAP( MM)Total noninterest expense – GAAPLess: Amortization of intangible assetsM&I, litigation and restructuring chargesCharge (recovery) related to investment management funds, netof incentivesTotal noninterest expense excluding amortization of intangible assets,M&I, litigation and restructuring charges and the charge related toinvestment management funds, net of incentives – Non-GAAP4Q121Q132Q133Q13LTM 9/30/13 2,825 2,828 2,822 2,779 11,2549686938135646391316114-39(27)-12 2,683 2,664 2,743 2,682 10,772120
Operating Margin – Non-GAAPLTM 9/30/13LTM 9/30/14 15,070 15,614Net securities gains (losses)(152)(99)Loss (gain) on equity investments & asset sales(184)175Accretable discount(226)(179)Earnings attributable to non-controlling interest(75)(77)5868Gain on the sale of our investment in Wing Hang-(490)Gain on the sale of the One Wall Street building-(346)Core Revenue 14,491 14,666Total Expense – GAAP 11,254 11,530Amortization of intangible assets(356)(307)M&I, litigation & restructuring(114)(332)Net charge related to investment management funds, net of incentives(12)(104)Core Expense 10,772 10,787Core Pretax Income 3,719 3,879Core Pretax Margin25.7%26.4%( MM)Total Revenue - GAAPFTE adjustment121
DisclosuresBroker-Dealer Services: #1 (U.S.), growing globallyLeading provider of U.S. Government securities clearance servicesSource: Federal Reserve Bank of New York - Fedwire Securities High Volume Customer Report,March 2013Alternative Investment Services: #3 fund administratorBased on single manager funds and funds of hedge fund assets under administration combined.Source: HFMWeek 20th Biannual AuA Survey - June 2013Corporate Trust: #1 Global Corporate Trust Service ProviderSource: Thomson Reuters and Dealogic, first quarter, 2013Depositary Receipts: #1 in market share ( 60%)Leader in sponsored global depositary receipts programsSource: BNY Mellon. Data as of December 31, 2013Pershing: #1 U.S. clearing firmPershing LLC., ranked by number of broker-dealer customersSource: Investment News, 2012Treasury Services: Top 5 in U.S.D. paymentsFifth largest participant in CHIPS funds transfer volumeFifth largest Fedwire payment processorSource: CHIPS High Volume Customer Report, June 2013 and Fedwire High Volume CustomerReport, June 2013Asset ManagementSixth largest global asset managerSource: Pensions & Investments, December 2013Wealth ManagementSeventh largest U.S. wealth managerSource: Barron’s, Sept 2013Collateral Management (2014) & Fixed Income Lender (2014) – First PlaceSource Global Investor/ISFSecurities Lending (2013) and Collateral Optimization (2014) – Roll of HonorSource: Global CustodianBest Forecast, Best FX Research and World’s Best FX Provider (2014)Source: Global Finance122
Pretax Operating Margin – Investment Management( MM)20112013LTM9/30/14Income before income taxes – GAAP 682 968 928Add: Amortization of intangible assets213148128Money market fee waivers94108125-12104 989 1,236 1,285 3,396 3,928 4,070412429430148147151242255276 3,078 3,607 3,76532%34%34%Net charge related to investment management funds, net of incentivesIncome before income taxes excluding amortization of intangible assets, money market fee waivers and the charge relatedto investment management funds, net of incentives – Non-GAAPTotal revenue – GAAPLess: Distribution and servicing expenseMoney market fee waivers benefiting distribution and servicing expenseAdd: Money market fee waivers impacting total revenueTotal revenue net of distribution and servicing expense and excluding money market fee waivers - Non-GAAPPre-tax operating margin excluding amortization of intangible assets, money market fee waivers, the charge related toinvestment management funds, net of incentives and net of distribution and servicing expense – Non-GAAP11 Income before taxes divided by total revenue.123
Pretax Income Growth – Non-GAAP – Investment Management( MM)20112013LTM 9/30/14Income before income taxes – GAAP 682 968 928Add: Amortization of intangible assets213148128-12104 895 1,128 1,160Charge (recovery) related to investment management funds, netof incentivesIncome before income taxes excluding amortization of intangibleassets and the charge related to investment management funds, net ofincentives – Non-GAAP2013 vs 2011Growth RateLTM 9/30/14vs 2011Growth Rate26%30%124
Return on Tangible Common Equity – Non-GAAP( MM)201120122013Net income applicable to common shareholders of The Bank of New York Mellon Corporation – GAAP 2,510 2,419 2,040Add: Amortization of intangible assets, net of taxNet income applicable to common shareholders of The Bank of New York Mellon Corporation excludingamortization of intangible assets – Non-GAAP2692472202,7792,6662,260------24033945Net charge related to the disallowance of certain foreign tax credits--593Net charge related to investment management funds, net of incentives-129Net income applicable to common shareholders of The Bank of New York Mellon Corporation, as adjusted– Non-GAAP2 3,019 3,017 2,907Average common shareholders’ equity 33,519 34,333 34,832Less: Average goodwill18,12917,96717,9885,4984,9824,619Add: Deferred tax liability – tax deductible goodwill19671,1301,302Deferred tax liability – intangible assets11,4591,3101,222 12,318 13,824 14,74924.5%21.8%19.7%Less: Gain on the sale of investment in Wing HangGain on the sale of the One Wall Street buildingAdd: M&I, litigation and restructuring chargesAverage intangible AssetsAverage tangible common shareholders’ equityReturn on tangible common equity – Non-GAAP adjusted21 Deferred tax liabilities are based on fully phased-in Basel III rules.2 Non-GAAP excludes M&I, litigation and restructuring charges, the net charge related to investment management funds, net of incentives and the net charge related to the disallowance ofcertain foreign tax credits, where applicable.125
Dodd-Frank Act Stress Test – Severely Adverse ScenarioBank Holding CompanyAmerican Express CompanyBNY MellonBB&T CorporationSunTrust BanksU.S. BancorpPNC Financial Services GroupNorthern Trust CorporationDiscover Financial ServicesFifth Third BancorpAlly FinancialKeyCorpRegions Financial CorporationComerica IncorporatedState Street CorporationWells Fargo & CompanyM&T Bank CorporationUnionBanCal CorporationBBVA Compass BancsharesRBS Citizens Financial GroupBMO Financial Corp.Huntington Bancshares IncorporatedJPMorgan Chase & Co.Capital One Financial CorporationBank of America CorporationCitigroupSantander Holdings USAMorgan StanleyZions BancorporationGoldman Sachs GroupHSBC North America CSCMSZBGSHSBCTier 1 Common Ratio (%)Actual Q3 24.95.25.56.46.56.97.38.1126
Estimated SLR – Non-GAAPEstimated SLR - Non-GAAP1( MM)Total CET1 - fully phased-in9/30/14 1,560Additional Tier 1 capitalTotal Tier 1 capital16,720 18,280Total leverage exposure:380,409Quarterly average total assetsLess: Amounts deducted from Tier 1 capital20,166Total on-balance sheet assets, as adjusted360,243Off-balance sheet exposures:11,694Potential future exposure for derivatives contracts (plus certain other items)—Repo-style transaction exposures included in SLR21,924Credit-equivalent amount other off-balance sheet exposures (less SLR exclusions)33,618Total off-balance sheet exposuresTotal leverage exposureEstimated SLR 393,8614.6%1 The estimated fully phased-in SLR as of Sept. 30, 2014 is based on our interpretation of the Final Capital Rules, as supplemented by the Federal Reserve’s final rules on the SLR. On afully phased-in basis, we expect to satisfy a minimum SLR of over 5%, 3% attributable to a regulatory minimum SLR, and greater than 2% attributable to a buffer applicable to U.S. G-SIBs.127
DisclosuresIMPORTANT INFORMATION BNY Mellon Investment Management is one of the world’s leading investment management organizations and one of the top U.S. wealth managers,encompassing BNY Mellon’s affiliated investment management firms, wealth management organization and global distribution companies. BNY Mellon isthe corporate brand of The Bank of New York Mellon Corporation and may also be used as a generic term to reference the Corporation as a whole or itsvarious subsidiaries generally. Products and services may be provided under various brand names and in various countries by subsidiaries, affiliates andjoint ventures of The Bank of New York Mellon Corporation where authorized and regulated as required within each jurisdiction. Products or services described herein are provided by BNY Mellon, its subsidiaries, affiliates or related companies and may be provided in variouscountries by one or more of these companies where authorized and regulated as required within each jurisdiction. Certain investment vehicles may onlybe offered through regulated entities or licensed individuals, such as a bank, a broker-dealer or an insurance company. However, this material is notintended, nor should be construed, as an offer or solicitation of services or products or an endorsement thereof in any jurisdiction or in any circumstancethat is otherwise unlawful or unauthorized. The investment products and services mentioned here are not insured by the FDIC (or any other stateor federal agency), are not deposits of or guaranteed by any bank and may lose value. This material is not intended as an offer to sell or a solicitation of an offer to buy any security, and it is not provided as a sales or advertisingcommunication and does not constitute investment advice. MBSC Securities Corporation, a registered broker-dealer, FINRA member and wholly ownedsubsidiary of BNY Mellon, has entered into agreements to offer securities in the U.S. on behalf of certain BNY Mellon Investment Management firms. Securities in Canada are offered through BNY Mellon Asset Management Canada Ltd., registered as a Portfolio Manager and Exempt Market Dealer in allprovinces and territories of Canada, and as an Investment Fund Manager and Commodity Trading Manager in Ontario. The value of investments and the income from them is not guaranteed and can fall as well as rise due to stock market and currency movements. Whenyou sell your investment you may get back less than you originally invested. Rankings include assets managed by BNY Mellon’s investment boutiques and BNY Mellon Wealth Management. Each ranking may not include the samemix of firms. Alcentra Limited, Insight Investment Management Limited, Newton Capital Management Limited, Newton Investment Management Limited and WalterScott & Partners Limited are authorized and regulated by the Financial Conduct Authority. The registered address for Alcentra Limited is 10 GreshamStreet, London, EC2V7JD, England. The registered address for Insight Investment and Newton is BNY Mellon Centre, 160 Queen Victoria Street, London,EC4V 4LA, England. The registered address for Walter Scott is One Charlotte Square, Edinburgh, EH2 4DR, Scotland. The Alcentra Group refers to the affiliated companies Alcentra, Ltd. and Alcentra NY, LLC. AUM includes assets managed by both companies. BNY Mellon Cash Investment Strategies (CIS) is a division of The Dreyfus Corporation.128
Disclosures Insight Investment Management Limited and Meriten Investment Management GmbH do not offer services in the U.S. This presentation does not constitutean offer to sell, or a solicitation of an offer to purchase, any of the firms’ services or funds to any U.S. investor, or where otherwise unlawful. BNY Mellon owns 90% of The Boston Company Asset Management, LLC and the remainder is owned by employees of the firm. BNY Mellon owns a 19.9% minority interest in The Hamon Investment Group Pte Limited, the parent company of Blackfriars Asset Management Limited andHamon Asian Advisors Limited which both offer investment services in the U.S. Insight investment's assets under management are represented by the value of cash securities and other economic exposure managed for clients. Servicesoffered in the U.S., Canada and Australia by Pareto Investment Management Limited under the Insight Pareto brand. Meriten Investment Management GmbH does not offer services in the U.S It was formerly known as WestLB Mellon Asset Management KAG mbH. The Newton Group (“Newton”) is comprised of the following affiliated companies: Newton Investment Management Limited, Newton Capital ManagementLimited (NCM Ltd) and Newton Capital Management LLC (NCM LLC). NCM LLC personnel are supervised persons of NCM Ltd and NCM LLC does notprovide investment advice, all of which is conducted by NCM Ltd. Only NCM LLC and NCM Ltd offer services in the U.S. AUM for the Newton Group includeassets managed by all of these companies (except NCM LLC). BNY Mellon owns a 20% interest in Siguler Guff & Company, LP and certain related entities (including Siguler Guff Advisers, LLC). Securities transactions are effected, where required, only through registered broker-dealers. Pershing is the umbrella name for Pershing LLC (memberFINRA, SIPC and NYSE), Pershing Advisor Solutions (member FINRA and SIPC), Pershing Prime Services (a service of Pershing LLC), Pershing Limited(UK), Pershing Securities Limited, Pershing Securities International Limited (Ireland), Pershing (Channel Islands) Limited, Pershing Securities Canada Limited,Pershing Securities Singapore Private Limited and Pershing Securities Australia Pty. Ltd. SIPC protects securities in customer accounts of its members up to 500,000 in securities (including 250,000 for claims for cash). Explanatory brochure available upon request or at www.sipc.org. SIPC does not protectagainst loss due to market fluctuation. SIPC protection is not the same as, and should not be confused with, FDIC insurance. Investment products (other thandeposit products) referenced in this brochure (including money market funds) are not insured by the FDIC (or any other state or federal agency), are notdeposits of or guaranteed by BNY Mellon or any bank or non-bank subsidiary thereof, and are subject to investment risk, including the loss of principal amountinvested.129
Less: Distribution and servicing expense 429 . 430 : Money market fee waivers benefiting distribution and servicing expense . 148 147 : 151 : Add: Money market fee waivers impacting total revenue 255 . 276 : Total revenue net of distribution and servicing expense and excluding money market fee waivers - Non-GAAP 3,078 . 3,607 : 3,765