Transcription
Cambridge International AS Level*0123456789*ENVIRONMENTAL MANAGEMENT Paper 1 Principles of Environmental Management 8291/01For examination from 20221 hour 45 minutesSPECIMEN PAPER You must answer on the question paper.No additional materials are needed.INSTRUCTIONS Section A: answer all questions. Section B: answer one question. Use a black or dark blue pen. You may use an HB pencil for any diagrams or graphs. Write your name, centre number and candidate number in the boxes at the top of the page. Write your answer to each question in the space provided. Do not use an erasable pen or correction fluid. Do not write on any bar codes. You may use a calculator. You should show all your working and use appropriate units.INFORMATION The total mark for this paper is 80. The number of marks for each question or part question is shown in brackets [ ].This document has 22 pages. Blank pages are indicated. UCLES 2019 [Turn over
2Section AAnswer all questions in this section.1(a) Italy is a high-income economy country (HIC) in Europe and Bangladesh is a low-incomeeconomy country (LIC) in Asia.Table 1.1 shows population data for Italy and Bangladesh in 1990 and 2010.Table 1.1countryarea / km2population1990Bangladesh147 630105 983 136Italy301 34057 007 577(i)populationdensity1990 /people km–2189.2population2010populationdensity2010 /people km–2percentageincrease inpopulationdensity151 616 7771027.043.159 588 066197.7Calculate the population density of Bangladesh in 1990.Give the answer to 1 decimal place.population density 1990 . people km–2 [2](ii)Calculate the percentage increase in population density for Italy.Give the answer to 3 significant figures.percentage increase .% [2](iii)Suggest how social factors can cause the changes in population density in Bangladeshand Italy. Refer to the data in your answer.[4] UCLES 20198291/01/SP/22
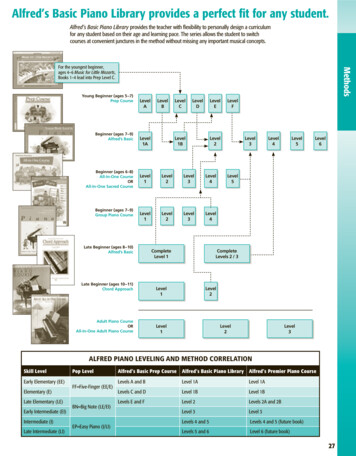
3(b) Fig. 1.1 shows two population pyramids representing the percentage of the population indifferent age groups in Italy in 1950 and 2010.1950maleagegroup2010female80 75 – 7970 – 7465 – 6960 – 6455 – 5950 – 5445 – 4940 – 4435 – 3930 – 3425 – 2920 – 2415 – 1910 – 145–90–48agegroup6 4 2 0 2 4 6 8percentage of the population100 95 – 9990 – 9485 – 8980 – 8475 – 7970 – 7465 – 6960 – 6455 – 5950 – 5445 – 4940 – 4435 – 3930 – 3425 – 2920 – 2415 – 1910 – 145–90–48malefemale6 4 2 0 2 4 6 8percentage of the populationFig. 1.1(i)Describe the changes in population distribution using data from Fig. 1.1. [2](ii)Describe the impacts that the changes in (i) could cause. UCLES 2019. [3][Total: 13]8291/01/SP/22[Turn over
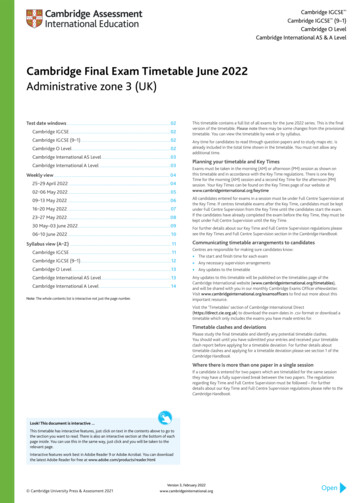
42Approximately one third of all food produced for human consumption is wasted.In many low-income economy countries (LICs) food wastage occurs when food is stored.Fig. 2.1 is a news report on a method for farmers to reduce food waste in Uganda, an LIC in Africa.Some farmers in Uganda are using a new device that dries fruit and vegetables quickly.The dried fruit and vegetables can last for months instead of days. The device runs onorganic garden waste, meaning farmers who cannot access electricity are able to use it.Traditional open-sun-drying does not work well during the rainy season and is much slower.The new device has a catalytic converter that prevents harmful gases from being releasedinto the atmosphere during the drying process.One farmer said, ‘We sell dried produce for four times the price of the fresh produce, anduse the profits to improve our farms.’Fig. 2.1(a) Explain how the device described in Fig. 2.1 provides a sustainable method of food productionin Uganda. [4] UCLES 20198291/01/SP/22
5(b) Fig. 2.2 shows how some companies in Europe plan the management of their food waste.reducefeed people in needfeed livestockcompostrenewableenergydisposalFig. 2.2One benefit of this food waste management strategy is that it provides food for people inneed.Explain two other benefits of this management strategy.1 .2 . [4] UCLES 20198291/01/SP/22[Turn over
6(c) Food wastage is one reason why there is a global shortage of food.State two other reasons.1 .2 . [2] UCLES 2019[Total: 10]8291/01/SP/22
73(a) (i)Countries need long-term and short-term energy security.Define:long-term energy security .short-term energy security . [2](ii)Energy insecurity impacts low-income economy countries (LICs).Outline four of these impacts. [4] UCLES 20198291/01/SP/22[Turn over
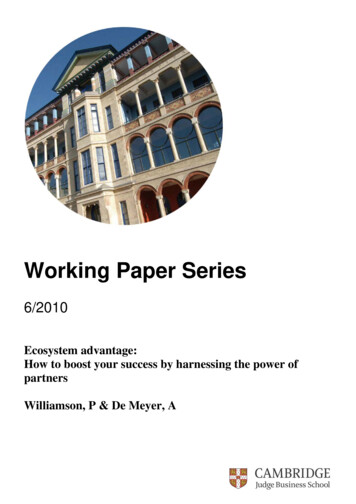
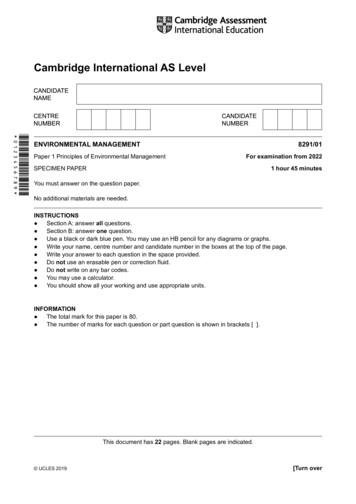
8(b) Fig. 3.1 shows the location of hydroelectric projects in country Y and country Z.A new dam is planned in country X to meet the increasing energy demands of the country.Country X is a low-income economy country (LIC). Currently, only 22% of the population ofcountry X has access to electricity.NYZsea500kmKeyplanned damexisting damrivercoastinternational boundaryflow direction of riverX / Y / Z countryFig. 3.1 UCLES 20198291/01/SP/22X
9Explain the impacts the new dam could have on the economies of countries X, Y and Z.Include positive and negative impacts in your answer. [6] UCLES 2019[Total: 12]8291/01/SP/22[Turn over
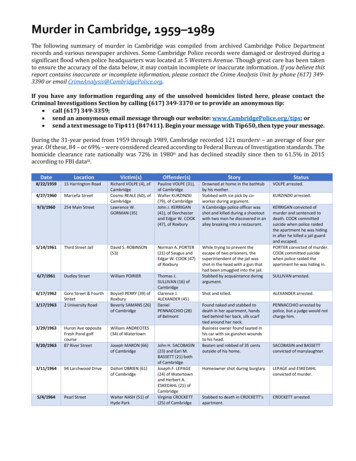
104(a) Fig. 4.1 is a food web that shows some feeding relationships in a rainforest.eaglesnaketigermonkeyparrotratavocado treedeerbanana palmbrazil nut treeFig. 4.1(i)Label the pyramid of biomass using an organism from each trophic level in a food chainwithin this food web.Pyramid of biomass [2](ii)Explain the shape of the pyramid of biomass shown in (a)(i). [3] UCLES 20198291/01/SP/22
11(b) Table 4.1 shows data on productivity.Table 4.1type of landaverage annualnet primaryproductivity / g m–2tropical rainforest2200agricultural(i)650Tropical rainforest is an example of an ecosystem.Define ecosystem productivity. [1](ii)Suggest one reason why the productivity of the agricultural land is much smaller thanthe tropical rainforest. [1] UCLES 20198291/01/SP/22[Turn over
12(c) A student visits a farm within an area of tropical rainforest. The farm grows a variety of plants.Fig. 4.2 shows the student’s annotated sketch of the farm.Two km2 of farmland within ten km2 of rainforestnative birdsand monkeyslive in canopyvanilla vineon host treefarming techniquesinclude composting,adding manure,crop rotations andtree plantingsheep, goats,cows and chickensfarmed within therainforestcrops such ascinnamon, cocoaplants and medicinalplants planted betweenlarger treesFig. 4.2 UCLES 201940 mfruit trees8291/01/SP/22the majority ofexisting treesremain, with farmingoccurring in availablespace
13(i)Explain how the farming strategies in Fig. 4.2 manage the impacts of farming in thistropical rainforest. [6](ii)The student noticed that some of the large trees on the farm have dense, broad leavesthat shade the forest floor.Very few plants grow under these trees.Explain why. [3] UCLES 2019[Total: 16]8291/01/SP/22[Turn over
145Ozone (O3) is a gas found in the stratosphere. Ozone depletion is caused by chlorofluorocarbons(CFCs).(a) Outline how ozone depletion occurs. [4](b) In the 1970s, scientists Rowland and Molina proposed this main hypothesis:‘CFCs will cause significant ozone depletion.’Explain why this hypothesis was not initially accepted by the scientific community. [1](c) State two impacts of ozone depletion.1 .2 . [2] UCLES 20198291/01/SP/22
15(d) The use of CFCs has been banned in many countries. Some alternative substances to CFCsare greenhouse gases.Outline two possible problems when new laws on managing atmospheric pollution areintroduced.1 .2 . [2] UCLES 2019[Total: 9]8291/01/SP/22[Turn over
16Section BAnswer one questionEITHER6‘National parks are an effective method of conserving biodiversity.’To what extent do you agree with this statement?Give reasons and include information from relevant examples to support your answer. [20]OR7Evaluate the success of strategies to manage water security in a location of your choice.Give reasons and include information from relevant examples to support your answer. [20]. UCLES 20198291/01/SP/22
17.
8 LES 2019 829101SP22 (b)Fig. 3.1 shows the location of hydroelectric projects in country Y and country Z. A new dam is planned in country X to meet the increasing energy demands of the country. Country X is a low-income economy country (LIC). Currently, only 22% of the population of country X has access to electricity. N km 0 sea Z X / Y / Z Y X 50 Key planned dam .