Transcription
Emetrics 2007, Washington DCPractical Guide to Controlled Experimentson the Web:Listen to Your Customers not to the HiPPORonny Kohavi, GM of Experimentation Platform, MicrosoftBased on KDD 2007 paper and IEEE Computer paper with members of ExP team.Papers available at http://exp-platform.com
2Amazon Shopping Cart Recs Add an item to your shopping cart at a website Most sites show the cart At Amazon, Greg Linden had the idea ofshowing recommendations based on cart itemsEvaluation Pro: cross-sell more items (increase average basket size) Con: distract people from checking out (reduce conversion) HiPPO (Highest Paid Person’s Opinion) was:stop the projectSimple experiment was run,wildly successfulFrom Greg Linden’s Blog: hopping-cart.html
3Overview Controlled Experiments in one slideLots of motivating examples All real and statistically significant Some (but not all) ran with our Experimentation Platform OEC – Overall Evaluation Criterion It’s about the culture, not the technology Controlled Experiments: deeper dive Advantages & Limitations Lessons Microsoft’s Experimentation Platform
Controlled Experiments Multiple names to same concept A/B tests or Control/Treatment Randomized Experimental Design Controlled experiments Split testing Parallel flights Concept is trivial Randomly split traffic between two versionso A/Control: usually current live versiono B/Treatment: new idea (or multiple) Collect metrics of interest, analyze(statistical tests, data mining)4
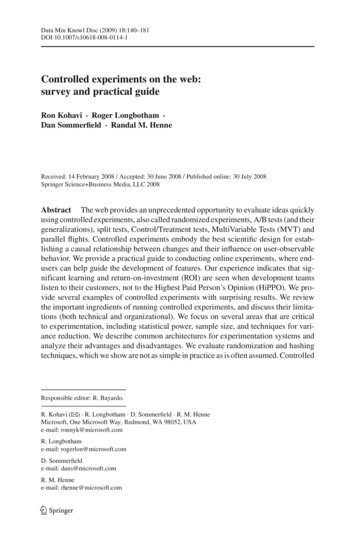
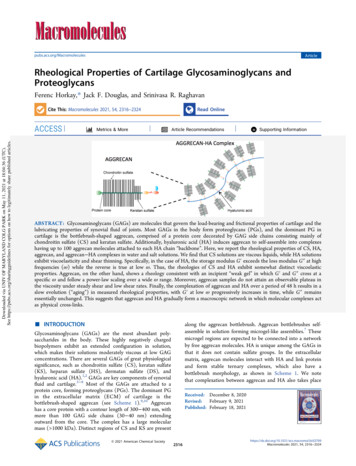
Marketplace: Solitaire v PokerThis experiment ran in Windows Marketplace / Game DownloadsWhich image has the higher clickthrough? By how much?A: Solitaire gamein hero positionB: Poker gamein hero positionA is 61% better
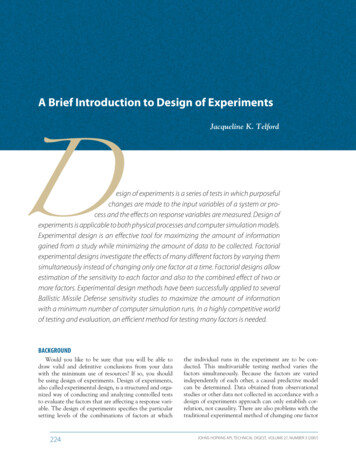
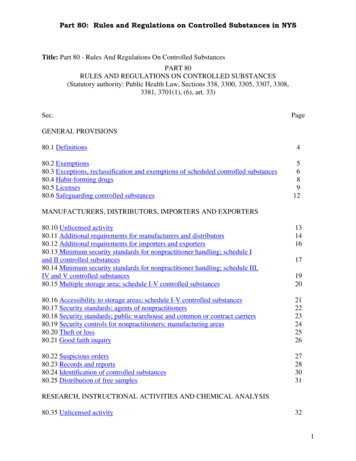
6Office Online FeedbackABFeedback A puts everything together, whereasfeedback B is two-stage: question follows rating.Feedback A just has 5 stars, whereas B annotates thestars with “Not helpful” to “Very helpful” and makesthem lighterWhich one has a higher response rate? By how much?B gets more than double the response rate!
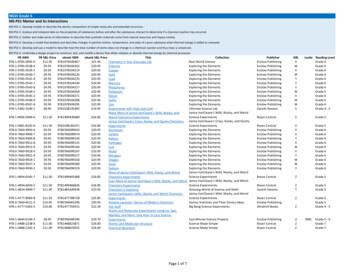
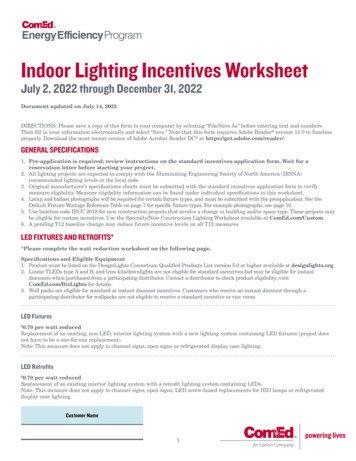
7Another Feedback VariantCCall this variant C. Like B, also two stage.Which one has a higher response rate, B or C?C outperforms B by a factor of 3.5 !!
MSN US Home PageProposal: New Offers module below ShoppingControlTreatment
MSN US Home Page Experiment Offers module eval Pro: significant ad revenue Con: do more ads degrade the user experience? How do we trade the two off?Last month, we ran an A/B test for 12 days on 5% ofthe MSN US home page visitors
Experiment Results Clickthrough rate (CTR) decreased 0.49% (p-value 0.0001)Small change, but highly significantPage views per user-day decreased 0.35% (p-value 0.0001)Value of click from home page: X centsAgreeing on this value is the hardest problem Method 1: estimated value of “session” at destination Method 2: what would the SEM cost be to generate “lost” trafficNet Expected Revenue –direct lost clicks –lost clicks due to decreased page viewsNet was negative, so the offers module did not launch10
Typography ExperimentColor Contrast on MSN Live SearchA: Softer colorsB: High contrastB: Queries/User up 0.9%Ad clicks/user up 3.1%
12Performance Impact on Search Performance matters a lotExperiment slowed search results page by 1second Queries/User declined 1.0% Ad Clicks/User declined 1.5% Slowed page by 2 seconds Queries/User declined 2.5% Ad Clicks/User declined 4.4%
13The OEC If you remember one thing from this talk,remember this pointOEC Overall Evaluation Criterion Agree early on what you are optimizing Experiments with clear objectives are the most useful Suggestion: optimize for customer lifetime value, notimmediate short-term revenue Criterion could be weighted sum of factors, such aso Time on site (per time period, say week or month)o Visit frequency Report many other metrics for diagnostics, i.e., to understandthe why the OEC changed and raise new hypotheses
14OEC Thought Experiment Tiger Woods comes to you for advice on howto spend his time: improving golf, or improvingad revenue (most revenue comes from ads)Short term, he could improve his ad revenueby focusing on ads :But to optimize lifetime financial value(and immortality as a great golf player),he needs to focus on the game
15OEC Thought Experiment (II) While the example seems obvious,organizations commonly make the mistake offocusing on the short termExample: Sites show too many irrelevant ads Groups are afraid to experiment because the new idea mightbe worse[but it’s a very short term experiment, and if the new idea isgood, it’s there for the long term]
16The Cultural ChallengeIt is difficult to get a man to understand somethingwhen his salary depends upon his not understanding it.-- Upton Sinclair Getting orgs to adopt controlled experimentsas a key developmental methodology, is hard Some believe it threatens their job as decision makers At Microsoft, program managers select the next set offeatures to develop. Proposing several alternatives andadmitting you don’t know which is best is hard Editors and designers get paid to select a great design Failures of ideas may hurt image and professional standing.It’s easier to declare success when the feature launchesRonny Kohavi
17Experimentation: the Value Data Trumps Intuition It is humbling to see how often we are wrong at predicting themagnitude of improvement in experiments (most are flat,meaning no statistically significant improvement) Every new feature is built because someone thinks it is a greatidea worth implementing (and convinces others) Encourage Experimentation Learn from flat/negative results. Even if an idea failed toimprove the OEC, the org learned something Deploy the positive experiments: only their sum really matters To innovate, experiment often. As Thomas Edison said:To have a great idea, have a lot of themRonny Kohavi
18Stress HiPPOThe less data, the stronger the opinions To help the cultural shift, we created the stress-HiPPOWhenever you feel stressed that a decision is madewithout data, squeeze the Stress-HiPPO You can pick one up after the talk
19Overview Controlled Experiments in one slideLots of motivating examples All real and statistically significant Some (but not all) ran with our Experimentation Platform OEC – Overall Evaluation Criterion It’s about the culture, not the technology Controlled Experiments: deeper dive Advantages & Limitations Lessons Microsoft’s Experimentation Platform
20Advantages of Controlled Experiments Controlled experiments test for causalrelationships, not simply correlations(example next slide)They insulate external factors History/seasonality impact both A and B in the same way They are the standard in FDA drug testsThey have problems that must be recognized
21Typical Discovery With data mining, we find patterns, but mostare correlationalHere is one a real example of two highlycorrelated variables
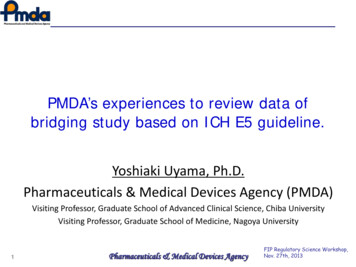
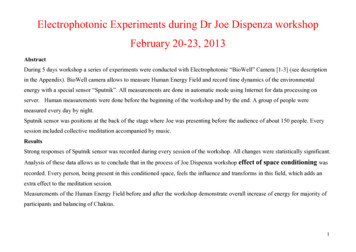
22Correlations are not Necessarily Causal City of Oldenburg, Germany X-axis: stork population Y-axis: human populationWhat your mother told you about babieswhen you were three is still not right,despite the strong correlational “evidence” Example 2:True statement (but not well known):Palm size correlates with your lifeexpectancyThe larger your palm, the less you will live,on average.Try it out - look at your neighbors andyou’ll see who is expected to live longer.Ornitholigische Monatsberichte 1936;44(2)Why?Women have smaller palms andlive 6 years longer on average
23Issues with Controlled Experiments (1 of 2)If you don't know where you are going, any road will take you there—Lewis Carroll Org has to agree on OEC (Overall EvaluationCriterion).This is hard, but it provides a clear direction and alignment Quantitative metrics, not always explanations of “why” A treatment may lose because page-load time is slower.Example: Google surveys indicated users want more results per page.They increased it to 30 and traffic dropped by 20%.Reason: page generation time went up from 0.4 to 0.9 seconds A treatment may have JavaScript that fails on certain browsers, causingusers to abandon.
24Issues with Controlled Experiments (2 of 2) Primacy effect Changing navigation in a website may degrade the customer experience(temporarily), even if the new navigation is better Evaluation may need to focus on new users, or run for a long period Multiple experiments Even though the methodology shields an experiment from other changes,statistical variance increases making it harder to get significant results.There can also be strong interactions (rarer than most people think) Consistency/contamination On the web, assignment is usually cookie-based, but people may usemultiple computers, erase cookies, etc. Typically a small issue Launch events / media announcements sometimespreclude controlled experiments The journalists need to be shown the “new” version
25Lesson: Drill Down The OEC determines whether to launch thenew treatmentIf the experiment is “flat” or negative, drilldown Look at many metrics Slice and dice by segments (e.g., browser, country)
Lesson: Compute Statistical Significanceand run A/A Tests A very common mistake is to declare a winner whenthe difference could be due to random variationsAlways run A/A tests(similar to an A/B test, but besides splitting the population, thereis no difference) Compute 95% confidence intervals on the metrics todetermine if the difference is due to chance or whetherit is statistically significantIncrease percentage if you do multiple tests(e.g., use 99%)Idea: run an A/A test in concurrent to your A/B test tomake sure the overall system doesn’t declare it assignificant more than 5% of the time (great QA)26
27Run Experiments at 50/50% Novice experimenters run 1% experimentsTo detect an effect, you need to expose acertain number of users to the treatment(based on power calculations)Fastest way to achieve that exposure is to runequal-probability variants (e.g., 50/50% for A/B)But don’t start an experiment at 50/50% fromthe beginning: that’s too much risk.Ramp-up over a short period
28Ramp-up and Auto-Abort Ramp-up Start an experiment at 0.1% Do some simple analyses to make sure no egregious problems can bedetected Ramp-up to a larger percentage, and repeat until 50% Big differences are easy to detect because the minsample size is quadratic in the effect we want to detect Detecting 10% difference requires a small sample and serious problemscan be detected during ramp-up Detecting 0.1% requires a population 100 2 10,000 times bigger Automatically abort the experiment if treatment issignificantly worse on OEC or other key metrics (e.g.,time to generate page)
29Randomization Good randomization is critical.It’s unbelievable what mistakes devs will make in favorof efficiency Properties of user assignment Consistent assignment. User should see the same variant onsuccessive visits Independent assignment. Assignment to one experimentshould have no effect on assignment to others (e.g., EricPeterson’s code in his book gets this wrong) Monotonic ramp-up. As experiments are ramped-up to largerpercentages, users who were exposed to treatments must stayin those treatments (population from control shifts)
30Controversial Lessons Run concurrent univariate experiments Vendors make you think that MVTs and Fractional Factorial designs arecritical---they are not. The same claim can be made that polynomialmodels are better than linear models: true in theory, less useful in practice Let teams launch multiple experiments when they are ready, and do theanalysis to detect and model interactions when relevant (less often thanyou think) Backend integration (server-side) is a better long-termapproach to integrate experimentation than Javascipt Javascript suffers from performance delays, especially when runningmultiple experiments Javascript is easy to kickoff, but harder to integrate with dynamic systems Hard to experiment with backend algorithms (e.g., recommendations)Ronny Kohavi
31Microsoft’s Experimentation PlatformMission: accelerate software innovationthrough trustworthy experimentation Build the platformChange the culture towards more data-drivendecisionsHave impact across multiple teams atMicrosoft , andLong term: Make platform available externally
Design Goals Tight integration with other systems (e.g., contentmanagement) allowing “codeless experiments”Accurate results in near real-time Trust is important Quickly detect and abort poorly performing experiments High-performance data pipeline with built-in data loss detection Minimal risk for experimenting applications Encourage bold innovations with reduced QA cycles Auto-abort catches bugs in experimental code Client library insulates app from platform bugs Experimentation should be easy Client library exposes simple interface Web UI enables self-service Service layer enables platform integration32
33Summary1.2.3.4.Listen to customers because ourintuition at assessing new ideas is poorReplace the HiPPO with an OECCompute the statistics carefullyExperiment oftenTriple your experiment rate and you triple your success (andfailure) rate. Fail fast & often in order to succeed5.Create a trustworthy system toaccelerate innovation by lowering thecost of running experiments
34http://exp-platform.comAccelerating software Innovation throughtrustworthy experimentation
Experiment Results 10 Clickthrough rate (CTR) decreased 0.49% (p-value 0.0001) Small change, but highly significant Page views per user-day decreased 0.35% (p-value 0.0001) Value of click from home page: X cents Agreeing on this value is the hardest problem Method 1: estimated value of "session" at destination Method 2: what would the SEM cost be to generate "lost" traffic