Transcription
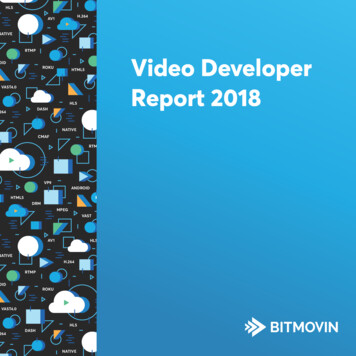
HLSH.264AV1NATIVERTMPOIDROKUVideo DeveloperReport 0264HLSDASHNATIVE
Welcome to the 2018Video Developer Report!First and foremost, I’d like to thank everyone for making the 2018 VideoDeveloper Report possible! In its second year the report is wider both inscope and reach.With 456 survey submissions from over 67 countries, the report aims toprovide a snapshot into the state of video technology in 2018, as well as avision into what will be important in the next 12 months.This report would not be possible without the great support and participationof the video developer community. Thank you for your dedication to figuringit out. To making streaming video work despite the challenges of limitedbandwidth and a fragmented consumer device landscape.We hope this report provides you with insights into what your peers areworking on and the pain points that we are all experiencing. We havealready learned a lot and are looking forward to the 2019 Video DeveloperSurvey a year from now!Stefan LedererBest Regards,Stefan LedererCEO, BitmovinPage 1
Key findingsIn 2018 H.264/AVC dominates video codec usage globally, used by 92% of developers in thesurvey. However, H.265/ HEVC has expanded rapidly, up from less than a third (28%) in 2017.AV1 is poised to accelerate, with double the planned usage rate since 2017, to 29% globally.Apple HLS and MPEG-DASH remain the dominant streaming formats in 2018 with over half ofdevelopers surveyed embracing MPEG-DASH and over 3/4 embracing HLS.Software is the most popular and fastest growing choice for video encoders, but hardwareencoders continue to hold steady, declining just 3 points in the last year.HTML5 is by far the most widely used format for video and audio delivery, with 87% of providersusing it today.62% and 60% of developers are leveraging native playback on Apple iOS and Android platformsrespectively.Chromecast is the current leader in TV-connected OTT streaming devices, used by 42% of surveyrespondents compared to 36% for Apple TV, 34% for Android TV and 23% for Roku.50% of respondents report that achieving playback on all devices is one of the biggest problemin video technology, almost exactly the same percentage (49%) as in last year’s survey.DRM use is increasing dramatically, only 36% of developers in 2018 report not using any contentprotection, compared to 65% in 2017.Client side ad insertion is still the most popular choice of advertising architecture but the gapwith server side ad insertion is closing - currently at 52% vs 44% respectively.Broadcast delay (latency) is the biggest problem for video developers in 2018, identified by overhalf of respondents (55%) globally, and almost three quarters of responents in LATAM (74%).
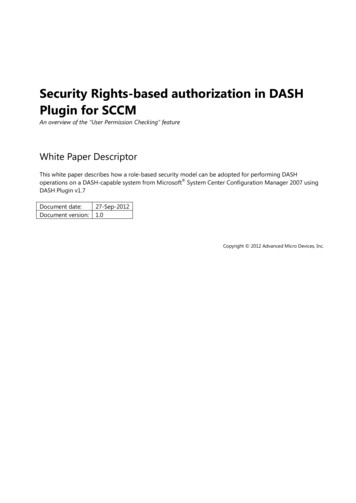
Q1. Streaming Formats(%) shown mark changes from 2017 video developer report.100%82%( 4%)80%61%( 5%)40%33%27%23%( 1%)9%20%(-4%)(-2%)(-3%)10%( EG-DASHMHLS0%Which streaming formats are youusing currently?In 2018 Apple’s HTTP Live Streaming (HLS) continues toshowing that the older formats in OTT Video aren’tbe the industry work horse. This is a consistent patternexiting as quickly as expected, and a “simpler” videofrom 2017, whereas MPEG-DASH and CMAF have alsotechnology landscape is still beyond the horizon.gained developer support, perhaps indicating widerProgressive Streaming (non adaptive video files) is stilladoption in the near future.used by almost a quarter of the participants, probablySurprisingly SmoothStreaming and Adobe HDS, both considered outdatedas a fallback for older browsers!formats, are still holding steady compared to 2017,Page 3Note: The questions in the survey are multiple choice, multiple answer, and therefore will not add up to 100%.60%
Q1. Streaming FormatsRegional variations in streaming formatsCompared to 2017, we see a significant increase inHLS is gaining in a big way and surprisingly, so is SmoothMPEG-DASH and MPEG-CMAF adoption in NorthStreaming. Overall, the streaming format distributionAmerica. While in APAC, HLS and MPEG-DASH havelooks relatively similar between the regions, perhapsgained at the expense of all other formats. In LATAM,with the exception of 4%83%77%100%80%EMEA95%North AmericaPage 4
Q2. Vide o 6%201720180%20172018H.264 / AVC20172018H.265 / HEVCVP9AV1Which video codecs are you using currently?In2018,theuseofH.265/HEVCincreasedand Android devices - maintains a similar level ofsignificantly, while H.264/AVC is still holding strong,usage. Like HEVC, it has more efficient compressionindicating developers are working with both codecsthan H.264, it can deliver better quality videos forsimultaneously. VP9 - the high-efficiency codec tothe same amount of data, or use less data whilereach browsers like Chrome, Firefox, Microsoft Edge,maintaining the same visual quality.Page 5
Q2. Video CodecsComparing the 2018 “12 months from now” predictionsefficiency and potential device reach will likely makeagainst the 12 month predictions in the 2017 report,it an appealing choice in the coming years.both HEVC and VP9 are dipping slightly, whichdoesn’t make a lot of sense, until you see the hugeDriven by engineering teams at browser makers andspike in planned AV1 adoption, more than doublingcontent distributors like Google, Mozilla, Microsoft,since . Already Firefox, Chrome and Edge WebAV1 was launched in March of 2018, as the royalty-browsers support AV1 in their early release versions,free codec from the Alliance for Open Media, whichwhich suggests commercial applications are justsome predict will take over as the codec of choice.around the corner. This explains the importance ofEndorsed by all major device manufacturers, browserAV1 for a lot of developers.vendors, and content distributors, the compressionWhich video codecs are you planning to use in 12 20172018H.265 / HEVC20172018VP920172018AV1Page 6
Q3. Where You 10%0%20172018HardwareEncoder20172018Software EncoderOn-Premise20172018Software EncoderCloud20172018Cloud EncodingService20172018ManagedOn-PremiseEncoding ServiceWhere do you encode video?The majority of the video developers in our survey,Overall the encoding infrastructure deploymentsreport using software encoders on local on-premiseappear fairly steady in overall compared to last year.machines. Hardware encoders, while slightly downWe see a slow trend to move away from hardwarefrom 2018, still remain very popular, especially forencoders towards cloud software and managedlive streaming use cases. However we expect thisservices, both cloud and on-premise. However, thenumber to keep going down slowly and steadily in theregional data on the following pages paints a verycoming years, as software encoders continue to gaindifferent picture!popularity thanks to their scalability, flexibility, andrapid deployment benefits.Page 7
North AmericaRegional variations in encoding are EncoderOn-Premise20172018Software EncoderCloud20172018Cloud EncodingService20172018ManagedOn-PremiseEncoding e EncoderOn-Premise20172018Software EncoderCloud20172018Cloud EncodingService20172018ManagedOn-PremiseEncoding Service
In 2018 we see a big pickup in cloud deploymentsthe on-premise software that’s taking a dip, bothof encoding software in North America and EMEA.indicating greater traction of video workflowInteresting that in North America the increasemovement towards the cloud.60%56%APACis at the expense of hardware, while in EMEA 20180%20172018HardwareEncoder20172018Software EncoderOn-Premise20172018Software EncoderCloud20172018Cloud EncodingServiceManagedOn-PremiseEncoding 72018Software EncoderOn-Premise20172018Software EncoderCloud20172018Cloud EncodingServiceManagedOn-PremiseEncoding Service
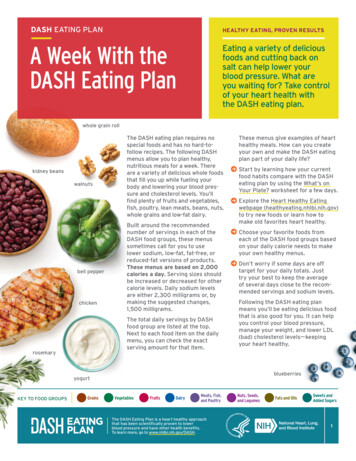
Q4. Audio Codecs(%) shown mark changes from 2017 video developer report.100%88%(-2%)80%60%43%( 1%)40%25%( 4%)18%( 5%)20%6%6%(-2%)9%( olDoligbyDitaligPlitalP3MAAC0%Which audio codecs do you use?In terms of audio formats, AAC continues to dominateprimarily used in premium use cases on set-top boxeswith 90% of respondents reporting using the codec.and TVs, where the user has the necessary audioNot surprisingly, there is very little change in audiohardware to appreciate the premium sound quality.codec adoption, although, we have included moreThe open source codecs - Vorbis, Opus and FLAC - aregranular options in the 2018 survey, to help us betternot widely used by the survey participants.understand the usage of the various premium codecs.Dolby Digital, Dolby Digital Plus and True HD arePage 10
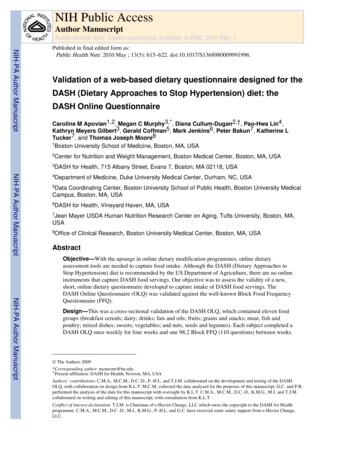
Q5. Player CodebaseWhat player codebase are you using?A new question for the 2018 survey, player codebasehave the resources to develop and maintain theadoption, shows that open source frameworks are morecodebase.popular worldwide. The second most popular solutionare the commercial players, offering the benefits of theIt is also interesting to note that the results show a total“outsourced maintenance” (SaaS model) and typically,of well over 100%, which hows that many developersa more robust feature set. Many commercial playerare working with two or more players from differentsolutions also offer native SDKs for mobile and set-topcodebases. This may be because many companies areboxes, which significantly simplify development andusing different players in different platforms, or it couldgenerally perform better than HTML5. Still, over 30%indicate that many are testing an alternative player inof respondents report having in-house built solutions,parallel with their production player.which offer the greatest flexibility for the teams that60%57%50%45%37%40%30%20%10%0%Open SourceCommercial SolutionIn-House SolutionPage 11
Q6. Regional Player DeploymentsNorth America80%74%EMEAAPACLATAM74%70%57%60%50%46% 48%47%40%45%34%37%30%33%29%32%20%10%0%Open SourceCommercial SolutionIn-House SolutionRegional variations in player deploymentsThe regional data breakdown reveals a surprisingacross EMEA, APAC and LATAM, North America hasnuance - while the distribution of open-source,decidedly fewer open-source deployments, in favor ofcommercial and in-house solutions look quite similarin-house solutions.Page 12
L5TMHiOS0%Which of the following platforms and devicesdo you use to stream video or audio content?HTML5 is clearly the technology of choice fornative capabilities of the devices, presumably duedesktop delivery and also has a significant footprintto the better performance of the native players.on mobile devices. This year we have expanded thethe set of categories to develop a deeper insightAs for OTT delivery, Chromecast dominates withinto target platforms and devices. The breakdown42% of the developers in the survey targeting theof HTML5 vs Native player technologies on mobilestreaming device, followed by Apple tvOS at 36%,devices shows very similar results across Androidand Roku and FireTV with less than a quarter ofand iOS platforms. The clear takeaway is thatrespondents reporting using these OTT platforms.mobile video delivery is a key focus for developersSmart TV’s are in the report for the first time, within 2018 and it is refreshing to see that in well overAndroidTV at double the adoption of LG’s webOS.half of the use cases, developers are leveraging
Google ChromecastQ7. Platforms & 017201831%30%20%10%0%2017Apple tvOSNorth 3%30%26%21%20%10%0%20172018North al variations in OTT adoptionThe survey data shows significant regional differencesRoku. Chromecast enjoyed single-digit gains with theamong the most popular OTT devices, includingdevelopers in North America, EMEA and LATAM, butGoogle Chromecast, Amazon Fire, Apple TV andno progress in APAC.Page 14
Q7. Platforms & Devicesmarket momentum, it is now the second most targetedAmazon FireTV and Roku have picked up in APACOTT device after Apple TV in North America andand North America regions. Reflecting Roku’s recentexperienced growth in APAC and EMEA as well.35%Amazon FireTVA similar pattern can be seen with AppleTV. 01720182017North orth America20172018EMEA20172018APAC20172018LATAMPage 15
Q7. Platforms & DevicesThe 2018 survey also asked which native mobile andBetween the two SmartTV platforms, Android TV isSmart TV platforms are being targeted by developers.strongest in APAC with 42% and weakest in LATAMNot surprisingly, iOS and Android were equally strongwith 26%, while WebOS (mostly LG products) wasacross all regions, each showing that approximatelyfairly evenly targeted across all regions at around 16%,60% of developers are using them. This is an interestingslightly lower in North America.insight into the strength of Apples hold on the market,despite losing out significantly in terms of the numberof 0%NORAMEMEAAPACLATAMNative %10%10%0%NORAMNative Page 16
Q8. DRM & Content Protection(%) shown mark changes from 2017 video developer -15%)30%25%18%20%11%15%( yPlMHneeviLSMFaiodrPullayareonNWidHLSAES1280%What DRM/content protectionsystems do you use?In 2018 we see the number of video developers NOTindividually, we see a slight decrease across the board,applying some form of content protection to theirapart from MPEG-CENC, which is a new option in thestreams decrease dramatically since last year. Downsurvey. Although we cannot refer to a hard number,from 65 percentage points to only 36, this changelast year’s “other” result was 10%, only 2% more thanstrongly suggests a trend towards premium, high valuethis year, so it follows logically that there is a growingcontent in OTT distribution. This could be driven bynumber of developers working with CENC.consumer demand for premium content “everywhere”.Despite this trend, when we look at each technologyPage 17
Q9. MonetizationWhat monetization model do you follow?Across the board, the percentages for monetizationvery common for online video distribution, especiallymodels are up from 2017, suggesting that manyamong broadcasters, digital publishers and socialcompanies are diversifying their revenue models tomedia companies that want to get their content inincorporate new income streams. This theory is furtherfront of a wide audience.supported by the increase in “hybrid” ad models.The online video deployments using subscriptionOne surprise is the aparently slow growth observedbased models are up 15 points. These generate theinmost predictable recurring revenue stream and areconsidering this model’s popularity with multichannela popular choice for OTT streaming services. Ad-video programming distibutors (MVPDs). This maysupported models have seen a similar increase amongbe explained by the fact that only 10% of the surveythe developers in the survey. The advertising model isrespondents are from Telco/Cable 8Ads / AVOD20172018Subscriptions / SVOD20172018Transactional / PPV20172018HybridPage 18
Q10. Advertising 17VMAP2018NoneOtherWhat type of ad standard & technologyare you using today?Nearly half of the video developers surveyed arethe most common way of serving ads in video, due tousing standardized advertising technologies in theirits simplicity and support by most ad-providers anddeployments, which is similar to 2017. However, greatervideo players.numbers are implementing the IAB standards. VAST isPage 19
Q11. Advertising de Ad Insertion (CSAI)Server-Side Ad Insertion (SSAI)Dynamic Ad ReplacementWhich ad architecture do you use?It is noteworthy that in 2018, just over 40% of thethe ads and the content. Dynamic Ad Replacement isdevelopers with ad requirements have a Server-Sideless common among the survey respondents today, butAd Insertion (SSAI) solution in place and a full quarterit’s a useful personalization tool that helps publishershave adopted Dynamic Ad Replacement solutions,make the most of their content on every platform, andwhich generally requires more complex workflows andwe anticipate its wider adoption in the near future.systems. SSAI is a useful tool for overcoming ad blockersas well as ensuring a consistent user experience betweenPage 20
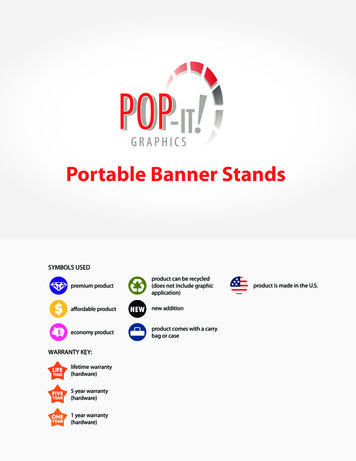
Q12. The Biggest Challenges(%) shown mark changes from 2017 video developer report.60%55%50%( 1%)50%36%40%( 9%)28%30%( 1%)22%20%19%( 1%)15%( 2%)(—)10%to ettiru ngnon plaal ybal d deAdsAdinInsertiongeneralkersocAd-BlDRM0%What are the biggest problems that you areexperiencing with video technology today?The most common problem was broadcast delay (alsoof the challenges associated with achieving playbackreferred to as latency), closely followed by “Gettingon all devices; while in most cases HTML5 significantlyplayback running to all devices”. Broadcast delaysimplifies online video, using the MSE/EME is definitelyaffects all streamers alike, and can be a sign of a widemore challenging than the legacy ecosystems, likerange of issues - from CDN and network performance,Flash or Silverlight. On top of this, video is consumedto encoding optimizations and player adaptation -on more and more different platforms, which all comethese can all masquerade as Latency.with their own special problems.Interestingly, it’s the trend towards using the 10-yearold HTML5 video tag that could be to blame for manyPage 21
Survey ParticipantsA survey is an aggregate of opinions expressed by79% of the participants come from technical roles, likeits participants. The Bitmovin Developer Survey hasdevelopers & product managers, 18.5% are in businessvoices from a wide variety of professionals working inroles and 2.5% in research.the the online video industry, from broadcasters andpublishers, to OTT streaming services and online videoFinally, the responses came in from 67 countries, acrossplatforms (OVPs).six continents - a truly global perspective on a globalindustry with a universal product. Video.Interestingly, there is an almost equal distributionbetween participants operating live and on-demandcontent, and many, obviously, work with both. NearlyTypes of streams - Live or VOD70% of respondents work with professional premiumcontent, representing industries from OTT Servicesand Broadcasters to Online Video Platforms and51.5%OnDemandIntegrators.Types of streams - Premium Content vs UGC48.5%Live31.3%User ge 22
By Industry9.9%Telco/Cable15%3.8%BroadcasterSocial Media6.2%Publisher21.7%Integrator24.9%OTT Service18.5%OVPBy Job Title1.9%Sales & .5%R&D6%Product10.6%Technical Manager15.5%Architect/ConsultantPage 23
2AV1NATIVECMAFROKUAbout BitmovinROKURTMPVAST4.0Bitmovin is a leading provider of video infrastructureVAST4.0for technology-forward media companies aroundVP9ANDROIDthe world. As a developer-focussed company,HTML5Bitmovin has been at the forefront of technologyDRMdevelopments in online video - from buildingMPEGVASTthe world’s first commercial adaptive streamingPlayer for DASH/HLS/fMP4, to implementing nextgeneration AV1 codec and deploying software- DASHDASHAV1defined encoding products that run simultaneouslyon any cloud provider or in a data-centre. WeHLSNNATIVEwork with companies in over 100 countries to buildH.264CMAFinnovative video products. Bitmovin solutions areCMAFRTMPcompletely in-house developed, highly customisableVP9VP9to fit with existing workflows and easy to vin.comHLSAV1H.264DASHAV1NATIVEH.2
Key findings In 2018 H.264/AVC dominates video codec usage globally, used by 92% of developers in the survey. However, H.265/ HEVC has expanded rapidly, up from less than a third (28%) in 2017. AV1 is poised to accelerate, with double the planned usage rate since 2017, to 29% globally. Apple HLS and MPEG-DASH remain the dominant streaming formats in 2018 with over half of