Transcription
FISCAL CONSOLIDATION IN TIMES OF CRISIS:IS THE SOONER REALLY THE BETTER?Christophe Blot*, Marion Cochard*, Jérôme Creel**, Bruno Ducoudré*,Danielle Schweisguth* and Xavier Timbeau** OFCE (Centre de recherche en économie de Sciences Po)** OFCE and ESCP EuropeRecent evidence has renewed views on the size of fiscal multipliers. It isnotably emphasized that fiscal multipliers are higher in times of crisis. Startingfrom this literature, we develop a simple and tractable model to deal with thefiscal strategy led by euro area countries. Constrained by fiscal rules and by speculative attacks in financial markets, euro area members have adopted restrictivefiscal policies despite strong negative output gaps. Based on the model, wepresent simulations to determine the path of public debt given the currentexpected consolidation. Our simulations suggest that despite strong austeritymeasures, not all countries would be able to reach the 60% debt-to-GDP. If fiscalmultipliers vary along the business cycle, this would give a strong case fordelaying austerity. This alternative scenario is considered. Our results show notonly that delaying austerity would improve growth perspectives and would notbe incompatible with public debt converging to 60% of GDP.Keywords: public debt, fiscal multipliers, growthBetween the late 1970s and the outbreak of the global financial crisis, many economists and policymakers denied fiscal policya role in stabilising output. After a long period of fiscal (orKeynesian) dominance in Western economies, until stagflationarose in the 1970s, monetary policy was finally considered as themost effective and flexible tool to dampen business cycle in thee-mail: christophe.blot@ofce.sciences-po.fr (corresponding author).Revue de l’OFCE / Debates and policies – 132 (2014)
160C. Blot, M. Cochard, J. Creel, B. Ducoudré, D. Schweisguth and X. Timbeaushort run while achieving price stability in the medium term.1Except under exceptional circumstances (the case of a liquiditytrap), the consensus seemed to be that fiscal multipliers were low(i.e. below unity). Some empirical papers even argued that expansionary fiscal consolidation might occur when fiscal restriction wasmainly based on expenditures cuts rather than on tax increases(Alesina and Perotti, 1996, Perotti 1996 or Afonso, 2010).2Although these views were partly reversed in 2009 when the financial turmoil led industrial countries in the deepest recession sincethe Great Depression, the Keynesian revival rapidly faded away.European countries reversed their fiscal policy stance in 2010-2011and engaged in fiscal contraction although output gaps were stillstrongly negative. Austerity measures were first implemented inSpain, Ireland and Greece. They followed the outbreak of the Greekcrisis and were fueled by fears of a possible sovereign default. Since2011, austerity has been generalised in most euro area countries. Asshown by De Grauwe and Ji (2013), austerity programmes werepartly driven and intensified by financial market pressures. Untilrecently, the economic models used by the European Commissionrelied on the Ricardian equivalence hypothesis assigning only aminor role to fiscal policy. Despite growing literature emphasizingthat fiscal multipliers may not be low, the European Commissionforecasts clearly illustrated the view that consolidation would notbe very costly or, if it were, only temporarily.3Besides, existing fiscal rules constrained the use of fiscal policy.The 3% of GDP deficit ceiling for public deficit was breached in2009 under what was deemed to be exceptional circumstances. Butin 2010, almost all euro area economies started to recover and theEuropean Commission decided to launch excessive deficit procedures. Consolidation was then endorsed by the EuropeanCommission and approved by the Council. Although early fears of1. See Allsopp and Vines (2005) or Angeriz and Arestis (2009) for a detailed description andcriticism of this “consensus”.2. This view was however debated notably by, e.g., Creel et al. (2005).3. Resorting to a narrative approach, IMF (2010) challenged the view that fiscal consolidationmight be expansionary and found multipliers significantly above unity. De Cos and MoralBenito (2013) argue that estimates of the real effects of pure fiscal contractions, whenendogeneity issues have been rigorously corrected for, point to negative figures. Finally,Christodoulakis (2013) reviews the real costs of fiscal contraction in Greece and pledges for aslowdown in fiscal retrenchment.
Fiscal consolidation in times of crisis: Is the sooner really the better?a possible double-dip were expressed (e.g. OFCE, 2011), thestrategy of synchronized front-loading austerity was amplified in2012 and 2013.The efficiency of such a strategy was debated. It regainedmomentum with new views on the size of fiscal multipliers andwas reinforced by disappointing performance of the euro area. Theliterature which has re-emerged since 2009 reached two mainconclusions:1. The multiplier is higher in “times of crisis” (in the short termor as long as the crisis lasts).4 “Times of crisis” mean periods ofhigh unemployment and/or wide output gap. Another symptommay be a situation where safe long-term interest rates are very low(i.e. negative in real terms), suggesting a flight to safety (radicaluncertainty) or a liquidity trap (expectations of deflation). Twotheoretical interpretations are consistent with these manifestationsof the crisis. Firstly, price expectations are moving toward deflation, or radical uncertainty makes it impossible to form anexpectation, which is consistent with very low safe interest ratesand leads to the paralysis of monetary policy. Or secondly, moreeconomic agents (households, firms) are subject to short-termliquidity constraints, perpetuating the recessionary spiral andpreventing monetary policy from functioning. In one case oranother, fiscal multipliers are higher than in normal times becausethe expansionary fiscal policy (resp. restrictive) forces theeconomic agents to take on debt (resp. shed debt) collectivelyinstead of individually.2. The multiplier is higher for expenditures than for taxes. Theargument in normal times is that higher taxes act as a disincentivewhereas spending cuts act as an incentive on labour supply. In asmall open economy, when monetary policy also induces realcurrency depreciation, fiscal contraction can increase activity, aresult advocated by supporters of fiscal discipline. But in times ofcrisis, in addition to the fact that multipliers are high, the logicapplicable in normal circumstances is reversed. The reluctant useof taxes, because of disincentive effects, and the preferred spendingcuts do not produce the expected effects in an economy with4. Parker (2011) recalls that this view dates back, at least, to Keynes “General theory” and hecalls it the “(old) Keynesian view”.161
162C. Blot, M. Cochard, J. Creel, B. Ducoudré, D. Schweisguth and X. Timbeauinvoluntary unemployment or overcapacity. It is in fact the expectations of a recession or of deflation that act as disincentives,which is another factor behind high multipliers.Starting from this literature, it clearly appears that front-loadedausterity can be an ill-designed strategy. The economic and socialcosts can indeed be very high. It logically calls for an alternativestrategy where it would be optimal to delay consolidation untileconomic growth has resumed. Implementing austerity measureswhen the output gap is close to zero may reduce consolidationcosts and may also mitigate the requirements for a negative fiscalstance since all or part of the deficit would be already reducedthanks to automatic stabilizers.The aim of this paper is first to assess the impact of fiscal consolidation on European economies. To this end, we present the resultsfrom simulations based on a simple reduced-form model representing 11 euro area countries (Austria, Belgium, Finland, France,Germany, Greece, Ireland, Italy, the Netherlands, Portugal andSpain). The model takes into account the most recent evidence onthe size of fiscal multipliers. We adopt a flexible approach wherethe fiscal multiplier varies according to the business cycle. Bydoing so, we do not only highlight the costs of implementingausterity when the output gap is negative but we also seek for alternative and less costly strategies to reduce public debt. We define asimple algorithm to search the optimal dynamic fiscal stance inorder to minimise the cost of austerity while seeking to reach a60% debt-to-GDP ratio in 2032, in accordance with existing fiscalrules in the euro area.The rest of the paper is organised as follows. In the first section,we review the literature on the fiscal multiplier. The main featuresof the model, which is used for simulations, are presented in thesecond section. The third section analyses the actual path ofconsolidation and shows that it is ill-designed. Finally, the fifthsection analyses and discusses the consequences of delaying fiscalcontraction.1. Fiscal multiplier in times of crisis: a short overviewDuring the Great Recession, most industrial countries haveimplemented fiscal stimulus packages aiming at stabilising the
Fiscal consolidation in times of crisis: Is the sooner really the better?business cycle. But the fiscal stance was then rapidly reversed withmost EMU countries rapidly engaging in a fiscal consolidationstrategy. Therefore, the instrument of fiscal policy has been usedintensively since the onset of the crisis. This naturally raises theissue of the efficiency of fiscal policy; hence, it questions the valueof fiscal multipliers which lay at the heart of the assessment of theoutput costs or benefits of consolidation.An abundant literature has recently discussed not only thevalue but also the stability of fiscal multipliers.5 Economists fromthe IMF (IMF, 2012; Blanchard and Leigh, 2013) recognized thattheir hypothesis on the value of fiscal multipliers were certainlyunderestimated, which explained why the economic forecastsduring the 2008 crisis often turned wrong. Their reassessmentshowed that fiscal multipliers have ranged from 0.9 to 1.7 since theGreat Recession. Having values above unity indicates clearly thatfiscal consolidation is costly. As a consequence, a gradual andsmooth fiscal consolidation process is certainly preferable to astrategy of fast and sharp reduction of public imbalances. The sizeof the fiscal multiplier appears a crucial issue in the currentcontext. Moreover, a recent literature has highlighted that this sizeis path-dependent, as well as instrument-dependent (see Parker,2011, for a survey of measurement issues and Michaillat, 2012, fora theoretical rationale).Corsetti, Meier and Müller (2012) explain that in “times ofcrisis” more and more economic agents (households, firms) aresubject to very short-term liquidity constraints, thus maintainingthe recessionary spiral and preventing monetary policy from functioning. The value of the multiplier may reach 2 in times of crisiswhereas it is supposed to be closer to 0.5 in normal times. Auerbach and Gorodnichenko (2012), corroborate the idea that themultipliers are higher in recessions than in periods of expansion.These authors argue that the impact of a shock on public expenditure would be 4 times higher when implemented during aneconomic downturn (2.5) than in an upturn (0.6). This result hasbeen confirmed for the US data by Fazzari et al. (2012) and byMittnik and Semmler (2012), but Owyang et al. (2013) do not findsuch evidence with a dataset encompassing the entire 20th5.Some parts of this literature review draw on Heyer (2012).163
164C. Blot, M. Cochard, J. Creel, B. Ducoudré, D. Schweisguth and X. Timbeaucentury.6 This non-linearity was also found with German data byBaum and Koester (2011) and conceptualized by Creel, Heyer andPlane (2011) in a simulated model drawing on French data. Karras(2013), studying a panel of 61 countries, both developed anddeveloping, between 1952 and 2007, concludes that the fiscalmultiplier is twice as large during downswings than expansions.The stance of monetary policy also matters. Hall (2009)concludes that the size of the multiplier doubles and is around 1.7when the real interest rate is close to zero (zero lower bound),which is characteristic of an economy undergoing a downturn, as isthe case today in many developed countries. This view is shared bya number of other researchers, including DeLong and Summers(2012), Erceg and Lindé (2012), OECD (2009), and Boussard et al.(2012). It was also highlighted in some recent theoretical work,notably by Carrillo and Poilly (2013), Christiano et al. (2011),Woodford (2011). When nominal interest rates are blocked at thezero lower bound, anticipated real interest rates rise. Monetarypolicy can no longer offset budgetary restrictions and can evenbecome restrictive, especially when price expectations are anchoredon deflation.Coenen et al. (2012) analyse the instrument-dependence of theeffectiveness of fiscal policy. On the basis of 8 different macroeconometric models (mainly DSGE models) for the United States, and4 models for the euro area, they show that the size of many multipliers is large, particularly if public expenditures and targetedtransfers are used. The multiplier effects exceed unity if thestrategy focuses on public consumption or transfers targeted tospecific agents and are larger than 1.5 for public investment. Forthe other instruments, the effects are still positive but range from0.2 for corporation tax to 0.7 for consumer taxes. This finding isalso shared by the European Commission (2012), which indicatesthat the fiscal multiplier is larger if fiscal consolidation is based onpublic expenditure, and in particular on public investment. Theseresults confirm those published about fiscal stimulus by theOECD (2009), Creel et al. (2009), Burriel et al. (2010), and Baumand Koester (2011). Without invalidating this result, a study byFazzari et al. (2012) nevertheless introduced a nuance: according to6.Owyang et al. (2013) find some above-unity fiscal multipliers only for Canada.
Fiscal consolidation in times of crisis: Is the sooner really the better?their work, the multiplier associated with public spending is muchhigher than that observed for taxes only when the economy is atthe bottom of the cycle. This result would be reversed if theeconomy were closer to full-employment.Furthermore, in their specific assessment of the US economy,Ilzetzki et al. (2013), highlight a high value for the fiscal multiplierfor public investment (1.7), i.e. higher than for public consumption.7 This is similar to the results of Freedman et al. (2009).In the recent literature, only a few papers seem to break theconsensus among economists on the size of fiscal multipliers. Forinstance, after examining 107 fiscal consolidation plans,conducted in 21 OECD countries over 1970-2007, Alesina andArdagna (2010) and Alesina et al. (2012) conclude, first, that themultipliers can be negative and, second, that fiscal consolidationsbased on expenditure are associated with minor, short-lived recessions, while consolidations based on taxation are associated withdeeper, more protracted recessions. These findings raise twocritiques. First, Alesina et al. (2012) usually emphasize rathersubstantially the experiences of fiscal restraint of some Scandinavian countries or Canada which are highly specific (planned entryinto the European monetary system and financial liberalisation inScandinavian countries, unexpected increases in oil and gasreceipts for Canada) and cannot be easily generalized. By the way,when these experiences are included within a larger datasetincluding all experiences of fiscal restriction (or expansion), nostrong results emerge. Second, the empirical work of Alesina et al.(2012) suffers from an endogeneity problem in the measurementof fiscal restraint. Once De Cos and Moral-Benito (2013) correct forthis problem, fiscal contractions give contractionary effects. Thenotion of a narrative record of fiscal impulse also helps to avoidthis endogeneity. For example, in the case of a real estate bubble(and more generally in cases of large capital gains), the additionaltax revenues from real estate transactions result in a reduction inthe structural deficit, as these revenues are not cyclically-based (theelasticity of revenues to GDP becomes much higher than 1). So7. Ilzetzki et al. (2013) also show, using VAR estimates performed with a dataset of 44countries, that the effectiveness of fiscal policy depends on the exchange rate regime, quiteconsistently with the properties derived from Mundell-Fleming models.165
166C. Blot, M. Cochard, J. Creel, B. Ducoudré, D. Schweisguth and X. Timbeauthese revenues are associated with an expansion (in conjunctionwith the housing bubble) and with a reduction in the structuraldeficit: thus, it strengthens artificially the argument that reducingthe public deficit may lead to an increase in activity, whereas thecausality is actually the reverse.Beyond Alesina et al.’s contributions, Corsetti et al. (2013a,2013b) have studied the incidence of public debt growth (andpossible sovereign defaults) on the fiscal multiplier. Through the“sovereign risk channel”, fiscal multipliers would tend to besmaller when sovereign risk (or public debt) is high than otherwise.8 Müller (2013) draws on this argument to oppose the selfdefeating approach that Gros and Maurer (2012) and Holland andPortes (2012) attributed to current European fiscal austerity. Deneset al. (2013) and Bi et al. (2013) rather oppose Corsetti et al.’sconclusions. The former attribute the effectiveness of fiscal policyto a clear management of public finances in the short, mediumand long run: the success of a fiscal stimulus is dependent on thepolicy regime and on the confidence by the public that a change inthe policy regime would lead the fiscal stance to change as well.The latter share a similar view, although they broaden the determinants of a successful fiscal consolidation to the public debt level, tofiscal consolidation duration, likelihood and composition.Apart from the contributions by Alesina, Corsetti and theircolleagues, a relatively broad consensus has emerged: a policy offiscal restraint is preferable in periods of expansion, but is ineffective and even pernicious when the economy is at a standstill; if sucha policy were to be enacted during a downturn, then tax increaseswould be less harmful to activity than public spending cuts.Taking these views into consideration is crucial to assess fiscalconsolidation episodes: The higher the value of the multiplier, thecostlier is fiscal consolidation. Such an assessment should rely on acareful analysis of the economic, financial and monetary context.Looking at the situation of euro area economies in 2012 certainlygives credit to the hypothesis of a high multiplier. Monetary policyrates have indeed rapidly decreased to the zero lower bound. Theunemployment rate has reached record levels in the euro area. For8. Using a dataset of EU-26 countries, Vranceanu and Besancenot (2013) find empirical resultsin line with Corsetti et al’s analysis.
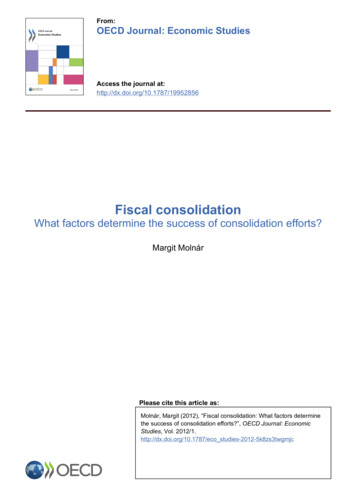
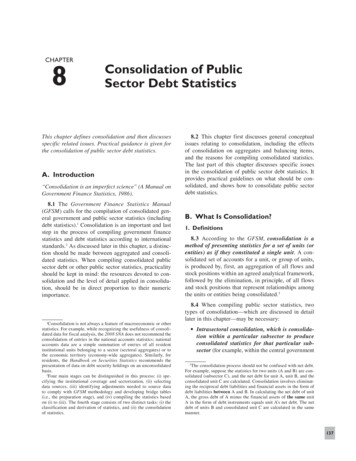
167Fiscal consolidation in times of crisis: Is the sooner really the better?all countries but Germany, it stands well above estimated NAIRUs.It is not always easy to disentangle between countries resorting toconsolidation based on expenditures cuts or tax increases. Finally,the synchronization of fiscal consolidation across countries mayalso certainly tend to raise the value of the multiplier.This hypothesis is confirmed when taking together 2011 and2012, years of very strong fiscal impulses. Figure 1 compares, onthe one hand, changes in the output gap from end 2010 to 2012(on the x-axis) and, on the other hand, the cumulative fiscalimpulse for 2011 and 2012 (y-axis), based on OECD EconomicOutlook data. We obtain the short-term impact of fiscal consolidation. Figure 1 depicts this relationship, showing a close linkbetween fiscal restraint and economic slowdown.Figure 1. Fiscal impulses 2011-2012 and changes in the output gaps5JPN-20-15-10BEL-5NLDESPITA FRAGBR00AUT5FINDEUUSAIRL-5PRTGRC-10-15Source: OECD, Economic Outlook 91, June 2012. The year 2012 is a projection (OFCE forecast October 2012). Thearea of the bubbles is proportional to real GDP in 2011 ( PPP).For most countries, the “apparent” multiplier is less than 1 (thelines connecting each of the bubbles are below the bisector, the“apparent” multiplier is the inverse of the slope of these lines).Figure 2 refines the assessment. The changes in the output gap arecorrected for the “autonomous” dynamic of the closing of theoutput gap (if there had been no impulse, there would have been a
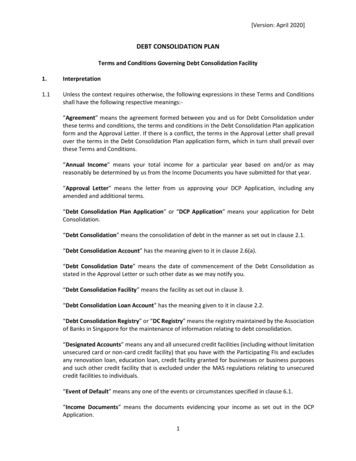
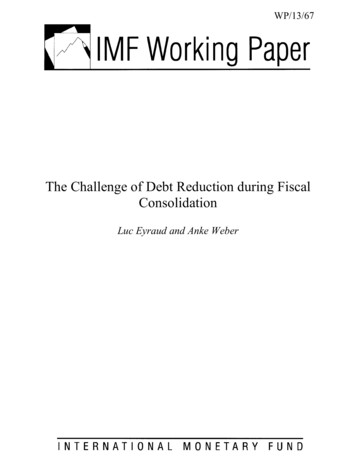
168C. Blot, M. Cochard, J. Creel, B. Ducoudré, D. Schweisguth and X. Timbeauclosing of the output gap, which is estimated as taking place at thesame rate as in the past) and for the impact of each country’sbudget cutbacks on the other partners through the channel offoreign trade. The bubbles in this chart therefore replace thebubbles in Figure 1, integrating these two opposing effects, whichare evaluated here while seeking to minimize the value of themultipliers. In particular, because the output gaps had never beenso large, it may be the case that they are closing faster than in thepast 30 or 40 years, which would justify a more dynamic counterfactual and therefore higher fiscal multipliers.Austria and Germany are exceptions. As these two countriesenjoy a more favourable economic situation (lower unemployment, better business conditions), it is not surprising that themultiplier is low there. Despite this, the “corrected apparent”multiplier is negative. This follows either from the paradoxicaleffects of the incentives, or more likely from the fact that monetarypolicy is more effective and that these two countries have escapedthe liquidity trap. But the correction provided here does not takeinto account any stimulus from monetary policy.In the United States, the “2011-2012 corrected apparent” multiplier reaches 1. This “corrected apparent” multiplier is very high inGreece ( 1.5), Spain ( 1.3) and Portugal ( 1.2). This suggests thatif the economic situation deteriorates further, the value of themultiplier may increase, exacerbating the vicious circle of austerity.For the euro area as a whole, the “corrected apparent” multiplier results from the aggregation of “small open economies”. It isthus higher than the multiplier in each country, because it relatesthe impact of fiscal policy in each country to the whole area andnot only to the country concerned. The aggregate multiplier forthe euro area also depends on the composition of the austeritypackages, and more especially on the countries where the measuresare being implemented. However, the biggest negative fiscalimpulses take place in areas where the multipliers are highest or inthe countries in deepest crisis. The result is that the aggregatemultiplier for the euro area is 1.3, significantly higher than themultiplier derived for the US.A comparison of the fiscal plans for 2011 and 2012 with theeconomic cycle in those years yields a high estimate for the fiscal
169Fiscal consolidation in times of crisis: Is the sooner really the better?multipliers. This confirms the dependence of the multiplier on thecycle and is a serious argument against the austerity approach.Figure 2. Fiscal impulse 2011-2012 and adjusted changes in the output gap5JAPJAP0-20-15-10BEL BEL0AUT AUTNLDFINNLDFIN DEUDEUUSAUSA-5ESPITAFRA FRAIRLESP ITA GBRGBRPRTGRC5IRL-5PRTGRC-10-15Source: OECD, Economic Outlook 91, June 2012. The year 2012 is a projection (OFCE forecast October 2012). Thearea of the bubbles is proportional to real GDP in 2011 ( PPP).2. Short description of the model and calibrationThe simulations are done with a macroeconomic model thatcombines structural and reduced-form non-linear equations. Anexhaustive presentation of the model and its calibration is available in the appendix of iAGS 2013 Report.9 It is a simple reducedform equation model to analyse complex supply and demandmechanisms that can be heterogeneous across countries. Incontrast with DSGE models which are linearised around a singleequilibrium, our model notably allows for variable fiscal multipliers over the business cycle. Indeed, the value of the fiscalmultiplier is endogenous and determined according to the size ofthe output gap. The parameters of the model are calibrated to allowthe analyses of various scenarios. It is far more tractable than DSGEmodels and given the current context, it may better capture the9.http://www.iags-project.org/documents/iags appendix2013.pdf.
170C. Blot, M. Cochard, J. Creel, B. Ducoudré, D. Schweisguth and X. Timbeaueffect of fiscal policy on the output gap. It does not rest on structural hypotheses regarding agents’ behaviour (representativerational agent), hypotheses which are today largely debated.10 Bythe way, it may be more consistent with recent empirical developments regarding the size of fiscal multipliers. It enables to reflectmore accurately the current economic situation which may bebetter described by a Keynesian environment. Yet, the model isalso sufficiently tractable to allow for alternative hypotheses. It iseasy to modify the parameters defining the fiscal multiplier and toaccount for New Classical hypotheses where fiscal policy has onlya limited impact on output. Hence, this kind of model is helpful toshed some lights on the effects of various economic policy shocksaccording to a given set of transparent hypotheses.The key features of the model are the following:— It allows for an explicit representation of the main euro areacountries: Austria, Belgium, Finland, France, Germany,Greece, Ireland, Italy, Netherlands, Portugal and Spain. Anaggregated euro area is also computed.— On the demand side, an open economy aggregate demandfunction is represented, with fiscal and monetary policy,external demand (a channel for intra EU interdependencies)as well as exogenous shocks on the output gap (the gapbetween actual and potential GDP). The equation is writtenas an error-correction model. It may also take into accountpossible long run effects of macroeconomic policies such aslong term fiscal policy, debt-related threshold effects andhysteresis on potential output. The stabilization of theeconomy stems from adjustments in the long-term interestrates and competitiveness, which have feedback effects onthe output gap. The stabilisation may then hinge on privatedemand (through interest rates adjustment and monetarypolicy) and on external demand (through the decrease inrelative prices). The calibration allows to simulate standardhypotheses as well as alternatives, checking the dependenceof results on different sets of hypotheses. Furthermore, thesize of fiscal multipliers is allowed to vary along the business10. These issues are notably discussed by Fagiolo and Roventini (2012).
Fiscal consolidation in times of crisis: Is the sooner really the better?cycle. The ineffectiveness of monetary policy is madepossible when the economy hits the zero lower bound (ZLB).— External demand is modelled using a bilateral trade matrixrepresenting interdependencies between countries. Thetrade matrix is also used as a basis for imbalances analysis.— We model prices by a generalized Phillips curve relatingcurrent and expected inflation to the output gap, importedinflation and other exogenous shocks. Expectations can bemodelled as adaptive (backward-looking) or rational(forward-looking).— A Taylor rule sums up monetary policy, except under thezero lower bound.— Changes in the short term monetary policy rate are thenpassed through the long-term interest rates. Hence,according to the expectations theory, the long-term interestrate for German public bonds is set equal to the expectedsum of future short term interest rates (Shiller, 1979), withshort-term interest rates set by the (European) central bank.The long-term public rate for Germany is considered riskfree, and long-term public rates for other countries include arisk premium that is set exogenously. We also temporarilyset exogenously the long-term rate for countries that enteredthe EFSF to account for a lower interest rate on debt refinancing. Finally, for each country the long-term interest rateon private bonds is equal to the public one plus a riskpremium that is set exogenously.— The stance of monetary policy remains expansionary as longas the euro area aggregate output gap is negative and if inflation is below the 2% target. In case of a negative idiosyncraticdemand shock, the convergence to the potential growth ratehinges partly on the effect of common expansionary monetary and on a competitiveness effect. Due to hysteresis effect,the output level may be permanently affected by a negativedemand shock. But trend growth will always converge to anexogenously set path. The hypothesis regarding long rungrowth rates are presented in table A1 in the appendix. — We call yc , the gap between the log of real GDP Y of countryc, and a baseline trajectory for the output growing at aconstant growth rate. A distinction is then made between171
172C. Blot, M. Cochard, J. Creel, B. Ducoudré, D. Schweisguth and X. Timbeaupotential GDP and this baseline. This gap is noted y*c . Then,yc is the output gap of country c, i.e. the difference between yc and y*c . The real GDP growth rate is given bypotential GDP growth and the output gap.— The public balance separates interest payments, cyclicallyadjusted balance and cyclical components, in order to properly assess the fiscal stance, i.e. the part of fiscal policy whichis under the direct control (discretion) of current governments. We then derive public debt projections for euro areacountries.The structural primary surplus evolves according to the fiscalimpulse (which is set exogenously, at levels given by Stabilityprogrammes, ex
second section. The third section analyses the actual path of consolidation and shows that it is ill-designed. Finally, the fifth section analyses and discusses the consequences of delaying fiscal contraction. 1. Fiscal multiplier in times of crisis: a short overview During the Great Recession, most industrial countries have