Transcription
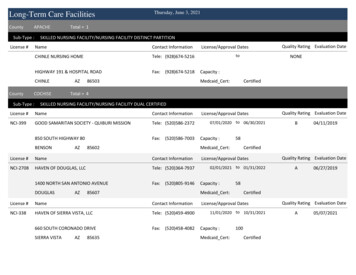
Long-Term Care Insurance System of JapanNovember 2016Health and Welfare Bureau for the ElderlyMinistry of Health, Labour and Welfare
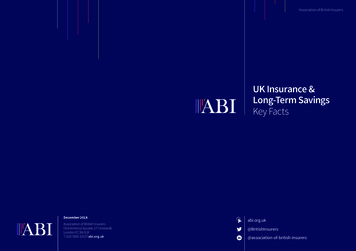
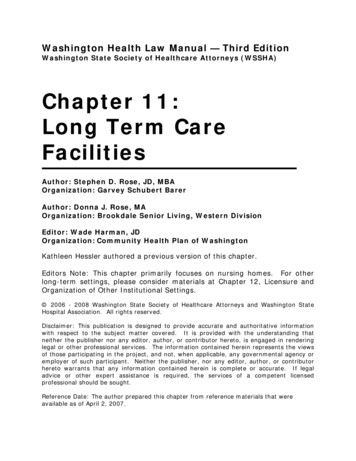
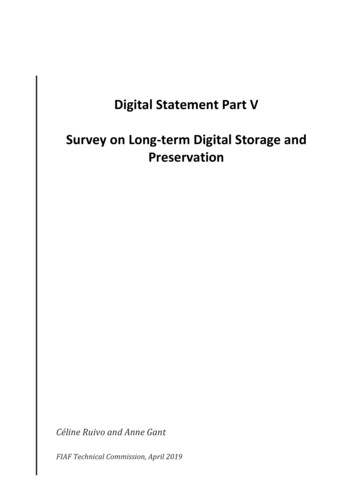
Changes in the Percentage of the Population Over Age 6545%39.9%40%Korea, Rep.35%Germany% of population aged 65 & 019801990200020102020203020402050Sources: For Japan – Ministry of Internal Affairs and Communications, Population Census; National Institute of Population and Social Security Research –“Population Projections for Japan (January 2012 estimate): Medium-Fertility & Medium-Mortality Assumption” (Figures as of Oct. 1 of each year)For other countries – United Nations, World Population Prospects 20102060(Year)1
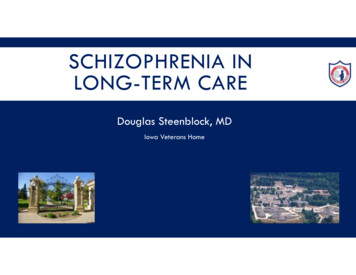
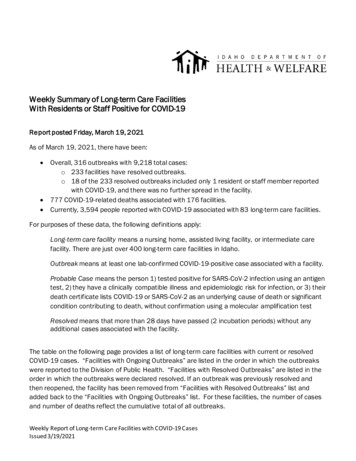
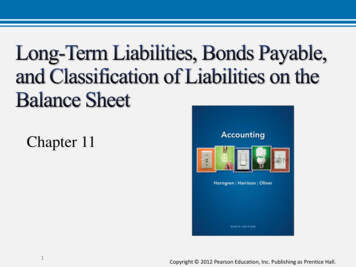
Changes in Japan’s Population Pyramid (1990–2060) By examining changes in Japan’s demographic makeup , it can be seen that the current social structure consists of 2.6 personssupporting each elderly person. In 2060, with the progression of the aging population and decreasing birthrate, it is estimatedthat 1.2 person will be supporting one senior citizen.1990 (Actual figures)AgeTotal population:123.61 million10090AgeTotal population:128.06 million10090Age 75 & older597(5%)80Age 65–74892( 7%)7020252010 (Actual figures)AgeTotal population:120.66 million1009070Age Total population:100Age 75 & older2,179(18%)Age 65–741,479(12%)60605050505040304030Age 20–646,559(54%)40Age 65–741,128(13%)7060Age 20–647,497(59%)Age 75 & older2,336(27%)8060Age 20–647,590(61%)86.74 million90Age 75 & olderBaby Boom1,407(11%)80GenerationAge 65–74 (Born 1947–49)701,517(12%)802060Age 20–644,105(47%)40303020202nd20Baby BoomGeneration(Born 1971–74)20Age 0–193,249(26%)100Age 0–192,287(18%)100050 100 150 200 25010Kpeople1Persons 65 andolderPersons aged20–645.1Age 0–191,849(15%)100050 100 150 200 25010Kpeople12.6Age 0–191,104(13%)100050 100 150 200 25010Kpeople11.8050 100 150 200 25010Kpeople11.2Source: Ministry of Internal Affairs and Communications – Population Census, Population Estimate; National Institute of Population and Social Security Research – “Population Projectionsfor Japan (January 2012): Medium-Fertility & Medium-Mortality Assumption” (Figures as of Oct. 1 of each year)2
(1)Outline of Long-Term Care Insurance System3
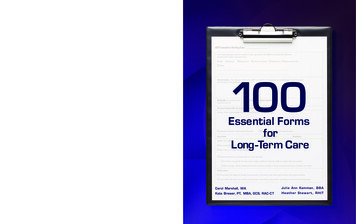
Development of welfare policies for the elderlyAging rate(year)1960sBeginning of welfare policiesfor the elderly5.7%(1960)1970sExpansion of healthcareexpenditures for the elderly7.1%(1970)Major policies1963 Enactment of the Act on Social Welfare Services for the Elderly Intensive care homes for the elderly created Legislation on home helpers for the elderly1973 Free healthcare for the elderly1982 Enactment of the Health and Medical Services Act for the Aged Adoption of the payment of co-payments for elderly healthcare, etc.1980s“Social hospitalization” and“bedridden elderly people”as social problems9.1%(1980)1990sPromotion of the Gold Plan12.0%(1990)Preparation for adoption ofthe Long-Term Care InsuranceSystem14.5%(1995)2000sIntroduction of the Long-TermCare Insurance System17.3%(2000)1989 Establishment of the Gold Plan (10-year strategy for the promotion ofhealth and welfare for the elderly) Promotion of the urgent preparation of facilities and in-home welfareservices1994 Establishment of the New Gold Plan (new 10-year strategy for thepromotion of health and welfare for the elderly) Improvement of in-home long-term care1997 Enactment of the Long-Term Care Insurance Act2000 Enforcement of the Long-Term Care Insurance System4
Problems before introducing the Long-Term Care Insurance SystemWelfare systemfor the elderlyServices provided:Medical systemfor the elderlyServices provided:・Intensive Care Home for the Elderly, etc.・Home-help service, Day service, etc.・ Health center for the elderly,Sanatorium medical facility, general hospital, etc.・Home-visit nursing, day care, etc.(Problems) Users could not choose services :Municipal governments decided services and serviceproviders. Psychological resistance :Means test was required when applying services.( Problems ) Long-term hospitalization to be cared in hospitals (“socialhospitalization”) increased:hospitalization fee is less expensive than welfare servicesfor middle/upper income group, as well as basicmaintenance of the welfare service was insufficient. Medical cost increased:Hospitalization fee was more expensive comparing withIntensive Care Home for the Elderly and Health center forthe elderly. Facilitation of hospital was not sufficient enough forlong-term care with staff and living environment:Hospitals are expected to provide “cure” (e.g. Limitedroom area for care, dining hall or bathrooms) Services tended to be unvarying without competition:Services were basically provided by municipalities ororganizations entrusted. Service fee could be heavy burden for themiddle/upper income group:The principle of ability to pay according to income ofthe person/Supporter under Duty.These systems had limitations for solving problems.5
Background of the introductionof the Long-Term Care Insurance System As society ages, needs for long-term care have been increasing because of more elderlypersons requiring long-term care and lengthening of care period, etc. Meanwhile, due to factors such as the trend towards nuclear families and the aging ofcaregivers in families, environment surrounding families has been changed.Introduction of the Long-Term Care Insurance System(a mechanism to enable society to provide long-term care to the elderly )【Basic Concepts】 Support for independence: The idea of Long-Term Care Insurance System is to support theindependence of elderly people, rather than simply providing personal care. User oriented: A system in which users can receive integrated services of health, medicine,and welfare from diverse agents based on their own choice. Social insurance system: Adoption of a social insurance system where the relation betweenbenefits and burdens is clear.6
Outline of difference between previous systems and presentPrevious Systemsthe Long-Term CareInsurance System① Municipal governments decidedservices, after users’ application.Users themselves can choose servicesand service providers.② Separated applications wererequired for each service of medical andwelfare systems.By making use plans of care service(Care Plan), integrated medical andwelfare services can be utilized.③ Services were provided mainly bymunicipal governments and other publicorganizations (e.g. Council of SocialWelfare).Services are provided by variousassociations such as private companiesand NPOs, etc.④ Co-payment was heavy burden forthe middle/upper income group, whichkept them from applying to services.Regardless of income, co-payment is setas 10% (20% for persons with incomeabove certain level, after August 2015) .7
Structure of the Long-Term Care Insurance SystemMunicipalities ums50%Pay 90% (80%) ofthe costsState12.5%(*)25%(*)*As for benefits for facilities, thestate bears 20% and prefecturesbear 17.5%.22%28%ApplicationService providers In-home services- Home-visit care- Outpatient Day Long-Term Care, etc. Community-based services- Home-Visits at Night for Long-TermCare- Communal Daily Long-Term Care forDementia Patients, etc. Facility Services- Welfare facilities for the elderly- Health facilities for the elderly, etc.Determined based onthe population ratio(JFY2015-2017)Fiscal StabilityFundsPremiumsNational pool ofmoneyIndividualmunicipalityUsers pay 10%(20%) oflong-term care services inprinciple, but must pay theactual costs for residenceand meals additionally.Use of the servicesNational Health Insurance, HealthInsurance Society, etc.Withheld from pensions,in principleCertification of NeededLong-Term CareInsured personsPrimary Insured Persons- aged 65 or over(32.02 million people)Secondary Insured Persons- aged 40-64(42.47 million people)Note: The figure for Primary Insured Persons is from the Report on Long-Term Care Insurance Operation (provisional) (April, 2009), Ministry of Health, Labour and Welfare and that forSecondary Insured Person is the monthly average for JFY2008, calculated from medical insurers’ reports used by the Social Insurance Medical Fee Payment Fund in order to determine theamount of long-term care expenses. Burden ratio for persons with income above certain level is 20:80, after Aug 2015.8
The insured The insured under the Long-Term Care Insurance System are (1) people aged 65 or over (Category 1insured persons) and (2) people aged 40-64 covered by a health insurance program (Category 2 insuredpersons). Long-term care insurance services are provided when people aged 65 or over come to require care orsupport for whatever reason, and when people aged 40-64 develop aging-related diseases, such asterminal cancer or rheumatoid arthritis, and thereby come to require care or support.Primary insured personsSecondary insured personsEligible personsPersons aged 65 or overPersons aged 40-64 covered by a healthinsurance programNumber32.02 millionaged 65-74:15.74 million42.47 millionRequirement forservice provisionPercentage andnumber of personswho are eligible forservicesPremiums collection- Persons requiring long-term care(bedridden, dementia, etc.)- Persons requiring support (daily activitiesrequires support)Limited to cases where a condition requiringcare or support results from age-relateddiseases (specified diseases), such as terminalcancer and rheumatoid arthritis5.69million(17.8%)aged 65 74: 0.72million(4.4%)aged 75 : lected by municipalities (in principlewithheld from pension benefits)Collected together with medical care premiumsby medical care insurers9
Procedure for Use of Long-term Care ServicesMunicipal governments (sections in charge)UsersInvestigation for CertificationDoctor’s written opinionCertification of Needed Support/Long-Term CareCare levels 1-5Those likely tocome to needlong-termcare/support inthe futureSupport levels 1 & 2Care planfor the use of long-term careCare planfor preventive long-term care Facility services In-home services Preventive long-term care services・Intensive care home forthe elderly・Long-term care healthfacility・Sanatorium medicalfacility for the elderlyrequiring long-term care・Home-visit long-term care・Home-visit nursing・Outpatient day long-term care・Short-stay admission service, etc.・Outpatient preventive long-term care・Outpatient rehabilitation preventivelong-term care・Home-visit service for preventive longterm care, etc. Community-based services・Multifunctional long-term care in smallgroup homes・Home-visit at night for long-term care・Communal daily long-term care fordementia patients (group homes), etc.Long-term care benefitsNot certified Long-term careprevention projects Services whichcope with the actualmunicipalities’ needs(services not coveredby the long-term careinsurance) Community-based services forpreventive long-term care・Multifunctional preventive long-termcare in small group homes・Preventive long-term care for dementiapatients in communal living, etc.Preventivelong-term care benefitsCommunity support projects10
Varieties of Long-term Care Insurance ServicesHome-visit ServicesPrivate HomeHome-visit Care, Home-visit Nursing, Home-VisitBathing Long-Term Care, In-Home Long-TermCare Support, etc.Day ServicesOutpatient Day Long-Term Care, OutpatientRehabilitation, etc.Short-stay ServicesShort-Term Admission for Daily Life Long-TermCare, etc.Residential ServicesDaily Life Long-Term Care Admitted to aSpecified Facility and People with Dementia etc.In-facility ServicesLong-termCare FacilityFacility Covered by Public Aid Providing LongTerm Care to the Elderly, Long-Term Care HealthFacility, etc.11
(2)Present condition and future prediction ofLong-Term Care Insurance System12
Increase in number of persons who are eligible for LTC insurance and users While the number of insured persons aged 65 or older has increased by approximately 1.5 times over 15 yearssince 2000, when the Long-term Care Insurance System was established, that of care service users hasincreased by approximately 3 times over the same period. The surge in the number of in-home care usersaccounts for the threefold increase of the care service users.①Increase in number of insured persons aged 65 and olderEnd of April,2015End of April,2000Number of first insured persons21.65 million 33.08 million1.53 times②Increase in number of persons with care needs & support needs certificationEnd of April,2015End of April,2000Number of persons with care needs &support needs certification2.18 million 6.08 million2.79 times③Increase in number of service usersEnd of April,2015End of April,2000Number of users of in-home care0.97 million 3.82 million3.94 timesNumber of users of facility care0.52 million 0.90 million1.73 timesNumber of users of community-based care-Total1.49 million39 million 5.11 million3.43 times(Source: Report on Long –Term Care Insurance Service)13
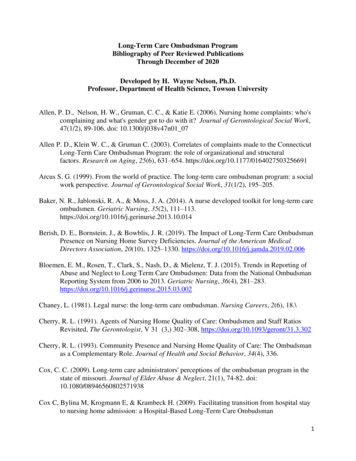
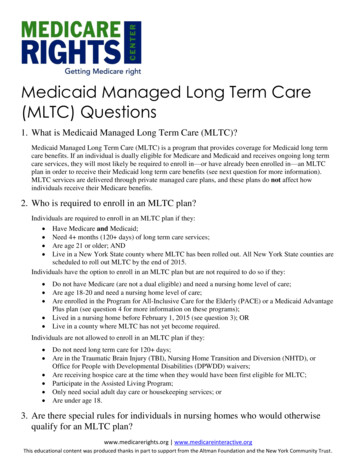
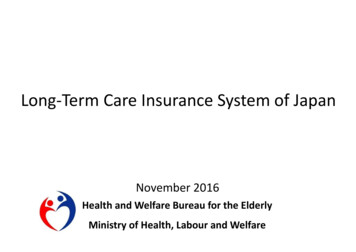
State of Affairs Regarding Long-Term Care Insurance in the Future1. The no. of seniors over age 65 is predicted to reach 36.57 million by 2025 and reach a peak of 38.78 million in 2042.Additionally, the percentage of seniors over age 75 is expected to grow, surpassing 25% by 2055.2010201520252055No. of seniors 65 & older (ratio)29.48milion (23.0%)33.95milion (26.8%)36.57milion (30.3%)36.26milion (39.4%)No. of seniors 75 & older (ratio)14.19milion(11.1%)16.46milion (13.0%)21.79milion (18.1%)24.01milion (26.1%)*Source: “Projection of the number of households for Japan (nationwide projection) “compiled in Jan. 2013, National Institute of Population and Social Security Research (1&3)2. Among seniors over age 65, seniors with dementia will increase.3. Individual/ couple-only households with householders over age 65 26.625.724.923.110,000Approx.7mil.(20%)(%)Changes in no. of one-person a
Changes in Japan’s Population Pyramid (1990–2060) 2 (1)Outline of Long-Term Care Insurance System 3. Aging rate (year) Major policies 1960s Beginning of welfare policies for the elderly 5.7% (1960) 1963 Enactment of the Act on Social Welfare Services for the Elderly Intensive care homes for the elderly created Legislation on home helpers for the elderly 1970s Expansion of healthcare .