Transcription
Office of Sexual Health and EpidemiologySexually Transmitted InfectionsSurveillance ReportNew York State2019
Table of ContentsOffice of Sexual Health and EpidemiologyEXECUTIVE SUMMARYReport . . .1SEXUALLY TRANSMITTED INFECTION (STI) DESCRIPTIONSSyphilis . . . . .3Gonorrhea . . . . .5Chlamydia . . . . .6OVERALL DIAGNOSES OF STIFigure 1. STI Diagnoses by Age, New York State, 2019 . . .7Table 1. STIs by Region/County, New York State, 2019 . . . . . .8SYPHILISFigure 2. Early Syphilis by Year, New York State, 1960 - 2019 . . 9Figure 3. Early Syphilis by Year and Sex, New York State excluding New York City, 1936 - 2019 . . . . . .10Figure 4. Primary and Secondary Syphilis Rates by Race/Ethnicity and Year, New York State, 2001 - 2019 . . .11Figure 5. Primary and Secondary Syphilis Rates by Age and Sex, New York State, 2019 . . . .12Figure 6. Congenital Syphilis Diagnoses with Primary & Secondary Syphilis Rates, New York State, 2005 - 2019 . .13Table 2. Syphilis by Region/County, New York State, 2019 . . .14Table 3. Early Syphilis by Region/County and Sex, New York State, 2019 . . . . .15Table 4. Primary and Secondary Syphilis by Region/County and Sex, New York State, 2019 . . . 16Table 5. Early Syphilis by Sex and Age, New York State, 2019 . . . . . . .17Table 6. Primary and Secondary Syphilis by Sex and Age, New York State, 2019 . . . . . . . .18Table 7. Early Syphilis by Region/County and Year, New York State, 2017 - 2019 . . . . . . . 19Table 8. Early Syphilis by Year and Region, New York State, 1958 - 2019 . . . .20Table 9. Primary and Secondary Syphilis by Year and Region, New York State, 1954 – 2019 . . . 21
Table of ContentsOffice of Sexual Health and EpidemiologyGONORRHEAFigure 7. Gonorrhea by Year and Region, New York State, 1960 - 2019 . . . . . . . . . .22Figure 8. Gonorrhea Rates by Sex and Year, New York State, 2001 - 2019 . . . . . . .23Figure 9. Gonorrhea Rates by Race/Ethnicity and Year, New York State, 2013 - 2019 . . . . . .24Figure 10. Gonorrhea Rates by Age and Sex, New York State, 2019 . . . . . .25Table 10. Gonorrhea by Region/County and Sex, New York State, 2019 . . . . . . .26Table 11. Gonorrhea by Sex and Age, New York State, 2019 . . . . . . . . . .27Table 12. Gonorrhea by Region/County and Year, New York State, 2017 - 2019 . . . . .28Table 13. Gonorrhea by Year and Region, New York State, 1958 - 2019 . . . . . . .29CHLAMYDIAFigure 11. Chlamydia by Year and Region, New York State, 2001 - 2019 . . . . .30Figure 12. Chlamydia Rates by Sex and Year, New York State, 2001 - 2019 . . . . .31Figure 13. Chlamydia Rates by Race/Ethnicity and Year, New York State, 2013 - 2019 . . . . . . .32Figure 14. Chlamydia Rates by Age and Sex, New York State, 2019 . . . . . . . .33Table 14. Chlamydia by Region/County and Sex, New York State, 2019 . . . . .34Table 15. Chlamydia by Sex and Age, New York State, 2019 . . . . . . . . .35Table 16. Chlamydia among Young Females, by Age and Region/County, New York State, 2019 . . . . .36Table 17. Chlamydia by Region/County and Year, New York State, 2017 - 2019 . . . . .37Table 18. Chlamydia by Year and Region, New York State, 2001 - 2019 . . . . . .38TECHNICAL NOTESData Sources . . . 39STI Statistics . . . . 40References . . . . 42Citation and Contact . . . 43
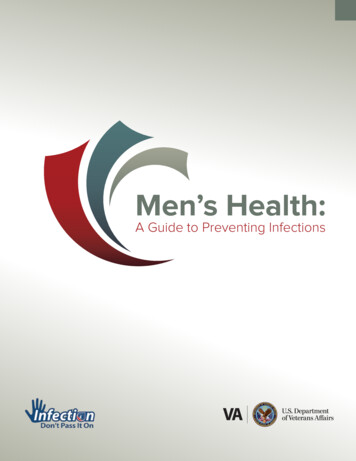
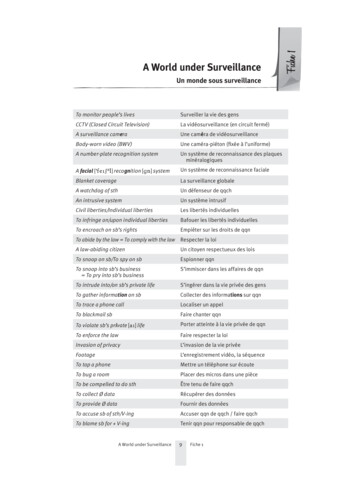
Executive Summary: ReportOffice of Sexual Health and EpidemiologyThis document summarizes 2019 surveillance data for the three major notifiable sexuallytransmitted infections (STIs) in New York State (NYS): syphilis;gonorrhea; andchlamydia.Healthcare providers and laboratories are required to report suspected or confirmed diagnoses ofcommunicable diseases, including STIs, under NYS Public Health Law 2101 and 21021. Moredetailed information on data collected are provided in the Technical Notes section.In 2019, reported diagnoses of chlamydia and gonorrhea increased for the sixth consecutive year,while primary and secondary syphilis increased after showing a decline in 2017. Data from theCenters for Disease Control and Prevention2 (CDC) ranks New York State 9th, 17th, and 11th amongall states in 2019 for the total number of diagnoses of chlamydia, gonorrhea, and primary andsecondary syphilis, respectively; and 34th for diagnoses of congenital syphilis. The highest rates ofSTIs in NYS continued to be seen in young people, non-Hispanic black individuals, and men whohave sex with men.Since chlamydia became a reportable STI in 2000, the number of diagnoses has dominated otherreportable STIs. In 2019, it continued to be the most commonly reportable STI in NYS with 124,389diagnoses (3.9% increase over 2018). The highest rates were among females 15-24 years of age.Gonorrhea diagnoses increased 9.6% in 2019, to 40,896 reported diagnoses. The increase amongfemales was higher than males (10.6% compared to 9.2%). Additionally, the rates were highestamong males 20-34, and among females 15-24.1
Executive Summary: ReportOffice of Sexual Health and EpidemiologyPrimary and secondary syphilis diagnoses increased 8% in 2019 compared to 2018; the nationalpercent increase was 11.2% for the same period. Diagnoses among males accounted for 91.9% ofprimary and secondary syphilis diagnoses; 70.2% of males diagnosed with primary or secondarysyphilis reported other males as their sex partners. In 2019, males accounted for the vast majorityof diagnoses; rates of primary and secondary syphilis among females continued to increase 5-foldcompared to 2014 rates. Additionally, in 2019, 27 diagnoses of congenital syphilis were reportedstatewide, a 7% decrease compared to 2018 (29 diagnosed infants).These data represent only a portion of the true burden of STIs in NYS. Many cases of syphilis,gonorrhea and chlamydia go undiagnosed and therefore unreported, and several highly prevalentSTIs, such as human papillomavirus, genital herpes and trichomoniasis, are not reported at all. Thisreport provides important information about the burden of notifiable bacterial STIs in NYS.NYS remains committed to conducting high quality STI surveillance, responding to STI-relatedoutbreaks, identifying persons with STIs and linking them and their partners to care and treatmentthrough Partner Services. Additional priorities include promoting CDC-recommended screening,diagnosis, and treatment practices, sharing local epidemiological information with health careprofessionals and the community. We value our partnership with community experts instrengthening collaborations, monitoring and developing STI-related policies, and analyzing data forprogram insights and improvement.2
Sexually Transmitted Infection Descriptions: SyphilisOffice of Sexual Health and EpidemiologySyphilis3 is an STI caused by the bacterium Treponema pallidum, and is spread through vaginal,anal, or oral sex.Syphilis is generally classified in four stages that occur sequentially unless treated: Primary syphilis - characterized by a single painless skin ulcer (sore), although there may bemultiple sores. The sore generally appears within a few weeks of sexual contact, usually on oraround the genitals or anus, or on the lips, or in the mouth. Transmission occurs through directcontact with a syphilitic sore during sex. After the sores heal (sores will heal without treatment)the infection progresses to secondary syphilis. Secondary syphilis - presents as skin rashes and lesions on mucous membranes, generallywithin six weeks after the primary sore or sores heal. Symptoms resolve even without treatmentand the infection enters the latent stage. Early non-primary non-secondary stage - causes intermittent flare-ups of symptoms, alongsideperiods with no outward symptoms. Late/tertiary stage – occurs when the infection is left untreated and begins three or more yearsafter infection. In this stage the bacteria, while not sexually transmittable, can spread throughoutthe body, leading to serious illness or death.Syphilis infection increases the risk for contracting other STIs like HIV.Syphilis can be cured with antibiotics4, though any damage to the body that has already occurredcannot be undone. Dosage and length of treatment will depend upon the syphilis stage atdiagnosis, and whether there are clinical manifestations.3
Sexually Transmitted Infection Descriptions: SyphilisOffice of Sexual Health and EpidemiologySyphilis data presented in this surveillance report represent confirmed or probable cases accordingto the CDC case definitions5 for syphilis.The first two stages are presented combined as “Primary and Secondary Syphilis,” and representthe most infectious stages of syphilis.“Early Syphilis” combines primary and secondary syphilis diagnoses with syphilis diagnosed withinthe first year of infection that had progressed past the primary and secondary stages (aka “earlynon-primary non-secondary”). Individuals diagnosed with “early non-primary non-secondary” may ormay not have been experiencing clinical manifestations of syphilis at the time of their diagnosis.Congenital syphilis occurs in infants who acquire the infection from their pregnant parent withuntreated syphilis. Congenital syphilis can cause severe medical complications during pregnancy,and result in birth defects and/or death to the fetus/infant.Congenital syphilis data presented in this surveillance report represent confirmed or probable casesaccording to the CDC case definition6.4
Sexually Transmitted Infection Descriptions: GonorrheaOffice of Sexual Health and EpidemiologyGonorrhea7 is an STI caused by the bacterium Neisseria gonorrhoeae, and is spread through oral,anal, or vaginal sex. Gonorrhea can also be passed from mother to infant during vaginal delivery.Vaginal symptoms, which usually begin within 5-60 days of transmission, may include unusualdischarge, spotting, and inflammation of the vulva. Penile symptoms can include thick dischargefrom the urethra, painful urination, and redness and swelling of the urethral opening.If left untreated, gonorrhea may progress to an infection of the female reproductive organs calledpelvic inflammatory disease (PID). PID can cause abscesses and scar tissues thereby increasingthe risk of infertility, miscarriage, and ectopic pregnancy. In rare cases, untreated gonorrhea in menmay cause severe pain and swelling in the testicles, resulting in sterility.Gonorrhea can spread throughout the body, and increase the risk for contracting other STIs likeHIV.Gonorrhea can be cured with antibiotics8; however, antimicrobial resistant gonorrhea9 isincreasingly a concern. Recently, CDC updated treatment recommendations10 for uncomplicatedgonorrhea to a single 500 mg intramuscular dose of ceftriaxone.Gonorrhea data presented in this surveillance report represent confirmed or probable casesaccording to the CDC case definition11.5
Sexually Transmitted Infection Descriptions: ChlamydiaOffice of Sexual Health and EpidemiologyChlamydia12 is an STI caused by the bacterium Chlamydia trachomatis, and is spread through oral,anal, or vaginal sex. It is the most common notifiable infection in the United States. Chlamydia maypass from mother to infant during vaginal delivery.Most people who are infected have no outward symptoms. If symptoms are present, they mayappear one to three weeks after transmission. Vaginal symptoms may include discharge, burningurination, and spotting. Penile symptoms may include urethral discharge, pain when urinating, andinflammation of the testicles which may result in sterility. Infection may occur in the rectum afteranal sex, or spread from another infected area, such as the vagina. Untreated chlamydialinfections may lead to an infection of the female reproductive organs, pelvic inflammatory disease(PID). PID can cause abscesses and scar tissues, thereby increasing the risk of infertility,miscarriage, and ectopic pregnancy.Chlamydia infection increases the likelihood of contracting other STIs, such as gonorrhea or HIV.Chlamydia can be cured with common antibiotics13. Partner treatment14 is crucial for the preventionof repeat infections.Chlamydia data presented in this surveillance report represent confirmed cases according to theCDC case definition15.6
Figure 1. STI Diagnoses By AgeNew York State, 2019Office of Sexual Health and EpidemiologyWhat this figure showsChlamydia is the most commonlyreported STI in New York State12,00053% of STIs are diagnosed among peopleyounger than 26 years of ,00050ChlamydiaEarly AGE4550556065707
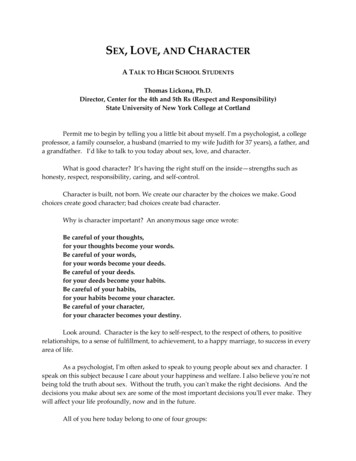
T a b le 1 . S T Is b y R e g io n /C o u n tyN e w Y o rk S ta te , 2 0 1 9O ffic e o f S e x u a l H e a lth a n d E p id e m io lo g yE a r ly S y p h i li sR e g io n /C o u n tyD ia g n o s e sG o n o rrh e aR a teD ia g n o s e sC h la m y d i aR a teD ia g n o s e sE a r ly S y p h i li sR a teR e g io n /C o u n tyR a teD ia g n o s e sC h la m y d i aR a teD ia g n o s e sR a teN e wY o r k S ta te (N Y S )7 ,2 4 73 8 .64 0 ,8 9 62 1 7 .01 2 4 ,3 8 96 6 7 .91 3 48 .41 ,8 1 91 0 8 .97 ,5 7 64 3 1 .3N e wY o r k C it y ( N Y C )5 ,6 6 56 5 .42 8 ,9 7 33 4 0 .97 6 ,2 0 69 4 1 .7B ro o m e1 91 0 .72 0 81 1 1 .87 0 43 5 1 .1B ro n x1 ,3 0 09 2 .75 ,9 3 24 0 9 .61 8 ,3 6 91 ,2 6 7 .9C a y u g a10 .86 29 5 .62 6 34 0 4 .5K in g s1 ,4 4 55 3 .38 ,9 8 93 4 3 .72 3 ,1 7 19 3 8 .0C h e n a n g o37 .01 43 5 .91 0 22 6 6 .9N e w Y o rk1 ,9 2 21 0 6 .39 ,2 4 25 0 1 .61 7 ,8 8 91 ,0 3 8 .7C o r t la n d61 4 .12 34 3 .52 3 13 6 6 .89 2 94 1 .04 ,3 2 22 0 0 .21 4 ,8 5 97 2 4 .9H e r k im e r46 .52 03 8 .91 5 93 0 5 .16 91 5 .34 8 81 1 1 .91 ,9 1 84 4 3 .1J e ffe rs o n86 .49 57 9 .57 7 65 8 7 .1N Y S e x c l. N Y C1 ,5 8 21 5 .31 1 ,9 2 31 1 4 .94 8 ,1 8 34 5 7 .5L e w is29 .331 4 .75 02 2 8 .1B u ffa lo R e g io n1 3 49 .42 ,5 2 11 7 9 .17 ,7 4 45 5 1 .7M a d is o n45 .32 43 8 .12 1 22 8 7 .7A lle g a n y12 .31 22 9 .71 3 62 5 9 .3O n e id a1 88 .01 6 07 7 .28 4 94 0 1 .4C a tta r a u g u s34 .13 75 5 .32 2 53 3 5 .1O n o n d a g a3 79 .11 ,0 1 72 2 8 .12 ,9 5 06 5 5 .0C h a u ta u q u a43 .81 3 81 2 1 .66 2 15 2 9 .5O s w e g o64 .93 93 6 .93 3 82 9 1 .21 0 91 2 .41 ,9 4 22 2 1 .95 ,4 6 36 3 0 .9S t L a w re n c e67 .02 42 3 .83 0 72 6 1 .9G e n e s e e35 .52 65 2 .51 4 92 9 6 .9T io g a37 .01 33 4 .11 2 33 1 5 .8N ia g a r a1 05 .03 3 71 8 4 .29 3 35 2 0 .2O r le a n s23 .62 05 4 .71 5 14 1 2 .6W y o m in g26 .592 8 .26 61 8 9 .32 1 91 5 .91 ,5 7 71 1 2 .35 ,8 3 9A lb a n y9 83 2 .47 3 32 2 3 .9C li n t o n23 .62 9C o lu m b i a51 0 .0D e la w a r e27 .4Q u e e n sR ic h m o n dE r ieC a p it a l R e g io nE s s e x--C e n t r a l R e g io nD ia g n o s e sG o n o rrh e aT o m p k in s1 71 6 .61 1 77 8 .65 1 23 2 0 .83 1 62 6 .82 ,6 5 22 2 4 .37 ,3 6 56 2 0 .3C h e m u n g68 .21 1 01 5 2 .43 8 15 3 1 .14 0 6 .9L iv in g s to n35 .14 06 3 .01 6 32 2 7 .82 ,0 0 65 7 6 .4M o n ro e2 8 74 0 .02 ,2 9 63 1 7 .75 ,7 5 87 9 5 .83 4 .92 6 93 1 2 .8O n ta r io55 .55 85 9 .73 1 13 2 1 .93 06 5 .81 6 23 5 3 .4S c h u y le r21 4 .686 2 .43 32 4 0 .11 02 4 .69 62 5 5 .7S e n e c a39 .71 65 2 .68 02 6 1 .4R o c h e s t e r R e g io n1 13 9 .56 12 1 9 .1S te u b e n66 .46 78 2 .12 9 83 7 8 .6F r a n k li n12 .851 0 .11 0 62 2 3 .3W a y n e34 .55 16 9 .33 0 64 1 8 .8F u lt o n24 .62 86 2 .31 6 63 8 0 .0Y a te s13 .562 6 .63 51 5 4 .2G re e n e51 3 .01 63 9 .31 3 63 3 6 .9H u d s o n V a lle y4 2 42 0 .01 ,7 3 58 1 .49 ,4 2 74 3 6 .89 53 3 .92 1 07 4 .51 ,1 5 84 0 0 .7H a m i lt o n--13 6 .131 0 5 .9D u tc h e s sM o n tg o m e r y--3 07 2 .41 4 93 5 4 .7O ra n g e1 0 52 8 .62 8 87 7 .31 ,7 3 84 4 9 .589 .23 03 6 .42 1 22 4 3 .13 81 3 .61 4 04 7 .31 ,1 8 23 8 3 .5O ts e g oR e n s s e la e rS a r a to g a58 .22 64 2 .62 7 13 8 5 .0P u tn a m4 12 7 .52 7 51 7 9 .37 3 54 7 1 .6R o c k la n d94 .28 84 3 .14 9 12 4 8 .4S u lli v a n4 02 6 .02 4 51 7 0 .28 6 15 9 7 .6U ls t e rS c h o h a r ie13 .972 5 .97 62 6 1 .1W e s tc h e s te rW a rre n61 0 .43 05 6 .51 3 62 6 6 .0W a s h in g to n23 .61 32 3 .81 1 52 2 1 .7S c h e n e c ta d yR a t e s a r e p e r 1 0 0 , 0 0 0 r e s id e n t s a n d a g e - a d ju s t e d .Early Syphilis includes Primary Syphilis, Secondary Syphilis and Early Non-Primary Non-Secondary Syphilis.91 3 .34 66 8 .62 8 04 3 5 .32 91 7 .81 1 57 1 .06 0 33 7 9 .81 4 01 6 .09 0 61 0 4 .64 ,2 5 44 9 1 .0L o n g Is la n d3 5 51 3 .71 ,6 1 96 3 .11 0 ,2 3 23 9 7 .6N a s s a u1 8 91 5 .38 1 86 7 .04 ,9 2 84 0 4 .9S u f f o lk1 6 61 2 .48 0 15 9 .75 ,3 0 43 9 1 .28
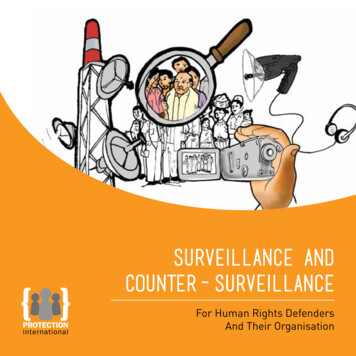
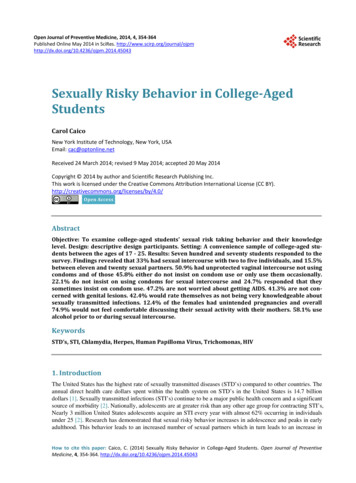
Figure 2. Early Syphilis by YearNew York State, 1960 - 201916,00014,00012,000Office of Sexual Health and EpidemiologyEarly non-primary non-secondary Early non-primary non-secondarysyphilis does not have symptoms.Screening is needed to detect it.Primary & Secondary SyphilisThe last syphilis epidemic peaked around 1990 Syphilis is most infectious in theprimary and secondary stagesDiagnoses10,0008,000Early syphilis has beenincreasing since 20006,0004,000Intensive public health effortswere needed to control thesyphilis epidemic in the80s and 90s2,00001960197019801990YearThe year 2000 hadthe lowest numberof early syphilisdiagnoses in56 years2000201020199
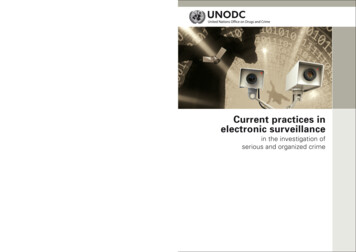
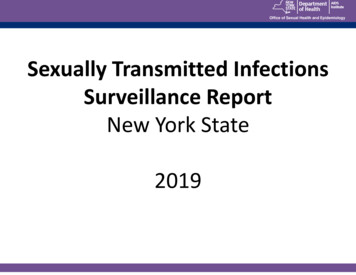
Figure 3. Early Syphilis by Year and SexNew York State excluding NYC, 1936 - 2019Office of Sexual Health and Epidemiology3,500TotalMalesFemales3,000The syphilis epidemicin the 1980s affectedmales and femalesabout equally2,500Diagnoses2,0001,5821,500Penicillin savedmany lives afterWorld War II1,000There were more males thanfemales diagnosed withsyphilis in the 1970s, beforethe HIV/AIDs epidemicThe rise in syphilis ismostly among males;though diagnosesamong females haveseen a 6199620062019Year10
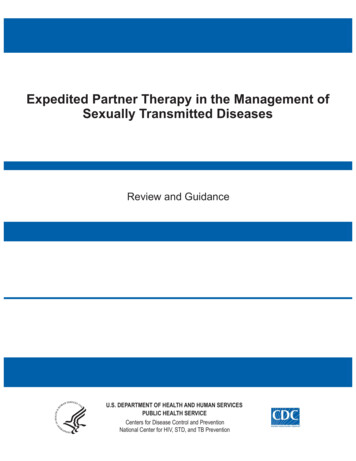
Figure 4. Primary and Secondary Syphilis Rates by Race/Ethnicity andYearNew York State, 2001 - 2019Office of Sexual Health and EpidemiologyWhat this figure shows3532.4Age-Adjusted Rate per 100,000 population3025.725201516.2Non-Hispanic black Individualscontinue to have the largest rates ofprimary and secondary syphilisannuallyAmerican Indian/Alaskan Nativepopulation represent a relativelysmall proportion of the morbiditybut the second highest rate in thestateNumber and Proportion ofDiagnoses in 2019230, 8.0%638,22.3%10883,30.8%8.86.25121, 4.2%17, 0.6%WhiteBlack02001 2003 2005 2007 2009 2011 2013 2015 2017 2019Year975,34.0%American Indian/Alaskan NativeAsian/Native Hawaiian/Pacific IslanderHispanicUnknown11
Figure 5. Primary and Secondary Syphilis Rates by Age and SexNew York State, 2019Office of Sexual Health and EpidemiologyWhat this figure shows90Most primary and secondarysyphilis is diagnosed among males79.680Males, 20 to 39 years of age, have thehighest rates of diagnoses70.1Rate per 100,000 25-2930-3435-3940-4445-4950-5455-59Age Group12
Figure 6. Congenital Syphilis Diagnoses with Primary & Secondary Syphilis RatesNew York State, 2005 - 2019Office of Sexual Health and EpidemiologyNumber of Congental syphilis diagnoses3029Rate of Primary and secondary syphilis - FemalesRate of primary and secondary syphilis - Males25The number ofcongenital syphilisdiagnoses decreased in2019 but still ge-adjusted rate per 100,000 populationWhat this figure shows27.927252530The rate of primary andsecondary syphilisamong females hasincreased 400% in past 5years (0.5 to 2.5 20172019Year13
T a b le 2 . S y p h ilis b y R e g io n /C o u n tyN e w Y o rk S ta te , 2 0 1 9O ffic e o f S e x u a l H e a lth a n d E p id e m io lo g yE a r ly N o n - P r i m a r yN o n -S e c o n d a ryS y p h i li sP r im a r y a n dS e c o n d a r y S y p h i li sR e g io n /C o u n tyD ia g n o s e sR a teD ia g n o s e sU n k n o w n D u r a tio n o rL a t e S y p h i li sR a teD ia g n o s e sR a teN e wY o r k S ta te (N Y S )2 ,8 6 41 5 .24 ,3 8 32 3 .43 ,2 3 11 6 .9N e wY o r k C it y ( N Y C )1 ,9 8 72 2 .93 ,6 7 84 2 .52 ,6 7 53 0 .7B ro n x4 2 93 0 .38 7 16 2 .46 1 34 3 .3K in g s4 9 21 8 .19 5 33 5 .28 4 43 1 .1N e w Y o rk6 8 93 8 .01 ,2 3 36 8 .35 7 83 1 .3Q u e e n s3 5 01 5 .35 7 92 5 .75 8 22 5 .8R ic h m o n d2 76 .14 29 .35 81 3 .5N Y S e x c l. N Y C8 7 78 .57 0 56 .95 5 65 .0B u ffa lo R e g io n5 38 35 .213 .58 15 .8A lle g a n y12 .3C a tta r a u g u s2C h a u ta u q u aE r ie2 .8-3 .6---11 .311 .043 .897 .76 67 .64 34 .75 55 .4G e n e s e e23 .711 .761 0 .8N ia g a r a84 .220 .852 .7O r le a n s12 .211 .549 .4W y o m in g13 .113 .425 .6C a p it a l R e g io n1 3 81 0 .18 15 .84 53 .0A lb a n y6 52 2 .23 31 0 .22 16 .4C li n t o n11 .811 .8C o lu m b i a23 .836 .223 .5D e la w a r e113 .724 .212 .812 .824 .4F r a n k li n3 .7--F u lt o n12 .312 .3G re e n e25 .737 .3M o n tg o m e r y12 .47 .247 .82 61 7 .61 59 .943 .283 .710 .510 .52 51 6 .21 59 .842 .1S c h o h a r ie13 .9W a rre n46 .823 .6W a s h in g to n11 .911 .7S c h e n e c ta d y--4S a r a to g a--1 .0R e n s s e la e r---3R e g io n /C o u n ty-1O ts e g o--4 .6-R a t e s a r e p e r 1 0 0 , 0 0 0 r e s id e n t s a n d a g e - a d ju s t e d .Early Syphilis includes Primary Syphilis, Secondary Syphilis and Early Non-Primary Non-Secondary Syphilis.E a r ly N o n - P r i m a r yN o n -S e c o n d a ryS y p h i li sP r im a r y a n dS e c o n d a r y S y p h i li s-C e nBCCCHJLMOOOSTTR o cCLMOSSSWYH u dDOPRSUWL o nNSt r a l R e g io nro o m ea y u g ah e n a n g oo r t la n de r k im e re ffe rs o ne w isa d is o nn e id an o n d a g as w e g ot L a w re n c eio g ao m p k in sh e s t e r R e g io nh e m u n giv in g s to no n ro en ta r ioc h u y le re n e c ate u b e na y n ea te ss o n V a lle yu tc h e s sra n g eu tn a mo c k la n du lli v a nls t e re s tc h e s te rg Is la n da s s a uu f f o lkD ia g n o s e sR a teD ia g n o s e s7 .7.6.7.6.7.7112 22 02 4641181 27523933185235312621168396452112121R a te6 41 2D ia g n o s e s4 .16 .9-1252251 833299 14-211144474 44.1.3.3.3.8.2.9-1 1 .25 .74 .9-321.6.1.5.2.5.6.2.3.1.6.7---81 01 5664969982 .64611256 11 .4-1 8 32 95 751 931 55 52 3 31 1 81 1 56 .2-.5.1.3.6--31 127412.1.3.9.2.4.4.5.1.8.9.7-2 .25 .7-492242357758 2211R a te3 41 03 .25 .6--1U n k n o w n D u r a tio n o rL a t e S y p h i li s8 .82 .20 .71 7 31 22 063 41 478 01 6 06 69 473561 01 848556.4.9.1.8.5.4.1.3.6.0.314
T a b le 3 . E a r ly S y p h ilis b y R e g io n /C o u n ty a n d S e xN e w Y o rk S ta te , 2 0 1 9O ffic e o f S e x u a l H e a lth a n d E p id e m io lo g yM a leR e g io n /C o u n tyD ia g n o s e sF e m a leR a teD ia g n o s e sT o ta lR a teD ia g n o s e sM a leR a teR e g io n /C o u n tyR a teD ia g n o s e sT o ta lR a teD ia g n o s e sR a teN e wY o r k S ta te (N Y S )6 ,6 6 67 1 .65 3 15 .77 ,2 4 73 8 .61 2 21 5 .21 21 .41 3 48 .4N e wY o r k C it y ( N Y C )5 ,3 0 11 2 5 .83 1 47 .45 ,6 6 56 5 .4B ro o m e1 51 7 .743 .61 91 0 .7B ro n x1 ,1 6 01 7 3 .31 1 71 6 .51 ,3 0 09 2 .7C a y u g a11 .6--10 .8K in g s1 ,3 6 81 0 5 .27 35 .41 ,4 4 55 3 .3C h e n a n g o31 3 .6--37 .0N e w Y o rk1 ,8 4 32 0 8 .56 17 .01 ,9 2 21 0 6 .3C o r t la n d62 8 .2--61 4 .18 7 07 7 .15 65 .19 2 94 1 .0H e r k im e r41 2 .9--46 .56 02 6 .873 .36 91 5 .3J e ffe rs o n81 1 .3--86 .4N Y S e x c l. N Y C1 ,3 6 52 6 .22 1 74 .31 ,5 8 21 5 .3L e w is21 8 .1--29 .3B u ffa lo R e g io n1 1 81 6 .41 62 .31 3 49 .4M a d is o n41 0 .7--45 .3A lle g a n y14 .8--12 .3O n e id a1 51 3 .032 .61 88 .0C a tta r a u g u s38 .1--34 .1O n o n d a g a3 41 7 .131 .53 79 .1C h a u ta u q u a47 .6--43 .8O s w e g o46 .922 .864 .99 52 1 .51 0 91 2 .4S t L a w re n c e61 3 .5--67 .0G e n e s e e31 0 .335 .5T io g a31 3 .7--37 .0N ia g a r a99 .010 .81 05 .0O r le a n s12 .914 .323 .6W y o m in g21 2 .126 .51 7 82 5 .24 16 .22 1 9A lb a n y8 95 8 .696 .99 8C li n t o n26 .4--C o lu m b i a51 9 .7--D e la w a r e21 5 .1-F r a n k li n14 .6F u lt o n28 .9G re e n e31 5 .52O ts e g o31 0 .323 24 2 .3998 .32 33 0 .0Q u e e n sR ic h m o n dE r ieC a p it a l R e g io nR e n s s e la e rS a r a to g aS c h e n e c ta d yS c h o h a r ie-1 4-51 7 .6W a s h in g to n26 .6-1 73 3 .62 5 24 3 .1C h e m u n g61 6 .0-1 5 .9L iv in g s to n39 .8-3 2 .4M o n ro e2 2 46 4 .26 323 .6O n ta r io49 .1155 .551 0 .0S c h u y le r22 9 .2--21 4 .6-27 .4S e n e c a31 7 .9--39 .7--12 .8S te u b e n61 2 .7--66 .4--24 .6W a y n e38 .9--34 .51 0 .551 3 .0Y a te s17 .6--13 .56 .158 .2H u d s o n V a lle y3 6 73 4 .05 75 .64 2 42 0 .04 12 7 .5D u tc h e s s7 95 5 .01 61 1 .59 53 3 .994 .2O ra n g e9 04 8 .11 58 .51 0 52 8 .6P u tn a m61 3 .824 .189 .23 42 3 .943 .03 81 3 .6--1 2 .7--W a rre n3 .2C e n t r a l R e g io nD ia g n o s e sF e m a le-1 72 2 .44 02 6 .017 .813 .961 0 .423 .613 .4--T o m p k in sR o c h e s t e r R e g io nR o c k la n dS u lli v a nEarly Syphilis includes Primary Syphilis, Secondary Syphilis and Early Non-Primary Non-Secondary Syphilis.-1 71 6 .63 1 62 6 .8-68 .2-35 .12 8 74 0 .01 0 .81 7 .02 .151 1 .841 4 .691 3 .32 63 0 .634 .12 91 7 .81 2 72 9 .01 33 .21 4 01 6 .0L o n g Is la n d3 2 82 5 .12 72 .23 5 51 3 .7N a s s a u1 7 42 8 .01 52 .51 8 91 5 .3S u f f o lk1 5 42 2 .61 21 .91 6 61 2 .4U ls t e rW e s tc h e s te rR a t e s a r e p e r 1 0 0 , 0 0 0 r e s id e n t s a n d a g e - a d ju s t e d .6 415
T a b le 4 . P r im a r y a n d S e c o n d a r y S y p h ilis b y R e g io n /C o u n ty a n d S e xN e w Y o rk S ta te , 2 0 1 9O ffic e o f S e x u a l H e a lth a n d E p id e m io lo g yM a leR e g io n /C o u n tyD ia g n o s e sF e m a leR a teD ia g n o s e sT o ta lR a teD ia g n o s e sM a leR a teR e g io n /C o u n tyC e n t r a l R e g io nD ia g n o s e sF e m a leR a teD ia g n o s e sT o ta lR a te5D ia g n o s e s0 .7R a teN e wY o r k S ta te (N Y S )2 ,6 2 12 7 .92 3 12 .52 ,8 6 41 5 .26 57 .97 04 .3N e wY o r k C it y ( N Y C )1 ,8 6 44 3 .91 1 12 .71 ,9 8 72 2 .9B ro o m e77 .4--73 .8B ro n x3 8 05 5 .84 46 .44 2 93 0 .3C a y u g a11 .6--10 .8K in g s4 6 93 5 .82 11 .64 9 21 8 .1C h e n a n g o27 .3--23 .8N e w Y o rk6 6 27 5 .12 32 .46 8 93 8 .0C o r t la n d41 7 .1--48 .4Q u e e n s3 2 92 8 .62 02 .03 5 01 5 .3H e r k im e r41 2 .9--46 .5R ic h m o n d2 41 0 .931 .22 76 .1J e ffe rs o n34 .0--32 .3N Y S e x c l. N Y C7 5 71 4 .41 2 02 .48 7 78 .5M a d is o n24 .9--22 .4B u ffa lo R e g io n7 21 0 .391 .28 15 .8O n e id a1 08 .732 .61 35 .8A lle g a n y14 .8--12 .3O n o n d a g a1 78 .621 .11 94 .7C a tta r a u g u s25 .6--22 .8O s w e g o35 .0--32 .65 91 3 .76 67 .6S t L a w re n c e36 .7--33 .6G e n e s e e27 .123 .7T io g a13 .9--12 .0N ia g a r a77 .584 .2T o m p k in s81 7 .9--88 .812 .21 8 13 0 .72 2 51 8 .913 .1C h e m u n g24 .9--22 .539 .8--35 .14 6 .14 32 0 52 8 .41E r ieO r le a n sW y o m in g-71 .5-1-0 .814 .37 .41 1 41 6 .12 43 .81 3 81 0 .1L iv in g s to nA lb a n y5 93 9 .965 .06 52 2 .2M o n ro e1 6 2C li n t o n13 .2--11 .8O n ta r io24 .833 .4C o lu m b i a27 .2--23 .8S c h u y le r11 4 .6--17 .3D e la w a r e17 .5--13 .7S e n e c a29 .7--25 .1F u lt o n14 .4--12 .3S te u b e n61 2 .7--66 .4G re e n e21 0 .6--25 .7W a y n e26 .2--23 .1O ts e g o12 .2--11 .0Y a te s17 .6--13 .51 72 2 .72 61 7 .6H u d s o n V a lle y2 1 21 9 .72 92 .92 4 11 1 .4R e n s s e la e rS a r a to g aS c h e n e c ta d y87 .31 82 3 .6S c h o h a r ie31 0 .3W a s h in g to n13 .51 2 .7--W a rre nR a t e s a r e p e r 1 0 0 , 0 0 0 r e s id e n t s a n d a g e - a d ju s t e d .9-4 45 .4C a p it a l R e g io n-R o c h e s t e r R e g io n12 .183 .7D u tc h e s s5 63 9 .51 07 .26 62 3 .879 .22 51 6 .2O ra n g e4 32 2 .753 .04 81 3 .117 .813 .9P u tn a m35 .933 .113 .446 .8R o c k la n d1 71 2 .521 .51 97 .011 .9S u lli v a n49 .627 .468 .7U ls t e r1 31 5 .411 .21 48 .6W e s tc h e s te r7 61 7 .392 .28 59 .7L o n g Is la n d1 1 38 .590 .71 2 24 .6N a s s a u6 41 0 .171 .27 15 .7S u f f o lk4 97 .020 .35 13 .7--1 1 .7---16
T a b le 5 . E a r ly S y p h ilis b y S e x a n d A g eN e w Y o rk S ta te , 2 0 1 9O ffic e o f S e x u a l H e a lth a n d E p id e m io lo g yN e w Y o r k S ta te(N Y S )A g e (y rs )D ia g n o s e sN e w Y o r k C ity(N Y C )R a teD ia g n o s e sN e w Y o r k S ta te(N Y S )N Y S e x c l. N Y CR a teD ia g n o s e sR a teA g e (y rs )D ia g n o s e sN e w Y o r k C ity(N Y C )R a teM a leD ia g n o s e sN Y S e x c l. N Y CR a teD ia g n o s e sR a teT o ta l1 0 -1 420 .421 5 -1 91 2 82 1 .48 12 0 -2 46 7 71 0 6 .74 6 42 5 -2 91 ,4 0 01
The highest rates of STIs in NYS continued to be seen in young people, non-Hispanic black individuals, and men who have sex with men. Since chlamydia became a reportable STI in 2000, the number of diagnoses has dominated other reportable STIs. In 2019, it continued to be the most commonly reportable STI in NYS with 124,389