Transcription
Computers in Railways XIII227Process mining of train describer event dataand automatic conflict identificationP. Kecman & R. M. P. GoverdeDepartment of Transport and Planning,Delft University of Technology, The NetherlandsAbstractData records from train describer systems are a valuable source of informationfor analysing railway operations performance and assessing railway timetablequality. This paper presents a process mining tool based on event data recordsfrom the Dutch train describer system TROTS, including algorithms developedfor the automatic identification of route conflicts with conflicting trains, arrivaland departure times/delays at stations, and train paths on track section andblocking time level. Visualisations of the time-distance diagrams and blockingtime diagrams support the analysis of incidents, track obstructions, disruptions,and structural errors in the timetable design.Keywords: train describers, realisation data, route conflict, delay, blocking timediagram, timetable quality, operations performance analysis.1 IntroductionImproving the performance of railway infrastructure and train services is the corebusiness of railway infrastructure managers and railway undertakings. Traindelays decrease capacity, punctuality, reliability and safety, and should beprevented as much as possible.Dense railway operations require feedback of operations data to improveplanning and control. Typically, train delays at stations are monitored andregistered online using train detection, train describers, and timetable databases,but the accuracy is insufficient for process improvements, and in particular,delays due to route conflicts are hard to recognize from delays at stations.Accurate data on the level of track sections and signal blocks are required to gaina better understanding of the realized train paths and conflicts between them.WIT Transactions on The Built Environment, Vol 127, 2012 WIT Presswww.witpress.com, ISSN 1743-3509 (on-line)doi:10.2495/CR120201
228 Computers in Railways XIIITrain describer records are a main source of infrastructure event data such asoccupations and releases of track sections and aspect changes of signals. Theseinfrastructure events can be matched to train number events that are also storedin these files to recover the realized train paths on track section level. Moreover,the realized blocking time diagrams can be derived by adding a process model ofthe signalling logic. This process mining approach has been implemented for thelog files of the Dutch train describer system TROTS. The resulting railwayoperations performance analysis tool recovers and visualizes the realized trainpaths, blocking times, and path conflicts, and thus provides essential informationfor the analysis of railway operations that can be used for fine-tuning the railwaytimetable and operational processes. The tool supports both tabular output forstatistical analysis, such as discussed in Goverde and Meng [1], andvisualisations of the realized time-distance and blocking time diagrams withhigh-lighted train path conflicts.In earlier work, Daamen et al. [2] developed algorithms for automatic routeconflict identification based on data records of the Dutch train describer systemTNV, which were implemented in the tool TNV-conflict. Goverde and Meng [1]developed the tool TNV-Statistics for a detailed statistical analysis of trainrealisation data based on the output files of TNV-Conflict. The TNV system wasrecently replaced by the new train describer system TROTS which contains anessential new approach to train number steps, and this came with a new formatfor the log files. In particular, train number steps are no longer given with respectto a route block to a next signal, but at section level. This means that a trainnumber step no longer ‘predicts’ to which signal the train is heading, as wascustomary with TNV, and therefore we cannot just look ahead at the signalaspect of the signal at the end of a block to identify a conflict. Therefore, thealgorithms described in Daamen et al. [2] had to be modified in a way describedin the present paper. Moreover, several improvements have been implementedsuch as interpolating blocking times over non-logged signals so that routeconflict identification is applicable over entire corridors, including ‘darkterritories’ with aggregated track sections. The output of the new tool has thesame format as that of TNV-Conflict by which TNV-Statistics is still applicable.Other approaches to train delay data mining include Conte [3] and Flier et al. [4]for determining systematic dependencies between delays in Germany andSwitzerland, respectively, and Cule et al. [5] for identifying frequent delaypatterns in Belgium.The remainder of the paper is structured as follows. The Dutch train describerlog files and their data structure are explained in Section 2. Section 3 explainsthe main algorithm and subroutines of the tool, followed by a case study with adescription of the GUI in Section 4. Section 5 gives a brief summary andpresents further application of train describer data in the framework of on-goingresearch about model-predictive railway traffic management [6].WIT Transactions on The Built Environment, Vol 127, 2012 WIT Presswww.witpress.com, ISSN 1743-3509 (on-line)
Computers in Railways XIII2292 Train describer systemsTrain describer systems keep track of train positions based on train numbers andmessages received from elements of the signalling and interlocking systems(sections, switches and signals) [7]. One of the tasks of train describers islogging the generated train number messages and the incoming infrastructureelement messages, resulting in chronologically ordered lists of infrastructure andtrain number messages.2.1 The Dutch train describer TROTSIn the Dutch train describer system TROTS, the train steps are recorded on thelevel of track sections, with both a message when a new track section is occupiedby a train and when a track section is released by a train. Hence, train numberstep messages are coupled to track section messages.The Dutch railway network has been divided into multiple TROTS areaswhich each comprise one or more major station areas with complex topologiesand 30–40 km of surrounding railway infrastructure. In order to reconstruct thetrain traffic over multiple TROTS areas it is necessary to merge thecorresponding log files. TROTS log files are archived per day and area in largefiles of ASCII format of approximately 75 MB.Infrastructure messages contain the following information: timestamp, eventcode, element type (section, signal, point), element name, and new state(occupied/released, stop/go, left/right). The train number step messages containamongst others a timestamp, event code, train number, and a sequence of alloccupied track sections. Each successive train number step message containseither a new occupied track section at the front or a released track section at therear. The event code of a train number step corresponds to a section messagewith the same event code. This coding is used to match a message about asection occupation or release with a message of a train number step.2.2 Shortcomings in TROTS log filesThere are several issues in the TROTS log files that represent a potential sourceof inaccuracy and complicate performance analysis. The system architecture [8]reveals that infrastructure messages and train number step messages aregenerated by different components of the system which sometimes results in asignificant difference between the timestamps of corresponding messages.Experiments show delays of up to seven seconds of the train number stepmessages. In order to avoid possible inconsistencies, the developed tool does notuse the timestamps of the train number step messages but only the ones of thecorresponding infrastructure element messages.Furthermore, infrastructure messages of a signal aspect change to ‘stop’cannot be coupled directly to any train number step or section occupationmessage. In order to overcome this, an additional input file is created in the formof a list of all signals together with the first section they protect by data miningthe files in a pre-processing step. We use this input in the main algorithm toWIT Transactions on The Built Environment, Vol 127, 2012 WIT Presswww.witpress.com, ISSN 1743-3509 (on-line)
230 Computers in Railways XIIIidentify the train number that caused the signal aspect change via thecorresponding section that got occupied.Other sources of inaccuracy are the automatic block signals on the open trackwhich are not logged. Without intermediate logged signals, an open trackbetween two stations looks as one block from the exit signal at the station ofdeparture to the home signal at the station of arrival, and headway conflictscould not be identified. Moreover, open tracks may contain aggregated tracksections which are occupied and released as one. We therefore defined anadditional input file containing a list of automatic block signals on the opentracks together with the corresponding (aggregated) sections listed by individualsections and their lengths. If a non-logged signal is at the boundary of two(aggregated) sections then the occupation of the following (aggregated) section isused as stop aspect event time. Otherwise, three-aspect two-block signallinglogic is simulated to estimate aspect changes of non-logged signals onaggregated sections. In this case, the event time of the stop aspect change isestimated by the occupation time of the corresponding protected section, whichis derived as a fraction of the running time of the train over the aggregatedsection proportional to the ratio of the distance to the signal and the length of theaggregated section.3 Automatic route conflict identificationSignal passages are events that initiate processes such as blocking a part of theinfrastructure and running over a block. Each complete train run can thus berepresented as a graph built online by sweeping through the log file. Alsoconflicts can be identified simultaneously by determining relationships betweenevents. This section presents the main algorithm that passes through the TROTSlog file once to reconstruct the movements of all trains that operated in thecorresponding area whilst simultaneously deriving a list of all route conflicts thatoccurred.The following input is used: TROTS log file Infrastructure lists (signals with protected sections, aggregated sectionsand lengths) Operational timetable List of platform track sections.The first two inputs were explained in the previous section and the latter twoare necessary to derive delays from the realized event times, handle routeconflicts of departing trains from stations, and to distinguish between longoccupation times of platform track sections in stations (due to scheduled stops)and other sections (due to e.g. infrastructure or vehicle failures).An object-oriented approach is used to store the relevant data from the logfiles in infrastructure and train number objects which enables the algorithm torevisit the objects, and use and update the information therein [2]. Each section,signal, and train in the log file is an object, attributed by a chronologically sortedlist of activities. The algorithm visits all messages and for each signal, section ofWIT Transactions on The Built Environment, Vol 127, 2012 WIT Presswww.witpress.com, ISSN 1743-3509 (on-line)
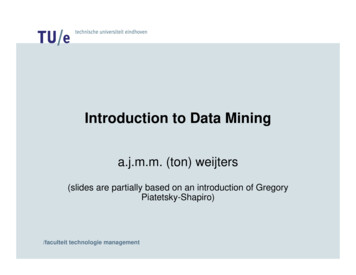
Computers in Railways XIII231train number message, the corresponding objects are updated with a time stampand the train number (for section/signal objects) or infrastructure element id (fortrain objects).The algorithm is implemented in Matlab and based on process mining, aconcept of analysing processes based on event logs [9]. Blocking time theory[10] and the operational timetable provide the logic for building the processmodel.3.1 The main algorithmThe main loop is initiated when the algorithm comes across a message reportinga section occupation. Figure 1 shows a flowchart of the main loop withembedded subroutines which will be explained in Section 3.2. After all objectshave been updated, the first branching makes a distinction between sectionsprotected by a signal (first section in a block) and others. The second decisionlevel initiates different subroutines depending on whether the train is departingfrom a station or not. Registered conflicts with the identified hindering train arebeing stored in the output closedConflict. On the other hand, registered conflictswith an unidentified hindering train, are stored in the list openConflict which isused to identify hindering trains as the train progresses along the protected blocksection after the conflict.Figure 1:Main conflict identification loop.WIT Transactions on The Built Environment, Vol 127, 2012 WIT Presswww.witpress.com, ISSN 1743-3509 (on-line)
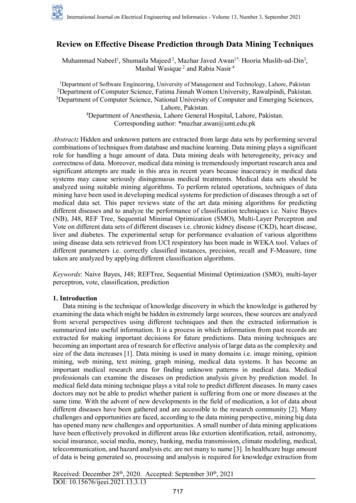
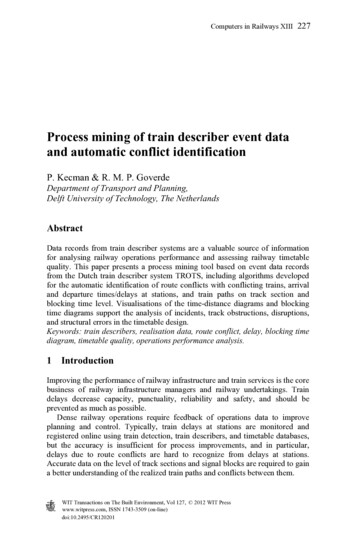
232 Computers in Railways XIII3.2 SubroutinesThis subsection gives a description of the subroutines that capture the main logicof the process mining method for automatic conflict registration. Figure 2 depictsa small part of an example network, which is used to illustrate the subroutines.The example network contains three signals (S1, S2, S3), six track sections(TS1-TS6) and a train that has just entered TS4.Figure 2:Illustrative example of a part of some railway network.3.2.1 Register route conflict (registerConf)A route conflict occurs when a train movement is restricted by a stop signalbecause the protected block section is occupied by another train. The subroutineregisterConf checks the aspect shown by the signal at the end of the block at thetime when the train was at the sight distance of the signal protecting the block.When the train passes signal S2 (Figure 2), the subroutine compares the lastrelease time (change to ‘go’ aspect) rel of S2, with the time sight that the trainwas at the sight distance of signal S1. For the latter time we subtract a constantsight and reaction time of 12 s from the passing time of S1 [10]. A conflict hasoccurred when the following condition has been met:if t S2relt S1sightconflict registered(1)3.2.2 Identify hindering train (identifyHindering)As the hindered train progresses along the block protected by the signal ofconflict (S2), identifyHindering compares the previous release time rel of eachsection belonging to the block (TS4, TS5, TS6 in Figure 4) with the time that thehindered train was at sight distance from the approach signal before the signal ofconflict (S1, Figure 4). The train number that released the section for which (2)holds is the hindering train:ifrelsight ,4,5,6hindering train registered(2)3.2.3 Get event times (getEventTimes)This routine derives the arrival and departure times from TROTS logfiles. Whena train passes an exit signal after a scheduled stop, getEventTimes is initiated. Itdetermines the period of standstill as the longest time gap between successivetrack section (occupied and release) messages of the relevant train. The time ofthe last section message before the standstill is set as the arrival time and thetime of the first section message after the standstill is the departure time.WIT Transactions on The Built Environment, Vol 127, 2012 WIT Presswww.witpress.com, ISSN 1743-3509 (on-line)
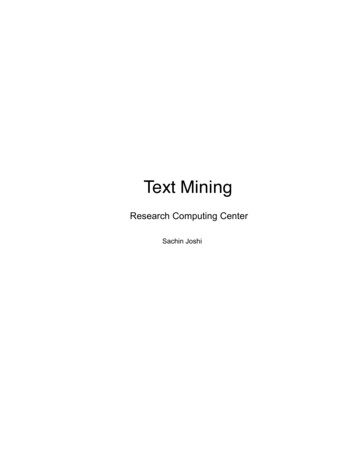
Computers in Railways XIII233Note that the error of this arrival (departure) time estimate depends on thenumber of platform track sections and the distance between the stop location ofthe rear (front) of the train and the used section border.3.2.4 Detect departure conflict (registerDepartureConf)After the arrival and departure times have been derived, theregisterDepartureConf subroutine checks whether the departing train was avictim in a route conflict. We assume here that the departing train was hinderedif the exit signal was showing ‘stop’ at the scheduled departure time (if the trainhad no arrival delay) or after the minimum dwell time has passed since thearrival time (if the train arrived with a delay).ifmaxarrschedmindwell , depconflict registered(3)This subroutine lists all candidates for outbound route conflicts. Extendeddwell times in stations can not directly be explained by route conflicts. In orderto exclude the trains that waited for a feeder train to realize a connection, or theones that had extended dwell time for some other reason, additional informationfrom signallers and dispatchers is necessary.4 Case studyThis section illustrates the application of the presented algorithm on one day oftraffic (2nd April 2010) in the TROTS areas of The Hague and Rotterdam. Thealgorithm sweeps through the merged log files of the two areas and reconstructsthe realized train paths of 2048 trains on the level of track sections. Moreover,all occupation times of 1396 track sections and all blocking times of 733 blocksare determined, as well as the aspect changes of 624 signals and the arrival anddeparture time estimates of all trains at 21 stations. Finally, 1011 route conflictswere registered.4.1 Graphical user interfaceIn order to simplify the analysis of this output, a GUI was created (Figure 3). Theleft part of the GUI contains tabbed panels for loading data (top left panel),visualisation control (top right) and displaying results in tables (lower panel).The right part of the GUI is reserved for the visualisation of traffic in either timedistance or blocking time diagrams. The tabbed panel for loading data enablesthe user to either load the raw data and start the algorithm or load alreadyprocessed data and display the results. In the lower tabbed panel the user canchoose which results to display. In the tab Trains (Figure 4), a train line can beselected from the popup menu which enables selecting a train from the chosenline. We can then select the whole train path or a part of it by selecting a startand end station.The results are then displayed in the tables on the left and the visualisationpanel on the right. The selected part of the train route is visualized together withall other trains that operated on the selected corridor 15 min before and after theWIT Transactions on The Built Environment, Vol 127, 2012 WIT Presswww.witpress.com, ISSN 1743-3509 (on-line)
234 Computers in Railways XIIIFigure 3:Figure 4:Graphical user interface.Train selection panel.WIT Transactions on The Built Environment, Vol 127, 2012 WIT Presswww.witpress.com, ISSN 1743-3509 (on-line)
Computers in Railways XIII235selected train. The tables are the list of conflicts in which the selected trainparticipated, the running times on all sections, the blocking times, and actualarrival and departure times.The panel Infrastructure (Figure 5) enables the user to choose the corridorand the time interval and get the corresponding list of conflicts, list of sections,signals, blocks, and stations that were utilized by trains on the corridor within theselected time interval. Selection of the infrastructure element from thecorresponding popup menu displays all the state changes of that element with theassociated train number and time instants (in seconds from midnight).The visualisation control panel (upper right panel Figure 3) enables the userto switch between the blocking time diagram and time-distance diagram oftraffic on the selected corridor and time interval. Also it is possible to turn on/offFigure 5:Infrastructure selection panel.WIT Transactions on The Built Environment, Vol 127, 2012 WIT Presswww.witpress.com, ISSN 1743-3509 (on-line)
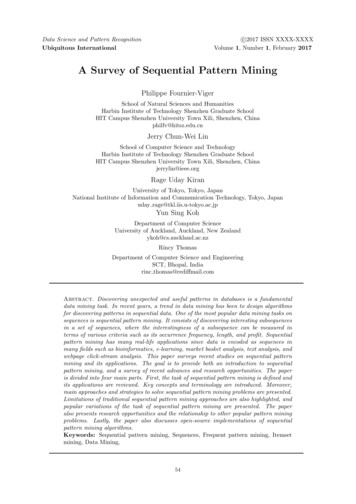
236 Computers in Railways XIIIthe zoom and pan tools and rotate the axis of the diagrams. Finally the selectionof the checkbox Scheduled also visualises the scheduled train paths.Figure 6 shows the time-distance diagram on the busy corridor between TheHague HS and Rotterdam in the Netherlands between 9:00 and 9:40 A.M. Thenumber of tracks between the stations is indicated as well as the conflicts (redsquares on the hindered train path at the location of the signal of conflict).Intercity trains are presented in blue colour and local trains in magenta.Figure 6:Time distance diagram.Figure 7 displays the corresponding blocking time diagram for one directionthat appears after selecting the appropriate radio button on the visualisationcontrol panel. Overlaps in blocking times indicating conflicts are denoted by ared colour (or very dark in grayscale). Note that trains on parallel tracks of fourtrack lines may overtake each other. Blocking times that appear to beoverlapping but are not shown in red (darker) are parallel processes withoutconflict.WIT Transactions on The Built Environment, Vol 127, 2012 WIT Presswww.witpress.com, ISSN 1743-3509 (on-line)
Computers in Railways XIIIFigure 7:237Blocking time diagram.5 Summary and outlookIn this paper we presented a tool for automatic conflict identification based ontrain describer data and illustrated its usefulness for identifying systematic delaydependencies and analysing delays during incidents and severe disruptions. Thetool is compatible with the Dutch train describer system TROTS. Applicabilityfor other train describer systems strongly depends on their data structure.Further developments are mainly directed towards automatic analysis byproviding useful statistical indicators for structural flaws in the timetable, as wellas detecting severe disruptions and identifying primary delays, see also Goverdeand Meng [1].Another stream of research within mining and analysis of train realisationdata, focuses on deriving accurate predictions of process times within themonitoring and short-term prediction component of a model-predictive controllerfor railway traffic management [6]. We aim at exploiting advanced statistical andWIT Transactions on The Built Environment, Vol 127, 2012 WIT Presswww.witpress.com, ISSN 1743-3509 (on-line)
238 Computers in Railways XIIImachine learning methods to capture complex dependencies between processtimes in heavily utilized railway networks. The developed tool presented in thispaper is the basis for this on-going work.AcknowledgementThis paper is a result of the research project funded by the Dutch TechnologyFoundation STW: “Model-Predictive Railway Traffic Management” (projectno. 11025).References[1] Goverde, R.M.P. and Meng, L., Advanced monitoring and managementinformation of railway operations. Journal of Rail Transport Planning andManagement, article in press, 2012.[2] Daamen, W., Goverde, R.M.P. and Hansen, I.A., Non-discriminatoryautomatic registration of knock-on train delays. Networks and SpatialEconomics, 9(1), pp. 47–61, 2009.[3] Conte, C., Identifying Dependencies among Delays, PhD thesis, GeorgAugust Universität Göttingen, 2007.[4] Flier, H., Gelashvili, R., Graffagnino, T. and Nunkesser, M., Miningrailway delay dependencies in large-scale real-world delay data. In: R.K.Ahuja, R.H. Möhrung and C.D. Zaroliaglis (Eds.), Robust and OnlineLarge-Scale Optimization, Lecture Notes in Computer Science, vol. 5868,Springer: Berlin, pp. 354–368, 2009.[5] Cule, B., Goethals, B., Tassenoy, S. and Verboven, S., Mining train delays.Proceedings of the 4th International Seminar on Railway OperationsModelling and Analysis (RailRome 2011), Rome, Italy, 2011.[6] Kecman, P., Goverde, R.M.P. and Van den Boom, T.J.J., A modelpredictive control framework for railway traffic management. Proceedingsof the 4th International Seminar on Railway Operations Modelling andAnalysis (RailRome 2011), Rome, Italy, 2011.[7] Exer, A., Rail traffic management. In: C. Bailey (Ed.), European RailwaySignalling, IRSE, A and C Black: London, pp. 311–342, 1995.[8] ProRail, TROTS protocol – interface design description (in Dutch), Utrecht,2008.[9] Van der Aalst, W.M.P., Process Mining: Discovery, Conformance andEnhancement of Business Processes, Springer: Heidelberg, 2011.[10] Hansen, I.A. and Pachl, J. (Eds.), Railway Timetable and Traffic: Analysis,Modelling, Simulation, Eurailpress: Hamburg, 2008.WIT Transactions on The Built Environment, Vol 127, 2012 WIT Presswww.witpress.com, ISSN 1743-3509 (on-line)
Data records from train describer systems are a valuable source of information for analysing railway operations performance and assessing railway timetable quality. This paper presents a process mining tool based on event data records from the Dutch train describer system TROTS, including algorithms developed