Transcription
Green Light StudyEconomic and ConservationBenefits of Low-Impact SolarSiting in CaliforniaNovember 2019.KOIN Center222 SW Columbia StreetSuite 1600Portland, OR 97201201 Mission Street #4San Francisco, CA 94105
AuthorshipThe primary authors of this report are:Stephanie Dashiell, California Energy & Land Use Project Director, The Nature ConservancyDr. Mark Buckley, Partner/Senior Economist, ECONorthwestDr. Dustin Mulvaney, Associate Professor, Environmental Studies Department, San Jose StateUniversityAdditional contributions were provided by staff at The Nature Conservancy: Sarah Heard, SophieParker, Erica Brand, Laura Crane, Nels Johnson, Brian Cohen, Dick Cameron, Marcela Ochoa; andstaff at ECONorthwest: Marcy Shrader-Lauinger and Virginia Wiltshire-Gordon.Suggested citation:Dashiell, S.; Buckley, M.; Mulvaney, D. Green Light Study: Economic and Conservation Benefits ofLow-Impact Solar Siting in California, 2019.AcknowledgmentsEssential input was provided by a selection of interviewees from the California state and the federalgovernment as well as the solar industry. Additional review and input on the report was provided byKate Kelly (Kelly Group), Emily Leslie (Energy Reflections), and Natasha Keefer (Clean PowerAlliance of Southern California).DisclaimerECONorthwest and The Nature Conservancy are responsible for the content of this report. Thestaff at ECONorthwest and The Nature Conservancy along with Dustin Mulvaney prepared thisreport based on their knowledge of conservation, economics, and economic development and oninformation derived from government agencies, private statistical services, the reports of others,interviews of individuals, or other sources believed to be reliable. ECONorthwest and The NatureConservancy have not independently verified the accuracy of all such information and make norepresentation regarding its accuracy or completeness. Any statements nonfactual in natureconstitute the authors’ current opinions, which may change as more information becomesavailable.2
Table of ContentsAUTHORSHIP2ACKNOWLEDGMENTS2DISCLAIMER2KEY CONCEPTS AND ACRONYMS41ABSTRACT62INTRODUCTION73BACKGROUND LITY-SCALE SOLAR ENERGY CASE STUDY PHY OF USSE IN CALIFORNIAIMPACTS OF USSE PROJECTSUSSE PERMITTING PROCESSLANDSCAPE-SCALE PLANNING FOR USSETHE POLICY AND MARKET DRIVERS FOR USSESOLAR ELECTRICITY COSTLAND COSTSSELECTING USSE PROJECT CASE STUDIESBIODIVERSITY VALUE CATEGORY ASSIGNMENTCOST ESTIMATIONUSSE CASE STUDY RESULTS4.4.1 Permitting Costs and Timeframe4.4.2 Compensatory Mitigation and Habitat Management CostsCASE STUDY ANALYSIS DISCUSSION4.5.1 Limitations of Case Study Analysis4.5.2 RecommendationsSTAKEHOLDER INTERVIEWS285.128KEY PENDIX A. REGIONAL MAPSAPPENDIX B. LANDSCAPE-SCALE PLANNING FOR USSE RESOURCESAPPENDIX C. SOLAR ENERGY TAX INCENTIVES3942443
Key Concepts and AcronymsKey ConceptsEcological impacts—The suite of impacts to biodiversity and ecological systems that result fromthe development of solar energy projects.Economic benefits and costs—The benefits and costs that accrue to developers (and, as aresult, energy buyers) with budgetary implications. These benefits have direct implications for thefinancial bottom line.Biodiversity value—The degree of diversity of plants and animals, and habitat for multiplespecies, provided at a specific location. Areas of high biodiversity value have been prioritized forconservation, based on analyses completed by The Nature Conservancy.Low impact siting—The siting of renewable energy projects in areas that have been identified ashaving low biodiversity value based on analyses of the Mojave and Sonoran Deserts and the SanJoaquin Valley by The Nature Conservancy and other environmental stakeholders.AcronymsACECArea of Critical Environmental ConcernBLMBureau of Land ManagementBOBiological OpinionCCACommunity Choice AggregationCDCACalifornia Desert Conservation AreaCDFWCalifornia Department of Fish and WildlifeCDOCCalifornia Department of ConservationCDOFCalifornia Department of ForestryCECCalifornia Energy CommissionCESACalifornia Endangered Species ActCEQACalifornia Environmental Quality ActDOIDepartment of the InteriorDRECPDesert Renewable Energy Conservation Plan4
EAEnvironmental AssessmentEIREnvironmental Impact ReportEISEnvironmental Impact StatementEOExecutive OrderEPAEnvironmental Protection AgencyESAEndangered Species ActFEISFinal Environmental Impact StatementFERCFederal Energy Regulatory CommissionFLPMAFederal Land Policy and Management Act of 1976FWSU.S. Fish and Wildlife ServiceGWGigawattIOUsInvestor Owned UtilitieskVKilovoltLBNLLawrence Berkeley National LaboratoryMWMegawattNEPANational Environmental Policy Act of 1969PEISProgrammatic Environmental Impact StatementPPAPower Purchase AgreementPVPhotovoltaicRODRecord of DecisionROWRight-of-WayRPSRenewable Portfolio StandardsUSDAU.S. Department of AgricultureUSSEUtility-Scale Solar EnergyWWattWECCWestern Electricity Coordination Council5
1 AbstractThe Green Light Study evaluated publicly available information to explore if there is an economicbenefit to low-impact siting of solar energy projects in California. In gathering this information, wedocumented the factors and conditions that may increase, decrease, or outweigh such benefit. Thisstudy included analysis of existing data and literature, interviews with key industry experts, and acase study analysis of 16 utility-scale solar projects in California which collectively represent morethan 40 percent of total in-state solar capacity as of December 2018. For the project locations weassessed, the case study analysis indicated that average permitting timeframes, habitat mitigationrequirements, and habitat mitigation costs differ across biodiversity value categories associatedwith project location. Specifically, utility-scale solar projects sited in areas of high biodiversity wereassociated with habitat mitigation costs that are greater than those for low biodiversity value siting.Collectively, the cost savings of siting projects in areas of low biodiversity value could be in therange of 7–14 percent of overall project costs. These habitat-related economic benefits of lowimpact solar are one of many cost considerations that drive site selection decisions. Based oninterviews with representatives associated with developing, permitting, or purchasing solar energyprojects in California, some other considerations for solar energy facility site selection are: proximity and ability to interconnect to transmission; ability to secure a power purchase agreement; permitting factors, including certainty in securing land-use entitlements; environmentalreview; civil, environmental, and regulatory issues; and local jurisdiction requirements; land price; and predetermined zones for renewable energy development, where established, includingfederal, state, or county zoning and other preidentified least-conflict lands.While threatened and endangered species habitat was identified as a factor in site selection,biodiversity value more broadly was not consistently identified by all interviewees. The synthesis ofdata and information in this study suggests that integrating information from biodiversityassessments into site selection decisions could yield both economic and conservation benefits andprovide more certainty in accelerating renewable energy deployment.6
2 IntroductionThe transition from fossil fuels to renewable energy resources is necessary to address climatechange but may contribute to social and environmental conflicts due to changing land-use patterns.Looking at solar energy in California, the California Energy Commission (CEC) has documentedmore than 700 solar power plants greater than 1 megawatt (MW) in size operating in California,with a total installed capacity near 12,000 MW.1 This level of solar development comes with landuse conversion and associated ecological impacts. These impacts vary across landscapes, as thebiodiversity value of project sites ranges from high quality habitat for endangered, threatened, andspecial status species to areas with less ecological function such as brownfields, abandoned mines,agricultural fields, and retired landfills. Some utility-scale solar energy (USSE) projects inCalifornia have been sited on lands with high biodiversity value. This has resulted in project delaysand cancellations, costly compensatory mitigation requirements, resistance from environmentalgroups, and, in some cases, litigation.State renewable portfolio standards (RPSs), new forms of electricity procurement such ascommunity choice aggregation (CCA), and direct renewable energy purchases by organizations andcorporations are driving new investments in renewable energy. California’s ambitious plan to relyonly on zero-carbon electric power by 2045 (100 Percent Clean Energy Act, Cal. SB 100, Cal. Stat2018) will put more pressure on landscapes to carve out space for solar energy facilities to meet thestate’s policy goals. The Nature Conservancy’s recent report, Power of Place: Land Conservation andClean Energy Pathways for California, found that California can significantly ramp up renewableenergy and limit ecological impacts by integrating conservation information up front.While the ecological impacts of siting USSE projects in areas with high biodiversity value have beenwidely documented (Hernandez et al., Solar energy development, 2015; Lovich and Ennen, 2011), theprivate economic impacts associated with USSE projects sited in areas of high biodiversity valuehave not been evaluated comprehensively, as these costs are not easily accessible to the public. TheGreen Light Study is the first initiative to evaluate publicly available information to explore if thereis an economic benefit to developers from low-impact siting of solar energy projects in California.The Green Light Study includes three components: (1) synthesis of existing backgroundinformation, including quantitative and spatial data on ecosystems, land use, and land coverassociated with USSE projects; (2) case study analysis of 16 USSE projects on lands with either highor low biodiversity value; and (3) interviews with developers, public natural resource agencyrepresentatives, and solar industry experts.The trends documented in the Green Light Study indicate that building solar energy facilities inareas of low biodiversity value could help California maintain the pace and scale of renewableenergy development needed to address the urgent challenge of climate change while also protectingthe state’s important lands and waters and minimizing costs.1See the California Energy Commission’s les data/solar/index cms.php.7
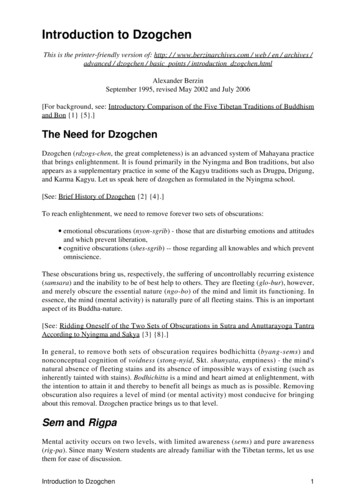
3 Background Information3.1 Geography of USSE in CaliforniaCalifornia leads the country on USSE installations and has for the last decade (SEIA, 2019). USSEhas been growing rapidly in California due to high solar insolation, declining costs of photovoltaicpanels, and policy drivers such as California’s Renewable Portfolio Standard. Most of thedevelopment in California has occurred in the southern portion of the state, where there is thehighest average daily solar resource (both direct normal irradiance and global horizontalirradiance).2 The counties with the highest level of installed capacity—Kern, San Bernardino,Riverside, Imperial—are located in the southern portion of the San Joaquin Valley and the desertregion of the state (Figure 2 and Figure 3 and Appendix A). USSE projects are generally located nearmajor transmission corridors, particularly the larger projects.By measures of both acreage and installed capacity, the majority of USSE projects in California aresited on private lands (Figure 1). Solar projects on private land are primarily in areas previouslyused for farming, both irrigated and non-irrigated agriculture, specifically in the San Joaquin Valleyregion. As California implements its Sustainable Groundwater Management Act, which will cutagricultural water use, some agricultural lands will likely continue to transition to solar due towater scarcity.There was a peak in solar energy development on lands managed by the Bureau of LandManagement (BLM) in the early 2010s, which was largely a result of funding provided by theAmerican Recovery and Reinvestment Act of 2009 (White House Council of Economic Advisors,2016). Land-ownership information is key to understanding the ecological impacts of project siting.This is because in the California desert publicly owned lands are generally of higher biodiversityvalue than privately owned lands (Randall et al., 140PrivateFederalOther Public LandsFigure 1. USSE Capacity Built by Land Ownership in California (MW)Note: Federal generally refers to Bureau of Land Management (BLM) lands, and other public lands are state and local. As of 2016.Source: California Energy Commission (CEC) (2016); California Department of Forestry (CDOF) (2018).2National Renewable Energy Laboratory Geospatial Data Science: Solar Maps—https://www.nrel.gov/gis/solar.html.8
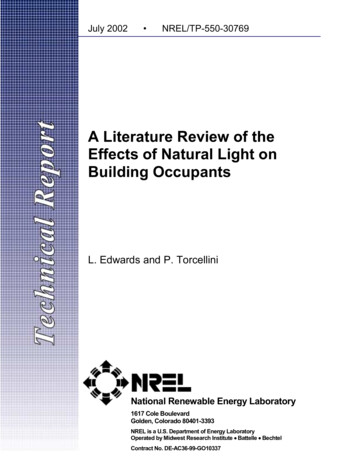
Figure 2. USSE Siting GeographySource: CEC (2016); Public land ownership data from California Department of Forestry (CDOF) (2018).Note: Private land includes land not owned by public agencies. Circles representing power plants are proportional in size to the MWproduced by the power plant. Major transmission lines are defined as lines of 500 kilovolts (kV) or more.9
IdahoOregonNevadaUtahSanJoaquinValleyCEC SolarPower Plants MW150MojaveDesert500ArizonaMajor Transmission LinesIrrigated FarmlandNon-Irrigated and GrazingFarmlandVacant or Disturbed LandNon-Agriculture LandState and Local OwnershipFederal OwnershipOther Private0100 MilesMexicoFigure 3. California USSE Map by Agricultural Land UseSource: CEC (2016); CDOF (2018); California Department of Conservation (CDOC) (2016); Western Electricity Coordination Council(WECC) (2014).Note: Public lands are only displayed where there is no Important Farmland. Other areas consist of private land that is not ImportantFarmland. Private land includes land not owned by public agencies. Circles representing power plants are proportional in size to the MWproduced by the power plant. Major transmission lines are defined as lines with voltage of 500 kV or more. Vacant or Disturbed Landincludes open field areas that do not qualify for an agricultural category, mineral and oil extraction areas, off-road vehicle areas, electricalsubstations, channelized canals, and rural freeway interchanges.10
3.2 Impacts of USSE ProjectsThe largest USSE projects, some occupying several thousand acres of land, pose a variety ofchallenges for the long-term protection of biodiversity. For a discussion of the biodiversity valuesthat may be threatened by the development of USSE projects in the Mojave Desert, please seeRandall et al. (2010). For the Sonoran Desert, please see Conservation Biology Institute and TheNature Conservancy (2009). For the San Joaquin Valley, please see Butterfield et al. (2013).Impacts to biodiversity associated with USSE development include, but are not limited to, habitatloss, habitat fragmentation, and loss of landscape connectivity. These impacts present significantchallenges to biodiversity conservation as the climate changes and populations of species need tomigrate in response. In at least two parts of the California desert—the western Mojave Desert andIvanpah Valley—USSE and wind facilities have been responsible for the majority of land-use changeand habitat degradation over the past decade (Parker et al., 2018). Additionally, there are numerousthreatened, endangered, and special status species directly or indirectly impacted by USSE projectdevelopment, several of which require special monitoring and management plans (see Table 1).Some projects require eviction or translocation of species, for which long-term monitoring of theirsurvival is required.On agricultural lands, biodiversity impacts vary by crop type and geography. In some areas, avianspecies, such as burrowing owl, mountain plover, or Swainson’s hawk, use agricultural lands forforaging habitat that may be displaced by solar facilities.Table 1. Species habitat mitigation and management requirements documented in the 16 case studyUSSE projects examined in this report.Compensatory mitigationrequirementHabitat monitoring andmanagement plansXXXXXXXXXSpeciesAmerican badgerBighorn sheepBlunt-nosed leopard lizardBurrowing owlCalifornia condorCouch’s spadefoot toadDesert tortoiseFlat-tailed horned lizardFoxtail cactusFringe-toed lizardGolden eagleMohave ground squirrelMountain ploverNelson’s antelope groundsquirrelPronghorn antelopeSan Joaquin kit foxSpecial status batsSwainson’s hawkTule elkXXXXXX (foraging habitat)XXXXXXX (roosting habitat)X (foraging habitat)11XXXX
Other Natural FeaturesCreosote bush scrubDesert dry wash woodlandEphemeral washUpland scrublandVernal poolXXXXX3.3 USSE Permitting ProcessMany of the ecological impacts associated with USSE projects are documented in the permittingand environmental review documents associated with each proposed project. Permittingrequirements for USSE facilities can vary across jurisdictions and land ownership. On private landsin California, USSE projects are subject to both environmental review under the CaliforniaEnvironmental Quality Act (CEQA) and compliance with the California Endangered Species Act(CESA). For projects on BLM-managed public land, the BLM leases public lands to solar developersby granting right-of-way (ROW) permits under the Federal Land Policy and Management Act(FLPMA).3 Federal leasing decisions trigger environmental review under the NationalEnvironmental Policy Act (NEPA). Projects on both public and private lands must comply withother relevant state and federal laws and policies (e.g., the Antiquities Act, the Endangered SpeciesAct (ESA), the Migratory Bird Treaty Act, the Bald and Golden Eagle Protection Act, California’sLake and Streambed Alteration Program, and the National Historic Preservation Act, amongothers).When impacts from a USSE project are unavoidable, the environmental impact review processrequires that a USSE project mitigate those impacts by acquiring, restoring, and managing land forspecies habitat that is impacted by the development. In our case study, we found documentation forcompensatory mitigation and habitat management requirements for several special status specieslisted in Table 1.3.4 Landscape-scale Planning for USSELandscape-scale planning for renewable energy development is a process to identify appropriatelocations for renewable energy facilities across a region, taking into account ecological,development, and other factors. Completing landscape-scale plans can help avoid land-use andecological conflicts associated with solar energy development. Landscape-scale planning isinformed by the concept of the “mitigation hierarchy” whereby project proponents first avoidimpacts to areas with high biodiversity value. Where impacts are unavoidable, USSE developersminimize impacts through better project design, by enhancing compatibility of projects withwildlife habitat, forage, and connectivity, for example. This step of minimizing impacts also resultsin a reduced need for habitat mitigation. Finally, where impacts occur, developers compensate forimpacts to species and habitats through direct conservation actions such as acquisition and/orrestoration of lands with habitat for the affected species.3BLM, 2019. Right-of-Way (ROW) Authorizations. cies/rowauthorizations/.12
California has invested significantly in landscape-scale planning for USSE to limit impacts andreduce conflict in achieving clean energy and biodiversity goals (Appendix B). Even with theselandscape-scale plans for renewable energy and other resources to guide low-impact solar energydevelopment, USSE projects continue to be proposed in areas of high biodiversity value, andcompensatory mitigation for impacts is relatively common for USSE projects that affect otherwisenatural land. While the conservation benefits of landscape-scale planning for renewable energy arewell-documented, the economic benefits to date have not been quantified. This is the first study ofits kind to quantify these benefits using a case study approach.3.5 The Policy and Market Drivers for USSECalifornia’s climate goals, including a target of 100 percent zero-carbon energy by 2045,4 will driveadditional development of solar energy facilities in California. In a scenario where California’seconomy switches nearly all of its energy demand to electricity (vs. other sources such as gasoline),California could require a cumulative 8,000 km2 for solar development to meet its 2045 renewableenergy goals, and the rate of development of renewable energy facilities would need to increasesevenfold (Wu, G. C. et al., 2019).Accompanying these increases in demand are fundamental changes in the energy marketplace.Only a decade ago, three utilities—Pacific Gas and Electric (PG&E), Southern California Edison(SCE), and San Diego Gas & Electric (SDG&E)—supplied 80 percent of California’s electricity.Today’s procurement landscape for renewable energy is changing with a proliferation of CCAs, acommunity-based and localized model for buying energy. As of October 2019, there are 19 operatingCCAs serving more than 10 million customers in California. CCAs often set higher targets forrenewable energy in their overall electricity mix, making them a driver for more clean energy,including solar energy. To date, CCAs have contracted for more than 2,000 MW of new cleanenergy-generation capacity, the majority of which is from solar energy (1,360 MW). In addition,there is increased demand from corporations, which are increasingly purchasing renewable energyas part of their own sustainability initiatives. In 2019, the greatest amount of new USSEdevelopment resulted from corporate procurement of clean energy. As more corporations committo 100 percent renewable power, they will be increasingly looking to procure clean energy from offsite renewable energy facilities driving the market for more than 20 percent of new solar energycapacity additions through 2024 (SEIA, 2019).3.6 Solar Electricity Cost5California leads the nation in solar electricity capacity and generation. By 2016, California had 42percent of all solar energy capacity in the nation, leading in both the utility-scale and distributedsectors (Margolis et al., 2017). As of 2018, solar-electricity generation in California composed closeto 14 percent of the state’s total net electricity generation (California Energy Commission, 2019).As solar energy has been expanding its share of electricity generation, the installed price of solar hasbeen dropping. In a report by Bloomberg New Energy Finance (BNEF) and the Business Council forSustainable Energy (BCSE) published in 2017, an important factor has been the price drop in4Senate Bill 100 (SB100).5Note: Throughout the report, all projects costs are noted in /watt DC, not AC.13
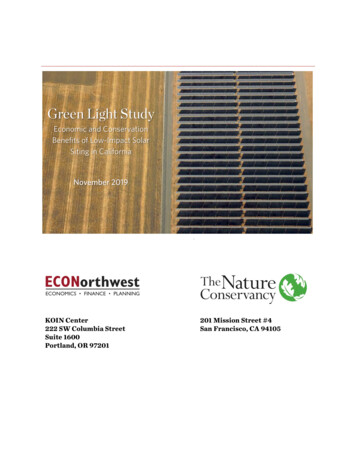
photovoltaic (PV) modules. The report finds that PV module prices have fallen 26.5 percent forevery doubling of cumulative installed capacity (Bloomberg, 2017).In another report, the Lawrence Berkeley National Laboratory (LBNL) identified a downwardtrend in installed utility-scale and commercial PV prices since 2010, when the average installedprice estimate was approximately 4.50/watt, compared with 1.56/watt in 2017. The report statesthat costs for some individual PV projects have fallen below 1/watt, with a range of 0.70 to 3.30per watt. The variation in total installed costs are attributed to system design choices (fixed-tiltpanels versus single-axis tracking panels), differences in project size (larger projects benefit fromeconomies of scale), and geographic region. California had the highest installed price of utility-scalePV at 2.47/watt. The report cites the reasons for the geographic variation as system design choices,labor and land costs, soil conditions or snow load, balance of supply/demand, and competition withother electric generators (Lawrence Berkeley National Laboratory, 2018).Compared with other installed cost estimates from National Renewable Energy Laboratory (NREL:Fu, Feldman and Margolis, 2018), BNEF (Grace, Bromely, and Morgan 2017), and Greentech Media(GTM Research and SEIA 2018), the LBNL estimates are, on average, higher (Figure 4). Thesepublications take a different approach to modeling total installed prices via a bottom-up processrather than the LBNL empirical top-down price estimates gathered from sources such as corporatefinancial filings, Federal Energy Regulatory Commission (FERC) filings, the Energy IndustryAssociation, and press releases. The bottom-up approach provides more granular information oncomponent costs by aggregating modeled cost estimates for various project components to arrive ata total installed cost or price.Figure 4. 2017 Solar Project Cost or Price (2017 /Watt)Source: Lawrence Berkeley National Laboratory, Bolinger and Seel. Utility-Scale Solar: Empirical Trends in Project Technology, Cost,Performance, and PPA Pricing in the United States—2018 Edition, 2018, p 20.https://emp.lbl.gov/sites/default/files/lbnl utility scale solar 2018 edition report.pdf.14
3.7 Land CostsLand costs are an important factor when developers select potential sites for USSE development.Developers can choose from public and private siting options. The land-cost information from thiscase study is included in Figure 5.The BLM has an established solar-specific lease rate and schedule over a project’s lifespan. Leaserates vary by designated geographic zones. BLM has stated that the lease rates are intended to bebased on fair market value and sound business management principles, consistent with comparablecommercial practices (BLM, 2017). The schedule per acre varies significantly by geography, withBLM providing county-specific annual lease rates. In addition to annual lease rates, the BLM has anannual per MW capacity fee that varies from 2,863/MW for standard solar PV up through 4,294/MW for concentrated PV with storage capacity. BLM also requires bonding for solarprojects to cover potential costs of returning the site to original conditions.Private land acquisition costs can vary considerably, generally based on market conditions. Whileproximity to transmission capacity and overall market access relate to geography, more localconsiderations of existing and potential land use, including past development, influence theultimate cost of the land for the site. For example, the cost of productive farmland with structuresand irrigation can be multiple times that of retired farmland or rangeland without valuable assets orwater rights.The U.S. Department of Agriculture (USDA) conducts annual surveys of land values and cash rentsfor farmland. The average value for farm real estate as of 2018 was 9,000 per acre in California,generally increasing annually relatively consistent with inflation rates. Cropland averaged 11,740per acre for California in 2018, with nonirrigated cropland at 4,900 per acre and pastureland at 2,700 per acre (USDA 2018). Annual rental rates as of 2018 for farmland in California were 340per acre for all cropland and 13 per acre for pastureland. Time trends show that farmland value hassteadily increased over time, likely reflecting general increases in land value across all land uses,while farmland rents have not increased at the same rate, as they are more influenced by agriculturemarket prices.To summarize the different land values of private land acquisition, private land leases, and publicland leases, we compared per-acre estimated costs for private land purchase, private land lease, orBLM land lease over 20 years at a 5 percent discount rate for future payments (Figure 5). These costestimates show that private land leasing based on current price estimates would be the lowest cost,followed by private land purchase; BLM leasing is the most expensive option.15
20,000 18,00020 Year Cost Per Acre 16,000 14,000 12,000 10,000 8,000 6,000 4,000 2,000 0Private PurchasePrivate LeaseBLM Lease (Land and MW)Figure 5. 20-Year Net Present Value Per Acre Land Cost ComparisonSource: USDA (2018). Bureau of Land Management Solar Lease Schedule (2016). 20-Year NPV with 5 percent discount rate. Private landranges reflect cropland and pastureland values for California described in the text. BLM range represents the range of lease rates by zonewithin the Mojave region.16
4 Utility-scale Solar Energy Case StudyAnalysisWe conducted a case study analysis to evaluate costs associated with developing USSE projects onlands with high vs. low biodiversity value. Solar siting costs in this analysis include financial coststhat are generally directly borne by the developer but can also be passed on to utilities andratepayers. Due to limitations in financial data availability and accessibility, the analysis focused onthree metrics that we were able to obtain and estimate from USSE project documentation:permitting timeframes, compensatory mitigation ratios, and habitat mitigation costs. We averagedand compared these metrics based on biodiversity value categories (low and high) to identify anytrends in economic benefits of low-impact solar energy.4.1 Selecting USSE Project Case StudiesWe selected 16 case studies for our analysis, which represent 41 percent of California’s installedcapacity as of June 2018. Project selection was made by considering a variety of factors andavailable information. To begin the selection process, we started with a database maintained by oneof the coauthors (Mulvaney) of California’s solar projects. A total of 622 projects were in thedatabase at the
4 UTILITY-SCALE SOLAR ENERGY CASE STUDY ANALYSIS 17 4.1 SELECTING USSE PROJECT CASE STUDIES 17 4.2 BIODIVERSITY VALUE CATEGORY ASSIGNMENT 19 4.3 COST ESTIMATION 21 4.4 USSE CASE STUDY RESULTS 22 4.4.1 Permitting Costs and Timeframe 22 4.4.2 Compensatory Mitigation and Habitat Management Costs 23 4.5 CASE STUDY ANALYSIS DISCUSSION 25