Transcription
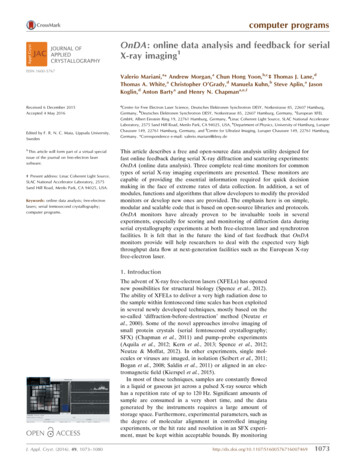
computer programsOnDA: online data analysis and feedback for serialX-ray imaging1ISSN 1600-5767Valerio Mariani,a* Andrew Morgan,a Chun Hong Yoon,b,c‡ Thomas J. Lane,dThomas A. White,a Christopher O’Grady,d Manuela Kuhn,b Steve Aplin,a JasonKoglin,d Anton Bartya and Henry N. Chapmana,e,fReceived 6 December 2015Accepted 4 May 2016Edited by F. R. N. C. Maia, Uppsala University,Sweden1This article will form part of a virtual specialissue of the journal on free-electron lasersoftware.‡ Present address: Linac Coherent Light Source,SLAC National Accelerator Laboratory, 2575Sand Hill Road, Menlo Park, CA 94025, USA.Keywords: online data analysis; free-electronlasers; serial femtosecond crystallography;computer programs.aCentre for Free Electron Laser Science, Deutsches Elektronen Synchrotron DESY, Notkestrasse 85, 22607 Hamburg,Germany, bDeutsches Elektronen Synchrotron DESY, Notkestrasse 85, 22607 Hamburg, Germany, cEuropean XFELGmbH, Albert Einstein Ring 19, 22761 Hamburg, Germany, dLinac Coherent Light Source, SLAC National AcceleratorLaboratory, 2575 Sand Hill Road, Menlo Park, CA 94025, USA, eDepartment of Physics, University of Hamburg, LuruperChaussee 149, 22761 Hamburg, Germany, and fCentre for Ultrafast Imaging, Luruper Chaussee 149, 22761 Hamburg,Germany. *Correspondence e-mail: valerio.mariani@desy.deThis article describes a free and open-source data analysis utility designed forfast online feedback during serial X-ray diffraction and scattering experiments:OnDA (online data analysis). Three complete real-time monitors for commontypes of serial X-ray imaging experiments are presented. These monitors arecapable of providing the essential information required for quick decisionmaking in the face of extreme rates of data collection. In addition, a set ofmodules, functions and algorithms that allow developers to modify the providedmonitors or develop new ones are provided. The emphasis here is on simple,modular and scalable code that is based on open-source libraries and protocols.OnDA monitors have already proven to be invaluable tools in severalexperiments, especially for scoring and monitoring of diffraction data duringserial crystallography experiments at both free-electron laser and synchrotronfacilities. It is felt that in the future the kind of fast feedback that OnDAmonitors provide will help researchers to deal with the expected very highthroughput data flow at next-generation facilities such as the European X-rayfree-electron laser.1. IntroductionThe advent of X-ray free-electron lasers (XFELs) has openednew possibilities for structural biology (Spence et al., 2012).The ability of XFELs to deliver a very high radiation dose tothe sample within femtosecond time scales has been exploitedin several newly developed techniques, mostly based on theso-called ‘diffraction-before-destruction’ method (Neutze etal., 2000). Some of the novel approaches involve imaging ofsmall protein crystals (serial femtosecond crystallography;SFX) (Chapman et al., 2011) and pump–probe experiments(Aquila et al., 2012; Kern et al., 2013; Spence et al., 2012;Neutze & Moffat, 2012). In other experiments, single molecules or viruses are imaged, in isolation (Seibert et al., 2011;Bogan et al., 2008; Saldin et al., 2011) or aligned in an electromagnetic field (Kierspel et al., 2015).In most of these techniques, samples are constantly flowedin a liquid or gaseous jet across a pulsed X-ray source whichhas a repetition rate of up to 120 Hz. Significant amounts ofsample are consumed in a very short time, and the datagenerated by the instruments requires a large amount ofstorage space. Furthermore, experimental parameters, such asthe degree of molecular alignment in controlled imagingexperiments, or the hit rate and resolution in an SFX experiment, must be kept within acceptable bounds. By monitoringJ. Appl. Cryst. (2016). 49, 74691073
computer programsexperimental conditions in close to real time, the experimentmay be maintained in optimal alignment, or alternatively, onemay pause the experiment to correct unfavorable conditions,thereby preventing the collection of unfavorable data whilepreserving valuable sample.Future instruments under development will feature evenhigher pulse repetition rates in excess of 1000 frames persecond, making it impractical for facilities to store all of therecorded data. Thus real-time analysis and data reduction willbecome a necessity. For example, the European XFEL,scheduled to commence operation in 2017, will be capable ofrecording diffraction data using 27 000 pulses per second(Altarelli, 2006), while the LCLS-2 project foresees megahertzpulse repetition rates.Some software packages for real-time monitoring of XFELexperiments have been developed in recent years. The CASSprogram (Foucar et al., 2012) has been created specifically forthis purpose. Cheetah (Barty et al., 2014) was originallydeveloped for high-throughput offline data reduction, but canbe run at the Linac Coherent Light Source (LCLS) as amodule of the data-processing framework psana (Damiani etal., 2016) for real-time data analysis. Cctbx.xfel can also beused to analyze data as they are collected using the DataExploration Toolkit (Sauter et al., 2013; Zeldin et al., 2015). Allthese packages, however, depend on either multi-thread ormulti-process technology for parallelization, which limits themto running on a single computer. Some effort will be needed toadapt them for the quantity of data expected from futureinstruments. The recently released Hummingbird (Daurer etal., 2016), initially developed for single-particle imaging atLCLS, is, to our knowledge, the only framework that isdesigned to scale beyond a single machine.We introduce OnDA, a new software framework for realtime monitoring of X-ray imaging experiment data andexperimental conditions. The OnDA project aims to provideusers with a set of stable and efficient real-time monitors forthe most common types of experiments. These can be usedimmediately without modifications or can be easily adapted tomeet the users’ requirements. In addition, we provide a set ofmodules to easily build real-time monitoring programstailored to characteristics of specific experiments. OnDAprocesses imaging data in the broadest sense: multidimensional and multiple-pixel data (for example, a diffraction pattern or a photoemission spectrum, but also an imagecoming from a camera or a microscope), but also any kind ofdigital output from an instrument or sensor (for example,temperature readout, beam and pulse, energies). The OnDAproject focuses on scalability and portability, to facilitate itsadoption for a wide array of current and future instruments,and also strives for stability and performance. In order toachieve these goals, the OnDA framework implements amaster/worker parallelization paradigm using the Pythoninterpreted scripting language (http://www.python.org) andrelying on free and open-source libraries and protocols. Theselibraries are available on all of the most widely used computerplatforms and architectures and have been actively used inlarge-scale deployments in many scientific environments. The1074Valerio Mariani et al. OnDAuse of the Python programming language, which is particularlysuited to prototyping and rapid development, makes OnDAeasy to modify and to adapt to the requirements of specificexperiments, especially when these requirements emerge ‘inthe field’ during the course of the experiment itself. TheOnDA project also aims to keep the code base simple and assmall as possible. The focus is on providing a core set offunctions, while allowing the framework to be expanded withexternal software when possible, avoiding the need to reimplement already optimized algorithms.In the following sections we briefly outline OnDA’s architecture and introduce the set of real-time monitors that arecurrently distributed with the framework. We then brieflydiscuss the backends required to integrate OnDA into thesoftware frameworks of two large-scale facilities. Finally wedescribe how to obtain OnDA’s source code and the focus offuture development.2. OnDA framework architectureThe OnDA framework is based on a master/worker architecture (see Fig. 1) and operates on data provided by anexperimental facility’s data acquisition system (DAQ). TheDAQ software, running within a facility’s software framework,collects concurrent readings from a wide range of instrumentsand detectors and groups them in a collections of time-relatedreadouts, called ‘events’. Each event corresponds to theinstrument state and measurements for a single pulse from anFigure 1The OnDA framework is built using a master/worker architecture. Theworkers recover and process the data, the result of the processing is sentto the master for further processing, and eventually dispatched to thegraphical user interface (GUI). The workers and the master communicatewith each other using the MPI protocol, while the master and GUIcommunicate using the ZeroMQ protocol.J. Appl. Cryst. (2016). 49, 1073–1080
computer programsX-ray free-electron laser, or a single detector readout at asynchrotron source.Worker nodes retrieve single-event data from a source,extract the important information and carry out any requiredprocessing. The resulting data are then sent to the masternode, which can carry out further multi-event processing (forexample, aggregation of data from many workers or averaging) and can optionally send information to the graphicaluser interface (GUI) to be displayed. Worker nodes communicate between themselves and with the master node using theMPI framework (http://www.mpi-forum.org), while data aretransferred from the master node to the GUI using theZeroMQ (ZMQ) protocol (http://zeromq.org). In OnDA, asingle worker of the master node runs on a single CPU core.OnDA is highly modular. The functions that carry out thescientific data processing are clearly separated from thefunctions that carry out data retrieval, data extraction andcommunication between the nodes. The OnDA frameworkgroups these functions into four layers (see Fig. 2).(i) Data Processing Layer: this layer carries out the scientificdata processing. OnDA implements in this layer the specificfunctions that perform calculations on the data (for example,peak extraction or background subtraction). These functionscan run both on the worker and on the master nodes. Thenature and capabilities of each type of real-time monitor areessentially defined by the functions implemented in this layer,so its content is likely to be unique for each type of experiment.(ii) Parallelization Layer: the Parallelization Layer takescare of the communication between the worker and the masternode, and between different worker nodes. Furthermore, thisFigure 2The OnDA framework features four distinct layers, as described in thetext. In the diagram, data flow from the bottom to the top, from thefacility framework which provides event data to the Data ProcessingLayer that processes the data and prepares it for visualization.J. Appl. Cryst. (2016). 49, 1073–1080layer contains functions used by the worker nodes to recoverevent data from a data source. Since different data sourcesrequire different data retrieval strategies, the functions thatare implemented in this layer strongly depend on the nature ofthe data source (files, shared-memory server etc.).(iii) Data Extraction Layer: this layer implements thefunctions that extract relevant information from event data(for example, a detector’s recorded image, or the numericalvalue corresponding to a sensor’s output). The functionsimplemented in this layer depend strongly on the format of theevent data. Each real-time monitor imports the implementation of the Data Extraction Layer required by the data format.(iv) Instrument Layer: this layer implements functions fordata extraction that are specific to a single instrument,detector or sensor. Irrespective of the data format, it is oftennecessary to know some details about the way a specificinstrument encodes information: for example, which channelof a multi-channel instrument contains the required value. TheData Extraction Layer includes units from this layerdepending on the instruments used for a specific experiment.The implementation details of the Parallelization, DataExtraction and Instrument Layers strongly depend on thesoftware framework on which the DAQ providing the dataruns, and on the format of the provided data. Hence, wecollectively label these layers ‘backend’. The backend exposesdata to the Processing Layer (which we label ‘frontend’) in astandardized facility-independent format, providing a clearseparation between facilty-dependent and -independent codein the OnDA framework.The following paragraphs contain a brief descripition of thedata flow through a typical real-time monitor created using theOnDA framework. Courier font is used in the text to refer tothe names of classes, functions or data structures.A real-time monitor is implemented as the onda Pythonclass which is defined in the Parallelization Layer. This class isinstantiated on all nodes and makes sure that each node iscorrectly initialized according to its role. Any required function defined in one of the other layers is imported during theinitialization. Worker nodes import the extract data function defined in the Data Extraction Layer, which in turnimports all the required instrument-specific functions definedin the Instrument Layer. Workers also import the processfunction from the Data Processing layer, while the masternode imports the collect function from the same layer. Areal-time monitor hence contains, through a chain of inclusions, functions from all four layers. Fig. 3 shows a typicalmonitor implementation, and traces the flow of data throughthe master and worker nodes.Each worker node fetches event data from the event datasource and calls the extract data function. This functionextracts the required information from the event data andstores it in the form of properties of the onda class. The nameand the content of the properties depend on the specificextract data function and are described in the documentation of the relevant function. For example, the timestamp ofthe event data is typically stored in a property called self.event timestamp, the raw detector readout is stored in aValerio Mariani et al. OnDA1075
computer programsproperty called self.raw data, and so on. After the information has been extracted, the worker nodes call the processfunction, which carries out the data processing (for example,background correction and detection of diffraction peaks).This function operates on the class properties and stores anyinformation that needs to be sent to the master node in aPython dictionary called results dict.After receiving data from a worker, the master node storesthem in a property called results dict and calls the collectfunction. This function is called on the master node every timedata are received from one of the workers and performs dataprocessing on the aggregated data from multiple events. Thereis no default strategy for data aggregation: the preferredapproach can be implemented by the developers of each realtime monitor in the collect function. After the functionfinishes running, the content of the results dict dictionaryis discarded. It is replaced by new data coming from otherworker nodes when the function is called again. The masternode stores by default no information between function calls,unless this functionality is implemented in the collect function. The required information is finally packaged in adictionary called collected data and sent to the GUI forvisualization.The core scientific data processing is carried out by theprocess and collect functions. They can make use ofAlgorithms to carry out their task. Algorithms are implemented using Python classes and are instantiated on both theworker and the master nodes at startup with a common set ofinitial parameters. They can be invoked (using the applymethod) from both types of nodes, and perform different tasksdepending on the identity of the caller. Algorithms allowdevelopers to implement full data processing pipelines, span-Figure 3Data workflow in OnDA. Each worker node collects event data from asource, which can be a shared memory server, a file or a network datastream. It then calls the extract data function, which is imported fromthe Data Extraction Layer, to recover useful information from the eventdata (a detector readout, an instrument reading) and makes it available asa class property. The worker then calls the process function, importedfrom the Processing Layer, to process the information, and stores theresults in a Python dictionary called results dict. This dictionary isthen sent to the master node using the MPI framework. Upon receivingthe data, the master note calls the collect function, which carries outfurther processing, and stores what needs to be sent to the GUI inanother Python dictionary called collected data.1076Valerio Mariani et al. OnDAning across both worker and master nodes, in a single Pythonobject, resulting in clearer code that is easier to read, modifyand reuse.Algorithms are generally implemented using Python,augmented with the NumPy (http://www.numpy.org) andSciPy (http://www.scipy.org/) libraries. For some complexalgorithms, however, the processing speed of an interpretedprogramming language is not sufficient. For these algorithmsOnDA uses compiled languages (like C or C ). A thinPython wrapper is then written for them using the Cython(http://cython.org/) Python extension. Wrappers can alsoexpose the function calls of the external programs to OnDA,providing two-way conversion of data formats as well as inputand output parameters.The GUI is implemented using the Qt development toolkit(http://www.qt.io) and the fast-display PyQtGraph library forscientific graphics (http://www.pyqtgraph.org). The communication between the master node of the monitor and the GUItakes place over a network connection using the ZeroMQprotocol, which relies on the TCP network communicationprotocol. Therefore, a network connection with at least oneopen TCP port is required for the connection. While theZeroMQ protocol is not as fast as the MPI protocol used bythe nodes to communicate between themselves, its reliance onTCP allows communication across sub-networks and evenacross the internet. OnDA exploits the speed and flexibility ofMPI for interprocess communication between worker andmaster processes performing the scientific computing, whilebroadcasting results to one or more GUI displays over ZMQenables the GUI clients to be run independently on hostslocated remotely on different networks. We have found this toenhance stability and fault tolerance because the GUInetwork can suffer from a delay, or the GUI can even terminate, without affecting the OnDA analysis processes. Manyinstances of the GUI, running on several different machines,even outside of the facility where the experiment takes place,can connect to the same monitor at the same time. However,the monitor will continue to run even with no GUI attached,enabling it survive faults such as network dropouts or the useraccidentally closing the GUI.The OnDA framework is also designed to be stronglyresilient to errors and missing data, and to survive a crash ofone or more working nodes. If the facility framework fails toprovide data to one or more workers, the affected nodessimply wait for data while the other nodes keep processing.The framework also checks data for errors. If the recoveredevent data set is incomplete or corrupted, workers simply skipthe corrupted data and move to the next event. Furthermore,if an unexpected condition causes an unrecoverable crash ofone or more workers, the others will continue processingevents and the monitor will keep working, although with areduced performance, as long as the master node is running. Invery high throughput experiments, or when an OnDA monitoris running on limited computer resources, it is possible that thespeed at which the DAQ provides data will be too high for themonitor to process an event before the next one is received. Inthese circumstances the OnDA framework skips processingJ. Appl. Cryst. (2016). 49, 1073–1080
computer programsupdating virtual powder pattern. The monitor reads thedetector data, applies detector corrections and searches forBragg peaks in the resulting data. It can optionally apply amask or carry out gain correction according to a gain mapprovided by the user. The peakfinder algorithm from theCheetah program is used to detect potential Bragg peaks. Theuser can alter the sensitivity of the algorithm using all theoptions and parameters available in Cheetah. On the basis ofthe number of peaks found, the monitor decides if the detectorframe represents a diffraction pattern and updates the hit rateaccordingly. The intensity of each Bragg peak is also checkedagainst a user-provided threshold to see if it is outside of thedynamic range of the detector. The collected data are then3. Available real-time monitorssent to the GUI for visualization. All options are configuredThe OnDA project provides, at this time, three complete realusing a plain-text configuration file.time monitors: a monitor for SFX, a monitor for velocity mapThe GUI of the SFX monitor (see Fig. 4) displays on the leftimaging (VMI) and a monitor for serial fiber diffractionavirtualpowder pattern generated from the detected Braggimaging. The three monitors are described in detail in thepeaks.Theright side is occupied by two plots showing thefollowing sections and can be run using the backendsrecenthistoryof the running averages of the hit rate (at thedescribed later as they are provided, without further modifitop)andofthesaturation rate (at the bottom). The mostcation. However, all modules, functions and algorithms thatrecentvaluesoftherunning averages lie on the right-handwere used to create them (for example, peak finding algosideoftheplots.Thesize of the time-point window used torithms, functions that perform detector corrections, averagingcomputetherunningaveragescan be chosen by the user. Byand input/output routines) are available as separate entities inclickingontheplots,specifictimepoints can be marked with athe OnDA framework. By combining them in different ways,verticalline.Arightclickonthelineremoves it. A time pointdevelopers can easily create variations on the tal condimonitors, or completely new ones designed for g in clearerexperiments.visual feedback on the effect of the change. Buttons at thebottom of the main window allow the user to clear both the3.1. SFX monitorvirtual powder pattern and the plots. An estimate of the delaybetween the time when the data are collected and when theThe SFX monitor allows users running an SFX experimentresult of the processing is displayed in the GUI is alsoto keep hit rate (the fraction of X-ray shots that resulted in areported.hit) and saturation rate (the fraction of shots where more thanWe routinely use the SFX monitor for our experiments atthree of the detected peaks appeared to have reached thethe CXI instrument at the LCLS facility, located at the SLACsaturation threshold of the detector) under control. FurtherNational Accelerator Laboratory in Menlo Park, CA, USA.more, it uses the collected data to display a constantlyWe run it on the same machines where theDAQ is running, to allow memory sharingand direct communication between theDAQ and OnDA without passing throughthe filesystem. The DAQ at the CXIinstrument uses five machines, whichfeature an Intel Xeon E5620 CPU witheight cores, a clock speed of 2.40 GHz and48 GB of RAM, to process collected data inparallel, so each of the machines gets 20%of the event data. We found that runningthe SFX monitor with just four workers permachine, each running on a single logicalcore of the CPU (20 workers in total plusthe master running on a total of 21 CPUcores), allows us to process all event datacoming from the DAQ without losing anyFigure 4Graphical user interface for the OnDA crystallography monitor. The left side of the screendata. Each OnDA worker uses aroundshows a virtual powder representation of the incoming data, while the right side shows a2 GB of virtual memory, while the masterrunning average of the hit rate and of the saturation rate (see main text for definitions of theseuses around 750 MB of memory. The delayrates). The estimated delay between the time of data collection and of data display is reportedbetween data collection and visualization inbelow the main panels.the oldest events, guaranteeing that the processed ones are asrecent as possible.It should be pointed out that, although all the real-timemonitors currently distributed with the OnDA framework areimplemented using a single master node and multiple workers,the framework’s architecture does not prevent the development of monitors featuring multiple master nodes withdifferent roles, or even multiple layers of master nodes. Thisflexibility, achieved by implementing inter-node communication using the MPI protocol, markedly increases scalability.J. Appl. Cryst. (2016). 49, 1073–1080Valerio Mariani et al. OnDA1077
computer programsthe graphical interface is usually between 1 and 2 s undertypical network load conditions.The SFX monitor has been used also for experiments at theP11 bio-imaging and diffraction beamline of the PETRA IIIsynchrotron located at DESY in Hamburg, Germany. Themonitor was running on a machine with an Intel Xeon E5-2650CPU featuring a clock speed of 2.60 GHz and 32 cores.Running OnDA with just 16 workers (plus a master node)allowed us to process all of the data, with a delay between datacollection and visualization of about 4–5 s,using a total of 17 CPU cores.injected into the path of the FEL beam via a liquid jet.Pressure differentials in the liquid jet align each fiber bundlealong its long axis to that of the jet, referred to as ‘flowalignment’. The axis of alignment could then be scanned bytilting the liquid jet with respect to the beam axis, allowingfibers to be imaged over a large range of orientations. Thecollected diffraction data were subsequently computationallyaligned to form a view of the reciprocal space volume of thefibers.3.2. VMI monitorThis monitor was designed to measurethe degree of laser-induced alignment ofparticles in a molecular beam using theVMI technique (Eppink & Parker, 1997). Itrecovers the data from a CCD cameraimaging the phosphor screen of a VMIspectrometer and applies a simple peakdetection algorithm to detect the ion signal.Each signal peak is also located with subpixel precision using a center-of-masscentroiding algorithm. Data from a predefined number of events (chosen by the user)are accumulated. Some statistics that estimate the degree of alignment of the ionswith respect to the alignment laser (verticalaxis of the VMI spectrometer) arecomputed. Since the center of the spectrometer screen is often displaced with respectto the experimental interaction point, theuser can apply translational and rotationoffsets to the data before the statistics arecomputed. The data are then sent to theGUI for visualization.The GUI of the velocity monitor (seeFig. 5) shows the detected signal peaks asred circles. The user must define (though aconfiguration file) a wedge-shaped area onthe VMI screen. Only peaks within the areaare included in the statistical calculations.The area is shown in white in the GUI. Bychecking a tick box, the user can display anaccumulation plot of the detected signalpeaks in its place. Below the main viewer,the degree of alignment statistics andhcos2 i are shown, and under those, anestimation of the delay between datacollection and display. The right-hand sideof the monitor displays the recent history ofthe hcos2 i alignment statistic.3.3. Serial fiber diffraction monitorThis monitor was developed for a fiberdiffraction experiment at the LCLS. In thisexperiment individual fiber bundles were1078Valerio Mariani et al. OnDAFigure 5Graphical user interface for the OnDA velocity monitor. The screen shows on the left the signalpeaks detected on the VMI screen for the latest predetermined number of events. Below themain plot, the degree of alignment of the data along the vertical axis of the VMI screen isreported as values of and hcos2 i. Only the data included in a user-defined wedged-shapedarea of the screen are used to compute the alignment statistics. Behind the signal peaks, shownas red circles, the user can choose to show the wedge-shaped area, or, like in the abovescreenshot, the accumulated peak density. On the right side of the screen, the evolution of thehcos2 i alignment statistic over time is shown.Figure 6Snapshot of the OnDa graphical frontend used to monitor serial fiber diffraction collection atthe LCLS CXI end station. (Left panel) Live view of individual or integrated diffractionpatterns as recorded by the CSPAD detector. (Inset top left) Outlined in blue, fiber bundlediffraction peaks as seen with radial background subtraction turned on. (Top right panel)Histogram of the integrated signal on the selected asics (CSPAD detector panels) as outlined inred in the left panel. (Middle right panel) Time-averaged hit rate. (Lower right panel)Integrated signal of the selected asics as a function of time. (Bottom panel) User input optionsfor the GUI in addition to live output of scalar data such as the detector distance, the photonenergy, and the detector counts and resolution of the pixel under the mouse.J. Appl. Cryst. (2016). 49, 1073–1080
computer programsThe serial fiber diffraction monitor was designed to observethe hit rate of the fibers as well as the background signal fromthe liquid jet in real time.Fig. 6 shows a snapshot of the OnDA GUI used during theexperiment. In the left p
A real-time monitor is implemented as the onda Python class which is defined in the Parallelization Layer. This class is instantiated on all nodes and makes sure that each node is correctly initialized according to its role. Any required func-tion defined in one of the other layers is imported during the initialization.