Transcription
ITBudget: Data Input Requirements, Explain Text andDefinitionsThis document provides an overview of all questions and definitions used in the GartnerITBudget tool, as defined by the Gartner Benchmark Analytics consensus model.OverviewUse this document to prepare your organization’s IT key metrics data for comparison, usingactual spending and budgets, or best estimates where detail is unavailable.Once prepared, go to http://www.gartner.com/explore/tools/it-budget to input data and generateyour Gartner IT Key Metrics Data comparison report. Delegates, please refer to the session linkincluded in your delegate invitation.Upon submission, IT Key Metrics Data comparison reports are immediately available fordownload from the ITBudget “My Assessments” page.Comparison reports can be quickly and easily updated with the “Copy” feature on the ITBudget“My Assessments” page. E.g., to update estimates, or to choose alternative comparison groups.Gartner analysts are available through inquiry services to clarify models and definitions as well asto review results and discuss next step opportunities for increasing value and optimizing IT.Read our privacy policy.Introduction All questions are required to be answered to generate a comparison report. Budget figures should be entered in actual figures. Do not use decimals or comma asthe thousand separator. (E.g., “25560000”) Users can save and return to a data collection session through “My Assessments.” Detailed definitions are available within the user interface as well as within the appendix. Users can delegate IT financial data alignment and entry exercises to a colleague tocomplete on their behalf. Delegates do not need Gartner.com member access. Users can upgrade a previous year’s comparison to the latest version from “MyAssessments.” Multiple IT Key Metrics Data comparison reports can be created. 2017 Gartner, Inc. and/or its affiliates. All rights reserved. Gartner is a registered trademark of Gartner, Inc. or itsaffiliates. This publication may not be reproduced or distributed in any form without Gartner’s prior written permission. Theinformation contained in this publication has been obtained from sources believed to be reliable. Gartner disclaims allwarranties as to the accuracy, completeness or adequacy of such information and shall have no liability for errors,omissions or inadequacies in such information. This publication consists of the opinions of Gartner’s research organizationand should not be construed as statements of fact. The opinions expressed herein are subject to change without notice.Although Gartner research may include a discussion of related legal issues, Gartner does not provide legal advice orservices and its research should not be construed or used as such. Gartner is a public company, and its shareholders mayinclude firms and funds that have financial interests in entities covered in Gartner research. Gartner’s Board of Directorsmay include senior managers of these firms or funds. Gartner research is produced independently by its researchorganization without input or influence from these firms, funds or their managers. For further information on theindependence and integrity of Gartner research, see “Guiding Principles on Independence and Objectivity” on its budsman/omb guide2.jsp
TABLE OF CONTENTSITBudget Data Input Requirements . 4Industry Standard, Off-the-Shelf, IT metrics Self-Assessment Tool. 4Q. Who are you as an organization? . 5Q. Which industry do you want to compare against? . 5Q. Choose a secondary comparison group. . 6Q. What is your IT Budget? . 7Q. What is the funding source of total IT Spend?. 7Q. What is the asset based distribution of your IT Budget? . 8Q. What is the strategic based distribution of your IT Budget? . 8Q. How many IT Personnel (Full-time Equivalents) are in your organization? . 9Q. What is your IT staffing profile by function? .10Q. What is the IT functional area based distribution of your IT staff? .10Q. Define your organization’s IT Service Portfolio.11Q. What is the distribution of your IT annual spend to support your service portfoliocategories? .12Appendix — Key Data Input Requirements Explain Text and Definitions .14“Demographics” Explain Text and Definitions .14Revenue is defined as: .14Business Operational Expense is defined as: .14Employee count is defined as: .14“IT Spending/Budget” Explain Text and Definitions.14What the IT Spending/Budget Includes, From a Resource or CostPerspective .14What the IT Spending/Budget Includes, From an IT Functional Area orActivity Perspective .15What the IT Spending/Budget Does Not Include .15IT operational expense is defined as: .16IT capital spending is defined as: .16“Formal IT Budget, Business Unit IT Spending and Shadow IT Spend” Explain Text andDefinitions .16Asset based IT Budget Explain Text and Definitions .16“Run-, Grow- and Transform-the-Business” Explain Text and Definitions .18Run the business: .18Grow the business: .18Transform the business: .18“IT Full-Time Equivalent (IT FTE)” Explain Text and Definitions .18IT FTE is defined as follows: .18Insourced IT FTEs are defined as: .19Contract IT FTEs are defined as: .19“IT Full-Time Equivalent (IT FTE) Staffing Profile” Explain Text and Definitions .19"Infrastructure Operations and Software Engineering” is defined as: .19“Technology and Process Management” is defined as: .19“Finance, Governance and Control” is defined as: .20IT Functional Area Annual Spending Definitions .20Data Center .20End-User Computing .22IT Service Desk .24Network (Voice and Data) .25Page 2 of 34 2017 Gartner, Inc. and/or its Affiliates. All Rights Reserved.
Application Development .27Application Support .28Corporate IT Management, Finance, and Administration .29“IT Business Service Portfolio” Explain Text and Definitions .31Best practices for defining and maintaining the IT business service portfolio .31Suggested IT Business Services and Descriptions .32LIST OF TABLESTable 1. Suggested IT Business Services and Descriptions .32Page 3 of 34 2017 Gartner, Inc. and/or its Affiliates. All Rights Reserved.
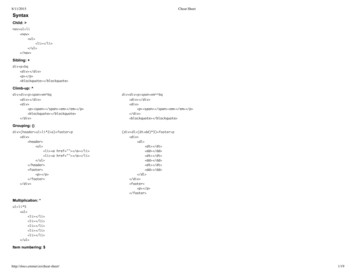
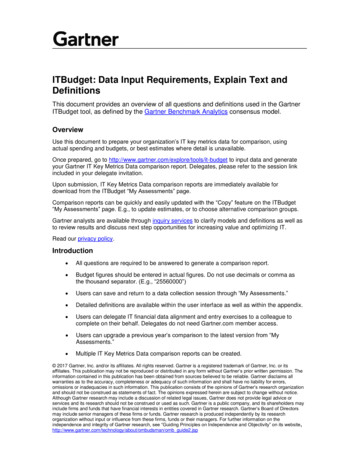
ITBudget Data Input RequirementsIndustry Standard, Off-the-Shelf, IT metrics Self-AssessmentTool Gartner Benchmark Analytics industry standard consensus models and definitions forIT financial management Assess IT budget and enterprise IT key metrics against Gartner IT Key Metrics Dataindustry measures from like organizations Determine if current/planned expenditures are aligned to business goals — i.e., run,grow, transform — and adjust if appropriate Identify cost optimization opportunities and establish IT supply-side goals and targets Measure progress to support recurring budgeting and planning workshops/exercises Map the IT budget into a business services-based view of spending to supportbusiness needs http://www.gartner.com/explore/tools/it-budgetTo start a new assessment and generate an IT metrics comparison report versus your industry,from gartner.com, select "Explore," "Metrics & Tools," and under "ITBudget,” select "StartAssessment.”Figure 1. ITBudget Tool LocationSource: GartnerOnce you have completed an assessment, the following Gartner research highlight next steps tosupport IT business value discussions through IT financial transparency and cost optimizationinitiatives. IT Key Metrics Data 2017: Resources to Review Your ITBudget Assessment Enhancing and Communicating Performance and Measurement of Business Value of ITPrimer for 2017Page 4 of 34 2017 Gartner, Inc. and/or its Affiliates. All Rights Reserved.
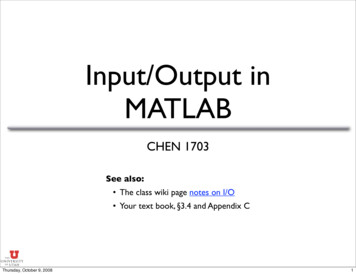
Access to the ITBudget Tool and referenced research is dependent on your level of Gartnersubscription.Q. Who are you as an organization? These questions define your assessment scope and outline your organization’s relativesize in terms of top line financial results and or estimates as well as with regards to theemployee workforce who supports operations. It is important to maintain the samescope throughout the entire assessment. If IT only supports a regional division, orbusiness unit rather than the entire enterprise, ensure that the demographics section isof the same scope, otherwise report figures for the entire enterprise. Many organizationscreate ITBudget assessments for each division, as well as for the entire enterprise inaggregate to support planning and communication exercises. Comparative metrics which require these data inputs include: IT Spending as apercentage of Revenue, IT Spending as a percentage of Operating Expense, and ITSpending per Employee, as well as Revenue per Employee. Click Here to Review Detailed Explain Text and Definitions for the “Demographics.”Q. Which industry do you want to compare against?You can compare your organization’s IT metrics to any one of 21 vertical industries or a crossindustry view as your primary industry comparison group. You can also “copy” your assessmentsPage 5 of 34 2017 Gartner, Inc. and/or its Affiliates. All Rights Reserved.
and generate additional comparison reports against various vertical industries to offer more than1 perspective. Industries available to compare against are as follows Cross-Industry (All Industries) Banking and Financial Services Chemicals Construction, Materials and Natural Resources Consumer Products Education Energy Food and Beverage Processing Government — National and International Government — State and Local Healthcare Providers Industrial Electronic and Electrical Equipment Industrial Manufacturing Insurance Media and Entertainment Pharmaceuticals, Life Sciences and Medical Products Professional Services Retail and Wholesale Software Publishing and Internet Services Telecommunications Transportation UtilitiesDetailed definitions for each of the 21 industries are outlined in the following documentIT Key Metrics Data 2017: Definition of Industries, RN# G00291336Q. Choose a secondary comparison group.In addition to a primary industry comparison group, the ITBudget tool allows clients to select asecondary comparison group as an addition point of reference in their ITBudget assessmentreports. Secondary comparison group options include: Primary industry selection, by revenue/operating budget scale Secondary industry, from the previously noted vertical industry list Region specific, cross-industry averagesPage 6 of 34 2017 Gartner, Inc. and/or its Affiliates. All Rights Reserved.
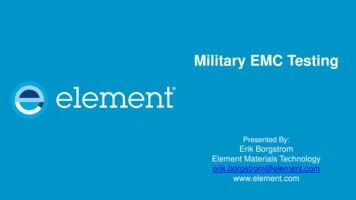
Q. What is your IT Budget? These questions are the basis for all IT spending and annual cost metrics. For ITspending metrics (cash flow view), IT capital investment IT operational expense will beused to understand relative IT spend levels as compared to revenue, total operatingexpenses as well as per employee. This cash flow view will also be used to understandrelative distribution of IT spending across accounting based categories (capital vs.operational spend), asset based categories (hardware, software, personnel,outsourcing), as well as strategic based investment categories (run-the-business, growthe-business, and transform-the-business IT spending). IT annual cost (IT operational depreciation and amortization expenses) is also used tounderstand the annual cost or expense required to support IT. Click Here to Review Detailed IT Budget Explain Text and DefinitionsQ. What is the funding source of total IT Spend? Click Here to Review Detailed IT Budget Explain Text and DefinitionsPage 7 of 34 2017 Gartner, Inc. and/or its Affiliates. All Rights Reserved.
Q. What is the asset based distribution of your IT Budget? Click Here to Review Detailed IT Budget Explain Text and DefinitionsQ. What is the strategic based distribution of your IT Budget? Click Here to Review Detailed Run-, Grow- and Transform-the-Business Explain Textand DefinitionsQ. What is the IT functional area based distribution of your ITBudget?Page 8 of 34 2017 Gartner, Inc. and/or its Affiliates. All Rights Reserved.
These figures will be used to outline the percentage allocation of your total annual ITspend between the various IT functional areas. This will also establish the basis for yourIT business services budget. Click Here to Review Detailed IT Functional Area Explain Text and DefinitionsQ. How many IT Personnel (Full-time Equivalents) are in yourorganization? These figures will be used to understand relative IT workforce scale as well as thedistribution of the IT workforce between internal and external IT FTE human resources.Metrics generated with this data includes IT FTEs as a percentage of total employees,IT FTE distribution between in-house FTEs and contract FTEs, as well as will be usedas the basis for your IT staffing distribution by IT functional area. Click Here to Review Detailed IT Full-Time Equivalent (IT FTE) Explain Text andDefinitionsPage 9 of 34 2017 Gartner, Inc. and/or its Affiliates. All Rights Reserved.
Q. What is your IT staffing profile by function? What is the percentage distribution of your total IT FTE count by the following IT Staffingfunctions? Infrastructure Operations and Software Engineering; Technology andProcess Management; Finance, Governance and Control. Click Here to Review Detailed IT Full-Time Equivalent (IT FTE) Staffing Profile ExplainText and DefinitionsQ. What is the IT functional area based distribution of your ITstaff? These figures will be used to outline the percentage allocation of your total IT workforcebetween the various IT functional areas. Click Here to Review Detailed IT Functional Area Explain Text and DefinitionsNext StepsReturn to the ITBudget "My Assessments” page, review and complete the IT Business Serviceportfolio view.Page 10 of 34 2017 Gartner, Inc. and/or its Affiliates. All Rights Reserved.
Q. Define your organization’s IT Service Portfolio The next steps will enable users to add an IT Business Services Portfolio to their IT keymetrics comparison report. Typically these portfolios contain no less than 3 and no morethan 15 service categories. Common examples of service categories include, but are not limited to IT Provisioning,Workplace Support, Automated Billing, Automated Procurement, Automated FinancialReporting, Automated Sales/Customer Service, Business Process Improvement amongothers. Click Here to Review Detailed IT Business Service Portfolio Explain Text and DefinitionsITSM Fundamentals: Seven Steps to Creating an IT Service Portfolio — Group Exercise Level-set the Definition of a Service. A service is an action that delivers a benefit to arecipient. The intended recipient must be explicit, and the benefits must be in "the eye ofthe beholder." Get Off the Blank Page. Each IT leader brainstorms the list of services they think youoffer. The consolidated list will likely have 40 to 150 items. Call a Meeting/Facilitate a Workshop, Establish the Criteria for a Service.Go through the list asking, "Is it an action or a thing?"; "Is it 'what' we do or 'how' we doit?"; "Is it something the recipient would understand, appreciate, and buy?" Cull. Eliminate any physical or tangible items. Eliminate processes and transactions. Refine and Bundle. Classify ambiguous items, identify latent opportunities, aggregateand bundle. Describe and Position. Keep the descriptions short and craft a business valuestatement for each service. Test and Finalize. The working portfolio is ready to be tested with a focus group ofsenior leaders. Engaging clients too early and asking them to provide value statementsgreatly undermines IT credibility.Page 11 of 34 2017 Gartner, Inc. and/or its Affiliates. All Rights Reserved.
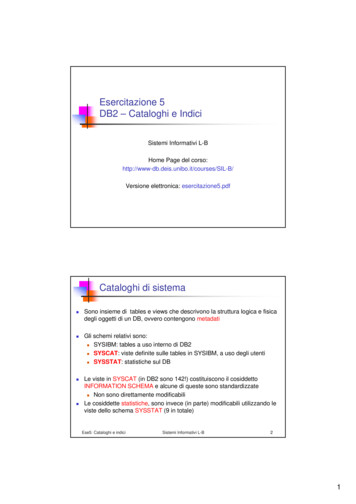
Q. What is the distribution of your IT annual spend to supportyour service portfolio categories? These next steps will aid in mapping your IT budget from your IT functional areas (e.g.,data center and IT service desk) to your IT service portfolio categories. Please workdown each IT functional area column and allocate a % of the spend to support your ITservice portfolio categories.Page 12 of 34 2017 Gartner, Inc. and/or its Affiliates. All Rights Reserved.
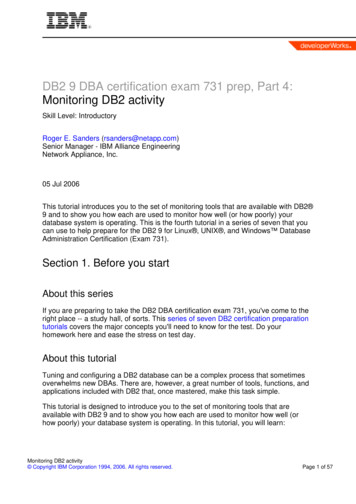
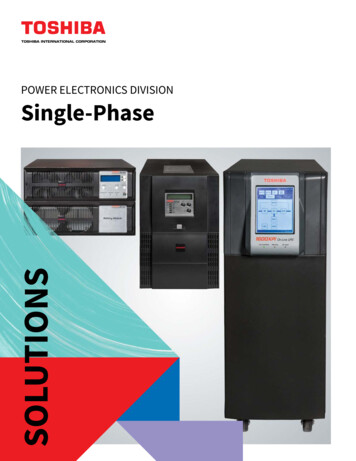
IT Bill of MaterialsIT Service: Automated Financial ReportingUnit of Measure: Per User Per MonthMaterials:1. Data Center2. Storage3. Bandwidth4. Printing Labor:5. Application Support6. Application Development7. Network Monitoring8. Management Oversight Cost/Unit1,000.0010.00250.001.00Total Standard 70.003Extended Cost 500.00 100.00 125.00 50.00 5.002.080.320.21 782.61Page 13 of 34 2017 Gartner, Inc. and/or its Affiliates. All Rights Reserved.
Appendix — Key Data Input Requirements Explain Text and Definitions“Demographics” Explain Text and DefinitionsRevenue is defined as: "The enterprise revenue associated with the business units supported by the ITorganization (banks should use total interest income plus noninterest income minusprovision for loan losses, while insurance companies should use gross written premiumsand other income)."Business Operational Expense is defined as: "The total expense associated with the business units supported by the IT organization.This includes items such as selling, general and administrative expenses, cost of goodssold (or cost of revenue), research and development, depreciation, and depletion andamortization expenses. For insurance, this includes underwriting expenses, loss andloss-adjustment expenses; for banking organizations, it includes interest expenses andnoninterest expenses; for government and nonprofit organizations, it is represented bythe enterprise operating budget."Employee count is defined as: "The count of employees (i.e., head count, excluding enterprise contractors andconsultants), regardless of whether these employees are frequent users of thetechnology supported by the IT organization. This includes full-time and part-timeemployees, or as reported in the public record."“IT Spending/Budget” Explain Text and DefinitionsFor the purpose of this research, Gartner has defined "total IT spending" as the following:"The best estimate of total spending at the end of the 12-month budget period for IT tosupport the enterprise. IT spending/budget can come from anywhere in the enterprisethat incurs IT costs, and it is not limited to the IT organization. It includes estimates byenterprises on decentralized IT spending and or "shadow IT." It is calculated on anannualized 'cash flow view' basis, and, therefore, contains capital spending andoperational expenses, but not depreciation or amortization."What the IT Spending/Budget Includes, From a Resource or Cost Perspective Hardware, software, personnel (including contractors, travel, benefits and training),outsourcing (external IT services like consulting, system integration, data and voicetransmission, software as a service, infrastructure as a service, other cloud services),disaster recovery and occupancy costs associated with supporting IT within theenterprise. Costs also include all taxes (except value-added tax where it is recovered orrefunded to the organization). Note: Occupancy costs, include fully burdened costs for the facilities being used bythe IT staff supporting the enterprise. Some examples include office space, furniture,electricity, maintenance, property taxes, security and office supplies. Occupancycosts for space dedicated to IT functions, such as the data center, includingpower/heat management and raised floor, are also included.Page 14 of 34 2017 Gartner, Inc. and/or its Affiliates. All Rights Reserved.
What the IT Spending/Budget Includes, From an IT Functional Area or ActivityPerspective The data center (for example, mainframes, servers, storage and facilities), end-usercomputing devices (for example, desktops, laptops, tablets, thin clients andsmartphones), voice and data networks (including, but not limited to, voice and datatransmissions, fixed and mobile telephony, and internet access services), IT servicedesk, and applications (for example, development and maintenance). IT support functions, such as the office of the CIO; supervisory management; financeand administrative costs, such as purchasing; asset management; processmanagement; and marketing of IT services. Dedicated data processing equipment used in operations, production and engineeringenvironments — examples are computer-aided design/computer-aided manufacturing(CAD/CAM) and standard computing equipment used in devices for factory automation,and tablet PCs used by healthcare professionals.What the IT Spending/Budget Does Not Include Costs for technology or services that are resold. Examples include salaries fordevelopers involved in building commercially packaged software, or IT-skilledemployees who provide services for the organizations' external clients. Operational technology that is: Equipment-built or purchased for non-data-processing purposes, but which hascomputerized components. Examples include robotic manufacturing machines,automated teller machines, specialized point-of-sale devices, scanners, bloodpressure monitors and sensors on a supervisory control and data acquisition(SCADA) system. Appliance-like or proprietary data processing equipment that has a single (typicallyindustry vertical) purpose and cannot be used for other general purposes. A typicalexample is a computer that can only control the flow of electricity through the powergrid. Since it cannot be repurposed, it is not included in our model. Note that othersystems that gather data from this type of computer and can be used for otherpurposes would not be considered operational technology and, therefore, would bein scope of our model. Depreciation or amortization expenses, which could lead to double counting from anaccounting perspective. Internal "cross charges" and corporate allocations related to large, significant and/orunusual one-time expenses, such as reductions in workforce, redundancy, relocations,retirement, human resources and chairperson's salary. Business data subscriptions and services (such as Bloomberg), even if they aremanaged by the IT organization. Business process outsourcing services (BPO) where organizations outsource entirebusiness functions such as payroll or benefits management. This includes cases wherethe BPO vendor provides access to software, and also guarantees that the outcomes oftheir services will meet business requirements, such as tax and withholding regulations.Page 15 of 34 2017 Gartner, Inc. and/or its Affiliates. All Rights Reserved.
Note: where a vendor provides Software as a Service and only guarantees that thesoftware will perform as specified, then this is in scope of the IT spending/budget.Traditional outsourcing of IT functions, for example servers and email, are also stillwithin scope.IT operational expense is defined as: "The total day-to-day operations and maintenance expenses for this fiscal year that havenot been capitalized. These do not include any amortization and depreciationexpenses."IT capital spending is defined as: "The total capitalized IT spending for the fiscal year (i.e., the full value of capitalizedassets acquired in the fiscal year). This includes investments in new applicationdevelopment and IT infrastructure."“Formal IT Budget, Business Unit IT Spending and Shadow ITSpend” Explain Text and Definitions Formal IT Budget: IT spending that the IT department is accountable for. The ITdepartment is answerable for the provision of these IT assets and services. Business Unit IT: IT spending where profit centers or overhead departments areaccountable. For this category the IT department is consulted as a subject matterexpert, and there is two-way communication. Shadow IT: IT spending anywhere in the enterprise for which the IT department is notaccountable. For this category the IT department is aware of spending, but may nothave detailed information about it. Amounts here may need to be estimated.Asset based IT Budget Explain Text and Definitions Hardware Expenses: These include all hardware expenses described in the ITspending/budget definition. Software Expenses: These include all software expenses described in the ITspending/budget definition. Personnel Expenses: These include: Salary and Benefits Expenses: These should include salary (including overtimepay), benefits and "other" employee costs, such as travel and training for all ITFTEs. The "benefit load" should include costs for bonuses, paid holidays, vacations,medical/dental coverage, life and accident insurance, retirement plans, stock plans,disability, Social Security, unemployment compensation, dependent care, tuitionreimbursements and employee assistance programs (for example, physical exams,exercise programs and similar costs).Occupancy/Facilities Expenses: These include fully burdened costs for the facilitiesbeing used by the staff that supports the enterprise. Some examples include officespace, furniture, electricity, maintenance, property taxes, security and office supplies.Page 16 of 34 2017 Gartner, Inc. and/or its Affiliates. All Rights Reserved.
Occupancy costs for space dedicated to IT functions, such as the data center (includingpower/heat management and raised floors), are also included. Software as a Service (SaaS): SaaS is the application service layer within cloudcomputing. The application software is owned, delivered and managed remotely by oneor more providers. The provider delivers a solution based on a uniform applicationdefinition and on a sharing model at one or more layers of the application stack. SaaS ispurchased on a pay-for-use basis or as a subscription based on usage metrics. Customers may be able to extend the data model by using configuration tools suppliedby the provider, but without altering the source code. This approach is in contrast to thetraditional application hosting model in which the provider supports multiple applicationcodes and multiple application versions or a customized data definition for eachcustomer. Purchasing is based on a subscription (for example, a per-user, per-month fee) or usebasis (for example, allocating a certain number of transactions for a fixed time period oran actual pay-per-use basis). A perpetual license purchase isn't considered SaaS. Infrastructure as a Service (IaaS) and Other Public Cloud Services. Infrastructure as a service (IaaS) is a standardized, highly automated offering inwhich compute resources, complemented by storage and networking capabilities,are owned and hosted by a service provider and offered to the customer ondemand. The resources are multitenant, metered, and operate in near-real time.Self-service interfaces are exposed directly to the customer, such as a web-basedgraphical user interface and API. Other Public Cloud Services – comprise public cloud management and security
Gartner is a public company, and its shareholders may include firms and funds that have financial interests in entities covered in Gartner research. Gartner's Board of Directors may include senior managers of these firms or funds. Gartner research is produced independently by its research