Transcription
Name:GNOME Oil Spill Modeling LabGoal: After simulating an actual oil spill event, you will understand how oceanographers help toprotect marine resources from pollution such as oil spills. You will use an actual modelingprogram, GNOME, to observe and predict oil spill trajectories. You will understand howweather and ocean conditions affect the fate of oil transport, and how modeling these conditionscan help remediation efforts.Materials: GNOME (General NOAA Operational Modeling Environment) installed with alocation file. In this case, we use the Santa Barbara location file. Also required are a pencil, labsheet and the “GNOME manual.”Part 1Warm up: Re-Create the Santa Barbara Oil Spill of Jan 28, 1969.The goal in part 1 is to test the model. Does it work? Can we actually use it? Scientists call this“hindcasting” (rather than forecasting). Hindsight is 20-20!Procedure:1) Set up the spill in the model using the “GNOME manual” and the details of the spill and localweather conditions provided below.-Model Run Duration: 3 days-Weather conditions:Current: Davidson current (“Relaxation state”)Wind: VariableDay 1: NNW, 10 Knots (Auto-increment by 24 hours)Day 2: WNW, 10 KnotsDay 3: WSW, 15 Knots-Spill location: 34 19’ 54’’ N and 119 36’ 47’’ W
-Spill amount: 100,000 barrels (non-weathering)2) Simulate the oil spill (push “play”). Pay attention to the wind, time, and location where oilcomes onshore (you can pause the simulation if you want).Part 1 Question:1) Does the spill you modeled agree with the local account of the actual Santa Barbara oil spill(below)? List some similarities and differences between the model and the observations of theactual spillLocal account of the Oil Spill:Santa Barbara was experiencing a stormy winter, with a large flood event having occurred on January 25, just threedays before the blowout. Enormous amounts of fresh water were still running offshore from local streams, flowingsouth and southwest in the vicinity of the rig. Combined with the prevailing north-northwesterly winds typical ofthe area between storm systems, this pushed the expanding oil slick away from the shore, and it seemed for severaldays that the beaches of Santa Barbara would be spared. However, another huge storm system affected the region onFebruary 4, with winds moving around the compass clockwise from southeast to west; this pushed the oil slick northinto Santa Barbara harbor and onto all the beaches of southern Santa Barbara County and northwestern VenturaCounty.Straughan, Dale (1973). "Biological studies of the Santa Barbara oil spill". American Association of Petroleum Geologists, Trip 3, 1973Annual Meeting (University of Southern California: AAPG): 4–16.
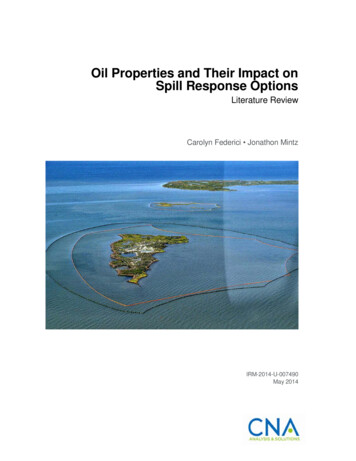
Part 2What if the spill happened today?Disaster! There has been an oil spill off the coast of Santa Barbara.It is your job as a NOAA Oceanographer to do everything possible to reduce the impact of the oilspill on the coastal environment. There are 10 miles of booms available at the NOAA responsestation in Santa Barbara, but more booms and other coastal cleanup materials need to be loadedand driven from the Los Angeles – this will take 24 hours.You must decide where to deploy the 10 miles of booms in Santa Barbara and what to do withthe remaining resources available a day later.-Today’s Weather Conditions:Current:Winter (Sep-Feb) choose “Relaxation”Spring (Feb-May) choose “Upwelling”Summer (June-Aug) choose “Convergent”Wind: 10 knots, ESE (all three days) or consult the local forecast.-Spill Location: 34 19’ 54’’ N and 119 36’ 47’’ W-Spill Amount: 100,000 barrels (non-weathering)Part 2 questions:1) Describe some of the differences between the 1969 Santa Barbara oil spill and thishypothetical spill.
2) Where did the oil make landfall after the first day? How about the second and thirddays? You can indicate on the map on the next page:3) As a NOAA Oceanographer, where would you recommend the 10 miles of booms stored atSanta Barbara be deployed? Where would you send the extra resources from LA; a day’s driveaway?
Part 3What are the most important things to know about the model?Experiment with wind speed, direction and current. See what happens!Lab Questions:1) What are some important variables in the model? Why are they important? Which do youthink are the most important variables that determine where the oil will end up?2) What kinds of things changed when you made changes to the wind speed and direction?What happened when you changed the current?3) The Channel Islands contain a delicate marine ecosystem. What kinds of conditions wouldthreaten the Channel Islands if there were an oil spill in Santa Barbara channel.4) Although this model was actually used by NOAA, it is several years old. Newer versionstake several other factors into account. Can you think about other things that may affect how oilmoves around that aren’t modeled in this simulation and would improve the accuracy of themodel?
There has been an oil spill off the coast of Santa Barbara. It is your job as a NOAA Oceanographer to do everything possible to reduce the impact of the oil spill on the coastal environment. There are 10 miles of booms available at the NOAA response station in Santa Barbara, but more booms and other coastal cleanup materials need to be loaded