Transcription
Network ForensicsRaymond NunezDept. of Computer Science, Computer Security GroupUP Diliman Computer Center
Disclaimer Intercepting network activities can be theequivalent of a wiretap. Network taps allows you to monitor otherpeople’s traffic WARNING:Do NOT violate privacy or security policies
Forensics
Forensics Systems Disk Memory Log Correlation Malware Analysis Network
Network Forensics How malicious software got in What the system did on the network before,during, and after the malware event What other machines were doing at that time
The packets never lie.Gerald Combs
Evidence Types: PCAP tcpdump / gateway generated Common extensions: pcap, dump, cap Contain the data from the interface to which thesniffer/protocol analyzer was connected
Evidence Types: Logs Excellent corroborating evidence Careful handling - easy to edit Require parsing and searching Collectable from a large number of evidence May not go back far enough May not have sufficient fidelity of data Time Zone settings?
Evidence Types: NetFlow/IPFIX Proprietary term (Cisco): NetFlow Open IETF standard: Internet Protocol Flow Information Expert Based on NetFlow protocol v9Tallies packets sharing common characteristics v5 is the most common, v7, v9Same hosts, ports, and protocolRecords volume, timing, and count of packets
Log Analysis
Note on Time Synchronize all your platform's clocks Check the Time Zone settings Best to store everything in UTC
Proxy Logs Is there a proxy? Is it logging? Whats the configuration?
Tools grep, sed, awk, wc calamari Sawmill / Splunk / LogRythym / RSA Analytics
Data Collection
Constraints
Network Taps
Network ing-tap/
Network tar-lan-tap.html
Passive Network k-tap/
/hw/switches/ps708/products tech note09186a008015c612.shtml
Switches - MAC FloodingBXACMAC FloodEaves ches/ps708/products tech note09186a008015c612.shtml
Switches - ARP PoisonBCARP PoisonXAARP PoisonEaves ches/ps708/products tech note09186a008015c612.shtml
SPAN ts/hw/switches/ps708/products tech note09186a008015c612.shtml
SPAN Ports Cisco's trade name: SPAN port A "soft tap" that duplicates packets Identify specific ports or VLAN
SPAN Ports Pro: Hardware already in place Minimize downtime Simplify/ avoid accreditation hurdlesCon: Speed can suffer - packet loss
Hardware Taps Purpose - built solution By design, all they do is duplicate traffic formonitoring May use monitor port for each direction ofmonitored link Some provide multiple portd of aggregted traffoc
USB Powered thernet-Mirroring-Pass-Through/dp/B003PCHAC6
USB Powered thernet-Mirroring-Pass-Through/dp/B003PCHAC6
Profisharkhttp://www.profitap.com/profishark-1g/
Fiber ic-hack
Hardware Taps Pro: Single-purpose, highly engineered Network traffic is not dropped Redundant and fail-safeCon: Installation process and cost Installing required downtime Cost can be very high, limiting pre-positioning
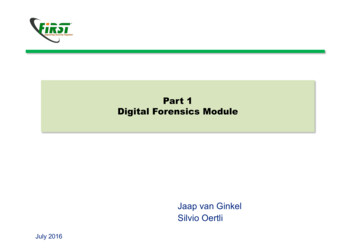
PwnPlug by PwnieExpress Includes 4G/GSM cellular, Wireless (802.11b/g/n), high-gain Bluetooth, &USB-Ethernet adaptersFully-automated NAC/802.1x/RADIUS bypass!Out-of-band SSH access over 4G/GSM cell networks!Text-to-Bash: text in bash commands via SMS!Simple web-based administration with "Plug UI"One-click Evil AP, stealth mode, & passive reconMaintains persistent, covert, encrypted SSH access to your target network[Details]Tunnels through application-aware firewalls & IPSSupports HTTP proxies, SSH-VPN, & OpenVPNSends email/SMS alerts when SSH tunnels are activatedPreloaded with Debian 6, Metasploit, SET, Fast-Track, w3af, Kismet,Aircrack, SSLstrip, nmap, Hydra, dsniff, Scapy, Ettercap, Bluetooth/VoIP/IPv6 tools, & more!Unpingable and no listening ports in stealth mode
Wireless Collection Passive Active 802.11 a/b/g/n/ac Bluetooth / Zigbee ?
OSI Layer 7 Sources WLAN Controller, DHCP Server, DNS Server,Proxy Server, IDS, Firewall All of these can generate logs Logs may require manual processing All corroborate observed activity
NetFlow Data - Internal medata information about traffic flows Not as good as pcaps / headers mainly Smaller in size than full packet capture allowslonger retention Sources: Routers, Firewall, Flow extractors
External Sources ISP or 3rd party Internet DNS services ISPs sometimes retain NetFlow data Other targets or victim
Softwares
TCPDUMP/WINDUMP Low level packet sniffer. Good, if you see a new type of attack or try todiagnose a networking problem. Bad, since you have to look at all these packetsand learn how to interpret them.
TCPDUMP Most widely used capture tool Open-source, cross platform CLI based Based on libpcap Uses BPF Syntax Read from network or pcap file commercial tools can read from/to pcap
The Good Provides an audit trail of network activity. Provides absolute fidelity. Universally available and cheap.
The Bad Does not collect the payload by default. Does not scale well. State / connections are hidden. Very Limited analysis of packages. Collects a given number of bytes from each package: This could turn “trap and trace” monitoring intowiretaping because content might be captured.
Running TCPDUMP Interpret packages in that format. Use the TCP/IP header format.
TCPDUMP Length of capture: tcpdump –s 68 Usual default snap length is 68B We see only 54B, because the ethernet headeris 14B long. Remember, this could become a legal problem ifyou see content.
TCPDUMP sudo tcpdump -n -s 0 -i eth0 -w output.pcap \'host 1.1.1.1 and port 22' Packet loss - CPU, storage, etc. BPF can minimize capture minimization man tcpdump / man pcap-filter
TCPDUMP tcpdump –e host server.upd.edu.ph Displays data link data filtered by host namedserver.upd.edu.ph. Shows Source MAC Destination MAC Protocol 20:37:48.124457 0:8:74:3f:2:46 0:d:56:8:e4:db ip 142: IP192.168.10.1 server.upd.edu.ph: icmp 108: echorequest seq 5476
Cheat Sheet -n Don’t convert host addresses to names. Avoids DNSlookups. It can save you time. -w filename Write the raw packets to the specified fileinstead of parsing and printing them out. Useful forsaving a packet capture session and running multiplefilters against it later -r filename Read packets from the specified file insteadof live capture. The file should have been created with –woption -q Quiet output. Prints less information per output line
Cheat Sheet -s 0 tcpdump usually does not analyze and store theentire packet. This option ensures that the entire packetis stored and analyzed. NOTE: You must use this optionwhile generating the traces for your assignments. -A (or –X in some versions) Print each packet in ASCII.Useful when capturing web pages. NOTE: The contentsof the packet before the payload (for example, IP andTCP headers) often contain unprintable ASCIIcharacters which will cause the initial part of eachpacket to look like rubbish
Cheat Sheet -C Rotate pcap after file size reached -G Rotate pcap after number of seconds -W Limit number of rotated pcap files -F Load BPFs from file -x Print hex for each packet -X Print hex and ASCII for each packet
Running TCPDUMP –x looks at packages in hex format
TCPDUMPOther Options Use the –c extension to limit the number ofpackets captured. Use –v, -vv, -vvv for verbosity. Use –tttt to display time / day stamps. Use –r to specify capture file.
BPF Primitives Several primitives and logical combo: Common: ip, tcp, udp, icmp, host, ether, net,port Qualifiers: src, dst Logic: and, or, not, () Uncommon: vlan, portrange, gateway, offsets:ip[9:1] 0x06
Filters Capture only packages that are useful. Specify in the filter what items are interesting. Filters use common fields such as host or port. Filters also for individual bytes and bits in thedatagram
Filters Format 1: macro and value “tcpdump port 22”Only displays packages going to or from port 22.
Data Reduction Quickly reduces data to what's interesting Loading massive files to Wireshark is not goingto be fun tcpdump -n -r big.pcap -w small.pcap \'not port 443 and not net 224.0.0.0/4 and notport 53'
tcpdump examples Capture and display traffic from a live network interface Filter traffic from an input file to output file for a specific host tcpdump -n -r input.pcap -w output.pcap 'host 192.168.1.1'Create a 14-day ring buffer with one day of DNS traffic each sudo tcpdump -n -s 100 -A -i eth0 -c 1000sudo tcpdump -n -i eth0 -w dns.pcap -G 86400 \-W 14 '(tcp or udp) and port 53'Capture 100MB rotating of data to and from a suspected APT host sudo tcpdump -n -i eth0 -w evil.pcap -C 100 'host 8.8.9.0'
Wireshark GUI based protocol decoder Parses hundreds of different protocols Can be customized as fit Open-source, cross-platform tshark - CLI equivalent
TCPDUMP vs WireShark Less CPU and Memory Footprint Wireshark has the analytics features But known to have 0-Days
PCAP File Format Magic: 0xa1b2c3d4 or 0xd4c3b2a1 Version: 2.4 for libpcap 1.1.1 TZ always UTC 0 Accuracy always 0 snaplen Many link types00x000x040x080x0C0x100x14124Magic NumberMajor Version Minor VersionTime zone offsetTime stamp accuracySnapshot lengthLink-layer header type
PCAP File Format PCAP packet/frame header01240x00Time stamp, seconds value0x04Time stamp, microseconds value0x08Length of captured packet0x0CUn-truncated length of packet data
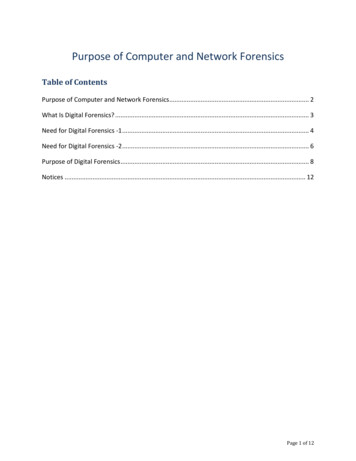
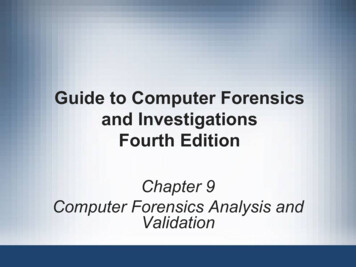
Wireshark Interface
Wireshark: resolution Make sure: Resolve network (IP) address isunchecked in the preference
Wireshark: Time Default: Number of seconds since the packetcapture started View - Time Display Format - Preferred UTCDate Time of Day
Wireshark: Display Filters Robust, protocol-aware filtering Any Wireshark field name can be used Equality: , ! Logic: and, or, not, () Partial text matches (case sensitive): contains RegEx matching: matches
Wireshark: Status Bar Field-name once selected Machine readable is used for filtering Total Packets Percentage and Display Count
Wireshark Display Filters bare - eg dns.qry.name if it is parsed by wireshark then display it negation may not be what you want
Wireshark Display Filtersfrom Packet Contents Right click specific data Apply filter Prepare filter
Wireshark: Follow TCPStream View ASCII/hex content of a stream Right-click TCP packet - Follow TCP Stream Color coded You can select direction of conversation
Wireshark Exploits#!/usr/bin/python #div by 0 in dcp-etsi.c dissector frm scapy.allimport from sys importcrashdata cket IPv6(dst "FF02::1")/UDP(dport 55935,sport 42404)/crashdatasend(packet,inter 1,loop it-from-Defcon-20-CTF.html
tshark It is wireshark Explore data and develop analytic processesin GUI shift to console to scale and scriptAlso useful to perform data reduction usingrobust display filters
tshark Options -r Read from pcap file -w Write output to pcap file -n Prevent all name resolutions (DNS, service, etc.) -Y Specify display filter to use (enclose in single-ticks) -T Output mode: text, fields, pdml, others -e With "-T fields", select fields to display (multiple) -G Display glossary reports (Use "-G ?" for available options)
MonitorDNS queries and replies tshark -Y "dns.flags.response 1" \-Tfields \-e frame.time delta \-e dns.qry.name \-e dns.a \-Eseparator ,
Issues Optimizations - Proxies and AcceleratorsNetwork Address Translation (NAT)VLANsTunnels and VPNEncryptionWirelessCloudBYOD
What to Capture HTTP proxy logs and cache DNS Logs (passive or active) Logs and more logs Flows :-)
Full Capture Scaling Issue privacy and volume reasons duplication of data (depending on capturedpoints) powerful hardware and huge storagerequirement Analysis is difficult and slow
There is no alternativeto FULL packet capturewhen all else fails, go with the FLOW
NetFlow No content - only metadata Source/Dest IPs, protocol, source/dest ports Start and stop times Data volumes sent The ingress interface
Architecture Exporter (device with netflow collection enabled) Collector (where the netflow messages are sent) UDP Storage Analysis Console - nfsen / nfdump / web based
NetFlow v5 Header00x0012VersionRecord Count0x04Exporter Uptime0x08UNIX Time (Sec)0x0CUNIX Time (Nsec)0x10Flow Sequence0x14Engine Type4Engine IDMode. Samp Intervl
NetFlow v5 Flow dstMaskdstPortprotoTOSdstASpad2
nfcapd receives NetFlow data stores data to regular files Flows are stored as binary files nfcapd.YYYYMMddhhmm Files rotate every five minutes (288/day) Separates the capture and processing Time source sync is a must
nfdump tcpdump-like syntax - CLI reads the binary input from nfcapd ASCII or binary output Binary for further nfdump processing ASCII: raw, line, long, extended
nfdump Input Reads from files/directories or STDIN recursively walks directories /var/www/netflow/router/2016/12/10/"
nfdump filter Filters Protocol: tcp, udp, icmp, gre, esp, ah S/D IP address: ip or host (ip or fqdn) S/D Port: port num AS network: as num Logics may be used to link expressions and / or / not
NFSen Web-based Netflow management front-end Open source NetFlow visualivation tool Uses the nfdump engine in the background From Highlevel overview to detailed drill down Prereq: PHP, Perl, RRD
NFSen: Plugins Plugins add additional functionality. Examples: Port Tracker SURFmap SSHcure Botnet Nfsight
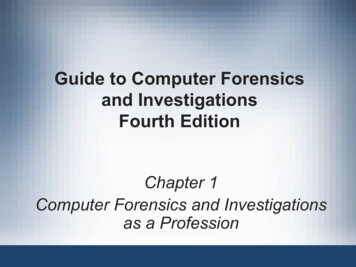
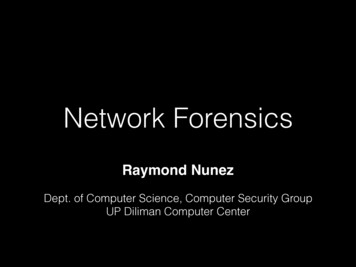
Network Miner Passive network sniffer/packet Detect operating systems, sessions,hostnames, open ports etc. Carve and save transmitted files & certificates Parse PCAP files for off-line analysis
Network Miner
Gerald Combs - 8797684086607872
Backdoors and CNC
Backdoors Remote Access Trojans are so 1990s .php
Backdoors Admin Tools Remote Desktop VNC SSH - Macs have SSH authorized keys :-)
CNC Memory Only Agents / Backdoors (e.g. Meterpreter) DNS ICMP SSL/TLS P2P 2009/08/botnet-tweets/
Mediating Systems Admins vs Network Adminis
Analyzing Encrypted Traffic DNS is our friend Certificates Client profiling using supported ciphers
Detecting APTs Top 20 Number of Connections Top 20 Longest Sessions / Connections Top 20 Bandwidth / Data Percentage of encrypted traffic Destination IP AddressDr. Eric Cole
Filter traffic from an input file to output file for a specific host tcpdump -n -r input.pcap -w output.pcap 'host 192.168.1.1' Create a 14-day ring buffer with one day of DNS traffic each