Transcription
Spotlight on StatisticsU.S. BUREAU OF LABOR STATISTICSMARCH 2016Self-Employment In The United StatesSteven F. Hipple and Laurel A. HammondSince the late 1940s, data on self-employment have been collected regularly as part of the Current Population Survey(CPS), a monthly sample survey of about 60,000 households that provides employment and unemployment data forthe nation’s civilian noninstitutional population ages 16 and older. Since 1967, the official BLS estimates of selfemployment have included only the unincorporated self-employed.Although it is possible to identify the incorporated self-employed separately, they are counted as wage and salaryworkers in the official statistics because, legally, they are employees of their own business. This Spotlight on Statisticsexamines recent trends in self-employment by various demographic and socioeconomic characteristics, includingboth the unincorporated and the incorporated self-employed, as well as data on paid employees who work for the selfemployed.Page 1
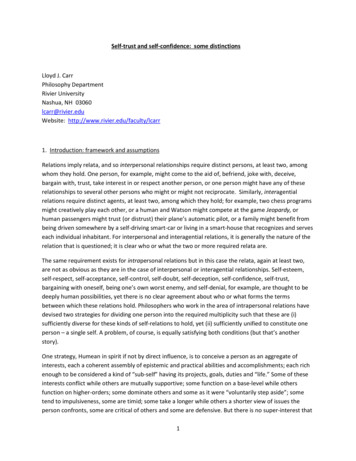
Spotlight on StatisticsU.S. BUREAU OF LABOR STATISTICS15 million people were self-employed in 2015, or 10.1 percent of all U.S.workersSelf-employment continues to be an important source of jobs in the United States. In 2015, 15.0 million people, or10.1 percent of total U.S. employment, were self-employed, including those who had incorporated their businessesand those who had not. Of all the self-employed, 9.5 million, or about 6 in 10, were unincorporated; the remaining 5.5million were incorporated. People who are self-employed typically incorporate their businesses in order to receivetraditional benefits of the corporate structure, including limited liability, tax considerations, and enhanced opportunityto raise capital through the sale of stocks and bonds.Page 2
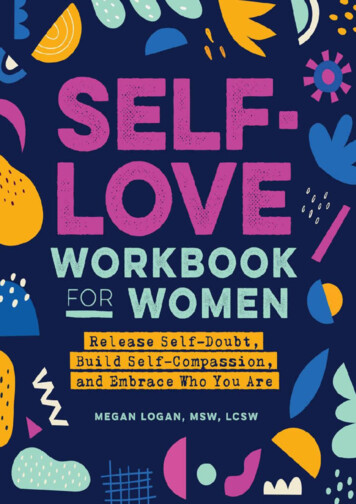
Spotlight on StatisticsU.S. BUREAU OF LABOR STATISTICSThe self-employment rate has trended down over the past two decadesThe self-employment rate—the proportion of total employment made up of self-employed workers—has trendeddown over the past two decades. In 1994, the self-employment rate was 12.1 percent; by 2015, the rate had declinedto 10.1 percent. From 1994 to 2015, the unincorporated self-employment rate fell from 8.7 percent to 6.4 percent.The long-term decline in unincorporated self-employment partially reflects an overall decrease in agriculturalemployment, where a large share of workers are self-employed. At the same time, there has been a decline in theagricultural self-employment rate, which might be due to a decrease in the number of small farms and the emergenceof large farming operations.The decline in the unincorporated self-employment rate might also reflect a general increase in the likelihood ofbusinesses to incorporate. From 1994 to 1999, the share of total employment made up of the incorporated selfemployed ranged from 3.2 percent to 3.5 percent. Over the 2000–08 period, the incorporated self-employment raterose from 3.3 percent to 4.0 percent. The rate then edged down to 3.7 percent in 2010 and remained at that level overthe 2011–15 period.Page 3
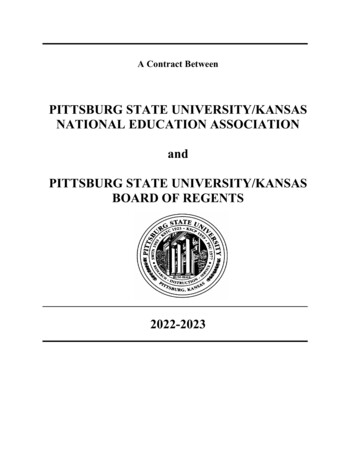
Spotlight on StatisticsU.S. BUREAU OF LABOR STATISTICS29 states and D.C. had self-employment rates below the U.S. rate; 21 hadrates at least as highIn 2015, 29 states and the District of Columbia had self-employment rates below the U.S. rate of 10.1 percent, and 21states had rates as least as high. Montana had the highest rate among states, 16.1 percent, followed by Maine (15.4percent), Vermont (14.4 percent), and South Dakota (14.2 percent). The lowest rates were in the District of Columbia(7.1 percent), Delaware (7.2 percent), and Alabama (7.5 percent).Among the unincorporated self-employed, Maine (11.2 percent) and Vermont (10.0 percent) had the highest selfemployment rates. The lowest unincorporated rates were in the District of Columbia (3.8 percent), Delaware (4.2percent), Virginia (4.3 percent), and New Jersey (4.4 percent). Among the incorporated self-employed, Montana hadthe highest self-employment rate, 7.1 percent, followed by Colorado, 6.4 percent. The lowest incorporated selfemployment rates were in Tennessee (1.9 percent) and West Virginia (2.4 percent).Page 4
Spotlight on StatisticsU.S. BUREAU OF LABOR STATISTICSSelf-employment rates are higher for older workers than for youngerworkersThe self-employment rate for older workers continued to be higher in 2015 than that for younger workers. Theunincorporated self-employment rate among workers aged 65 years and older was the highest (15.5 percent) of anyage group; in contrast, the rates were much lower for their counterparts aged 16 to 24 (1.9 percent). A possible reasonis that younger workers rarely have accumulated the capital and the managerial skills required to start a business,whereas many older workers may be able to acquire these resources through their own efforts or through access tocredit. For all age groups, incorporated self-employment rates were lower than unincorporated rates; however,incorporated self-employment rates also rose with age.Page 5
Spotlight on StatisticsU.S. BUREAU OF LABOR STATISTICSSelf-employment rates for men are higher than those for womenSelf-employment rates are higher for men than women. In 2015, 7.4 percent of men were among the ranks of theunincorporated self-employed, compared with 5.2 percent of women. The incorporated self-employment rate for menwas 4.9 percent, compared with 2.3 percent for women. Men are more likely than women to work in occupations thathave large proportions of self-employed workers—for example, in construction occupations and in managementoccupations.Page 6
Spotlight on StatisticsU.S. BUREAU OF LABOR STATISTICSSelf-employed workers can be found at all levels of educationSelf-employed workers can be found at both ends of the educational attainment spectrum. In 2015, among those aged25 years and older, unincorporated self-employment rates were highest for those with less than a high school diplomaand for those with a professional degree (10.0 and 9.1 percent, respectively) and lowest for individuals with abachelor’s degree or master’s degree (6.2 and 5.2 percent, respectively).Among the incorporated self-employed, self-employment rates were highest for those with a professional degree(12.2 percent) and for those with a doctoral degree (8.4 percent). In contrast, the incorporated self-employment ratefor people with less than a high school diploma was much lower, at 2.1 percent.Page 7
Spotlight on StatisticsU.S. BUREAU OF LABOR STATISTICSSelf-employment rates are higher for Whites than for Blacks or HispanicsWhites continued to be more likely than Blacks or Hispanics to operate their own businesses. In 2015, theunincorporated self-employment rate for Whites was 6.9 percent while the rates for Blacks and Hispanics were 3.6percent and 6.4 percent, respectively. The rate for Asians was 5.6 percent. Incorporated self-employment rates werehighest for Asians and Whites (4.0 percent for both groups).Page 8
Spotlight on StatisticsU.S. BUREAU OF LABOR STATISTICSForeign-born workers are more likely to be self-employed than native-bornworkersAmong the unincorporated self-employed, foreign-born workers were more likely than their U.S. native-borncounterparts to be self-employed in 2015; the rate for the foreign born was 7.6 percent, compared with 6.1 percent forthe native-born. By comparison, the incorporated self-employment rates were about the same for the two groups.Page 9
Spotlight on StatisticsU.S. BUREAU OF LABOR STATISTICSVeterans are more likely than nonveterans to be self-employedVeterans are more likely to be self-employed than nonveterans. In 2015, the unincorporated self-employment rate forveterans was 7.1 percent, compared with 6.4 percent for nonveterans. The higher rate of self-employment amongveterans partially reflects the demographic profile of the veteran population. For instance, employed veterans aremuch more likely than nonveterans to be male, and the self-employment rate for men is higher than the rate forwomen.The higher rate of self-employment among veterans also partially reflects the older age profile of veterans: 40 percentof employed veterans were aged 55 years and older, compared with 21 percent of nonveterans. Older workers aremore likely to be self-employed than younger workers. Indeed, among veterans, the highest rates of self-employmentwere recorded by those who served during World War II, the Korean War, and the Vietnam era; unincorporated andincorporated self-employment rates for these veterans were 15.3 percent and 8.7 percent, respectively. Bycomparison, Gulf War era II veterans—who have a much younger age profile—recorded lower rates of selfemployment: 2.4 percent were classified as unincorporated self-employed, and 2.1 percent were incorporated.Page 10
Spotlight on StatisticsU.S. BUREAU OF LABOR STATISTICSSelf-employed workers are found in many different occupationsThe self-employed are found in a wide variety of occupations. For example, in 2015, unincorporated self-employmentrates were highest for workers in construction and extraction occupations (14.8 percent); management, business, andfinancial occupations (9.7 percent); and sales and related occupations (7.8 percent). Self-employment rates had asomewhat different pattern for incorporated business owners than for the unincorporated self-employed. Among theincorporated self-employed, business ownership rates were highest for management, business, and financialoccupations (8.9 percent) and for sales and related occupations (5.8 percent).Page 11
Spotlight on StatisticsU.S. BUREAU OF LABOR STATISTICSIncorporated self-employed more likely than unincorporated to have paidemployeesThe incorporated self-employed are much more likely than the unincorporated self-employed to have paid employees.In 2015, 42.1 percent of the incorporated self-employed had paid employees, compared with only 14.3 percent of theunincorporated self-employed. Among all of the major demographic groups, the incorporated self-employed weremuch more likely than the unincorporated self-employed to have paid employees.Page 12
Spotlight on StatisticsU.S. BUREAU OF LABOR STATISTICSProportion of unincorporated self-employed with paid employees hasdeclined since 2000The percentage of the unincorporated self-employed with paid employees has trended down over time. In 2015, only14.3 percent of the unincorporated self-employed had paid employees, a decline from 18.7 percent in 2000.Comparable data are not available for the incorporated self-employed; data collection of paid employees for theincorporated self-employed began in 2014. From 2014 to 2015, the percentage of incorporated self-employed withpaid employees edged up from 40.9 percent to 42.1 percent.Page 13
Spotlight on StatisticsU.S. BUREAU OF LABOR STATISTICSSelf-employed with paid employees most likely to employ 1 to 4 workersOf the 1.4 million unincorporated self-employed business owners with paid employees in 2015, 70.0 percent had 1 to4 employees. The proportion with more than 20 employees was very small, at 6.1 percent. The incorporated selfemployed were much more likely than the unincorporated to have paid employees. Of the 2.3 million incorporatedself-employed business owners with paid employees in 2015, 52.1 percent employed 1 to 4 workers while 12.5percent had 20 or more employees.Page 14
Spotlight on StatisticsU.S. BUREAU OF LABOR STATISTICSMore informationSteven F. Hipple and Laurel A. Hammond are economists in the Office of Employment and Unemployment Statistics,Bureau of Labor Statistics.Data on self-employment are obtained from the Current Population Survey (CPS), the official source of employmentand unemployment data in the United States. In addition to classifying employment by occupation and industry, theCPS subdivides the employed by “class of worker”—that is, wage and salary employees, the self-employed, andunpaid family workers. In 1967, it became possible to identify another group of self-employed workers: those whohad reported themselves in the CPS as self-employed and had incorporated their businesses. People choose toincorporate their businesses for a number of reasons, including legal and tax considerations. Since 1989, unpublishedtabulations of the incorporated self-employed have been produced by BLS on a regular basis.In the monthly CPS, employed respondents are asked the question “Last week, were you employed by government,by a private company, a nonprofit organization, or were you self-employed?” Respondents who say they wereemployed by government, a private company, or a nonprofit organization are classified as wage and salary workers.Individuals who say that they are self-employed are asked, “Is this business incorporated?” Respondents who say yesare the incorporated self-employed and are classified as wage and salary workers; respondents who say no areclassified as unincorporated self-employed.Beginning in January 1995, the unincorporated self-employed have been asked the question “Do you usually haveany paid employees?” Respondents who say yes are then asked “Excluding all owners, how many paid employeesdoes your business usually have?” Since January 2014, the incorporated self-employed have also received the twoquestions on presence of paid employees.More data on self-employment are available on the BLS website or by contacting the Division of Labor Force Statisticsby phone at 202-691-6378 or by email at CPSInfo@bls.gov. For more information on recent trends in the number offarms and average farm size, see “Farms and Land in Farms, 2014 Summary” (U.S. Department of Agriculture, NationalAgricultural Statistics Service, February 2015). For an analysis of transitions into and out of self-employment amongolder workers who have career jobs, see “New Evidence on Self-employment Transitions Among Older Workers with CareerJobs” (BLS Working Paper 463, March 2013), by Kevin E. Cahill, Michael D. Giandrea, and Joseph F. Quinn.Page 15
15 million people were self-employed in 2015, or 10.1 percent of all U.S. workers Self-employment continues to be an important source of jobs in the United States. In 2015, 15.0 million people, or 10.1 percent of total U.S. employment, were self-employed, including those who had incorporated their businesses and those who had not.