Transcription
Analysis of National HealthInterview Survey DataChris MoriarityNational Conference on Health StatisticsAugust 18, 2010cdm7@cdc.gov
Presentation outlineNational Health Interview Survey (NHIS)overviewNHIS estimates and variance estimatesAnalysis methods for pooled (combinedannual samples) NHIS data – need toaccount for year-to-year correlationAnalysis of multiply imputed incomedata
The National HealthInterview Survey (NHIS)Conducted continuouslynationwide since July 1957Personal visit interview protocol,collecting data on a broad range ofhealth topicsNHIS home page URL:www.cdc.gov/nchs/nhis.htm
Estimates from NHISdataNHIS has a complex sampledesign, including higher samplingrates of certain groups (black,Hispanic, Asian persons) sampling weights should be usedto make estimates from NHIS dataVariance estimation proceduremust take account of complexsample design in order to be valid
Software for NHISvariance estimationReference: excellent Web pagemaintained by Alan /survey-soft/Software list, comparativesummaries, review articles
Software package list atAlan's websiteAM SoftwareBasculaCENVARCLUSTERSEpi InfoGESIVEwarePCCARPR surveySAS/STATSPSSStataSUDAANVPLXWesVarfree freefreefree free free free American Inst. for ResearchStatistics NetherlandsU.S. Bureau of the CensusUniversity of EssexCenters for Disease ControlStatistics CanadaUniversity of MichiganIowa State Universitywww.r-project.orgSAS InstituteSPSSStata CorporationResearch Triangle InstituteU.S. Bureau of the CensusWestat, Inc.
Variance estimationguidance at NHIS methodspage - 1963 to 2009www.cdc.gov/nchs/nhis/methods.htmSUDAAN, Stata, R survey, SAS surveyprocedures, SPSS, VPLX: Sample codeprovided for use with NHIS dataSAS, SPSS: Guidance provided to avoidproblems with missingDOMAIN/SUBPOP variables in analysesof NHIS data
NHIS year-to-yearcorrelation: why?The U.S. counties (PSUs) selectedat the beginning of a sampledesign period remain the same forthe entire sample design periodConsecutive annual sample casestend to be close togethergeographically - they tend to havesimilar characteristics
Year-to-year correlationover a 10 year sampledesign periodCorrelation is present during theentire sample periodCorrelation may be less for annualsamples years apart than forannual samples closer together
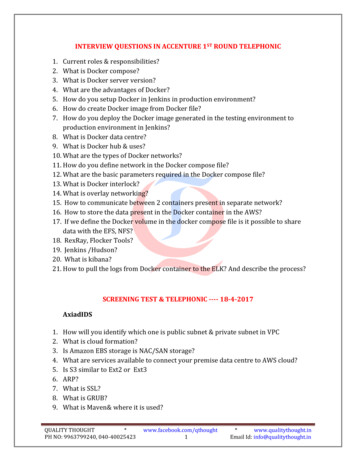
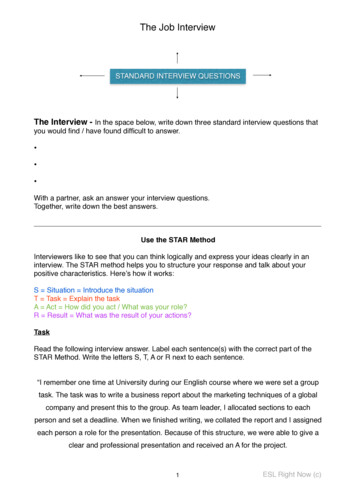
Year-to-year correlationexample: Census Regionpopulation totals (4)Available for all years NHISmicrodata are available; CensusRegion consistently definedReasonable to expect high level ofcorrelation for adjacent years,perhaps a decline over time
Correlation estimates of NHIS annual CensusRegion population estimates - -0906-0806-07-0.2
Variance estimationguidance for combined(pooled) analysesDocumentation for public use filesavailable online at NHIS methods page:www.cdc.gov/nchs/nhis/methods.htmRefer also to appendix "Merging DataFiles and Combining Years of Data inthe NHIS" in the annual NHIS surveydescription document, part of annualNHIS public use file data release
Variance estimation forpooled annual samplesAnnual samples within a sampledesign period are not statisticallyindependentAnnual samples in differentsample design periods are(essentially) statisticallyindependent
Variance estimationwithin a sample designperiod (dependent)Treat pooled annual samples likeone big annual sample for varianceestimationNo recoding of variance estimationvariables required
Variance estimationacross sample designperiods (independent)Need to recode varianceestimation stratum variables indifferent sample design periods tomake sure they are differentVariance estimation stratumvariable values always are 1000;use this fact when recoding
Variance estimationacross sample designperiods - recodesConstruct a new varianceestimation stratum variable fromexisting variables by adding 1000in one design period, 2000 in thenext design period, etc.This guarantees the values will bedistinct in different design periods
Variance estimation forboth "within" and"across"Example: a 2004-2008 pooledanalysisConceptually, the "within" stepcomes first: 2004-2005 in onesample design period, 2006-2008 ina different sample design period
Variance estimation forboth "within" and"across" (continued)Conceptually, the "across" stepfollows the "within" step: dorecoding of variance estimationstrata variables across the sampledesign periods (2004-2005 versus2006-2008) while combining thefive annual datasets into onepooled dataset
Recommended weightadjustment for all pooledanalysesDivide weights by the number ofyears being pooled - simple anddefensibleExample: 2004-2008 pooledanalysis (5 years): divide weightsby 5
More sophisticatedweight adjustment forpooled analysesA user focusing on a particularpooled estimate may prefer aweight adjustment designed tominimize the estimate's varianceIf sample sizes stable: bothmethods (simple, sophisticated)usually give similar weights
Before doing a pooledanalysis - need to checkdata are similarAnalyses of pooled data aremeaningful only when the databeing pooled are similarQuestion wording the same?Answer categories the same?Same target population?
1968: a special case forpooled analysesThere are 1968 calendar year and1968 fiscal year (July 1967-earlyJuly 1968) data files; overlap of67,608 personsThe overlap (January-early July1968) should be removed for apooled analysis that includes bothfiscal and calendar 1968 data
Imputed NHIS incomedataHigh item nonresponse to incomequestions1990-6: hot deck single imputation1997-present: multiple imputation(5 imputations)
1990-6 imputed dataImputed items have allocationflags which allow identification ofimputed dataNo simple method available toestimate uncertainty fromimputation process
1997-present imputeddataImputed items have allocationflags which allow identification ofimputed dataCan use Rubin’s method toestimate uncertainty fromimputation process
New 1997-presentimputed dataNew files contain multiply-imputedvalues, not just ranges, for familyincome and personal earningsTop 5% of values are top-codedAlready released for 2008, releases for1997-2007 and 2009 are coming soon
Correct analysis ofmultiply imputed dataCarry out analysis for eachimputationCombine results of analyses toobtain final result
Incorrect analyses ofmultiply imputed dataPick just 1 imputation and do 1analysisTake the average of theimputations and do 1 analysis
Combining results ofanalysesCan do manually, e.g., by writing a SASmacro programCan do with software such as SASPROC MIANALYZE, mitools R packageCan do analysis and combinationautomatically with software such as miestimate in Stata, mi files, mi count inSUDAAN, etc.
Example: 2006 familyincomePick just 1 imputation (incorrect): 55,583, s.e. 601Take the average of theimputations and do 1 analysis(incorrect): 55,376, s.e. 599Correct: 55,376, s.e. 642
SummaryWeights should be used in analyses of NHISdataVariance estimation requires care, particularlyfor subdomainsAnnual NHIS samples are correlated within asample design period; not correlated acrosssample design periods; pooled analyses needto account for correlation/lack of correlationAnalyses of multiply imputed data shouldfollow the standard protocol in order to obtainappropriate estimates and uncertaintyestimates
Year-to-year CorrelationReferenceMoriarity, C. and Parsons, V.: Yearto-Year Correlation in NationalHealth Interview Survey Estimates,Presented at the 2008 JointStatistical MeetingsAvailable online /y2008/Files/301235.pdf
Interview Survey Data Chris Moriarity National Conference on Health Statistics. August 18, 2010. cdm7@cdc.gov. Presentation outline National Health Interview Survey (NHIS) overview. NHIS estimates and variance estimates. Analysis methods for pooled (combined annual samples) NHIS data -need to