Transcription
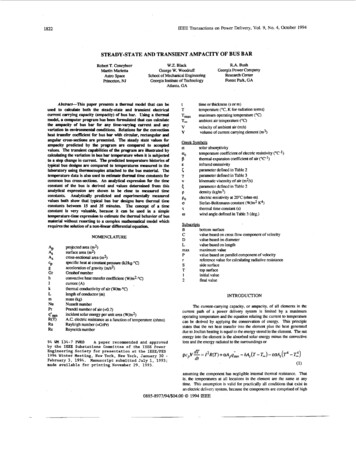
IEEE Transactions on Power Delivery, Vol. 9, No. 4, October 19941822STEADY-STATE AND TRANSIENT AMPACITY OF BUS BARRobert T. ConeybeerMartin MariettaAstro SpacePrinceton, NJW.Z. BlackGeorge W. Woodruffschool of Mechanical EngineeringGeorgia Institute of TechnologyAtlanta. GAAbsslracCThis paper presents a thermal model that can beused to calculate both the steady-state and transient electricalcurrent carrying capacity (ampacity) of bus bar. Using a thermalmodel, a computer program has been formulated that can calculatethe ampacity of bus bar for any time-varying current and anyvariation in environmental conditions Relations for the convectionheat transfer coefficient for bus bar with circular, rectangular andangular cross-sections are presented. The steady state values forampaaty predicted by the program are compared to acceptedvalues The transient capabilitiesof the program are illustrated bycalculatingthe variation in bus bar temperature when it is subjectedto a step change in current. The predicted temperature histories oftypical bus designs are compared to temperatures measured in thelaboratory using ther"plesattached to the bus material. Thetemperature data is also used to estimate thennal time constants forcommon bus cross-sections. An analytiral expression for the timeconstant of the bus is derived and values determined from thisanalytical expression are shown to be close to measured timeconstants. Analytically predicted and experimentally m e w e dvalues both show that typical bus bar designs have thermal timeconstants between 15 and 35 minutes The concept of a timeconstant is very valuable, because it can be used in a simpletemperature-time expression to estimate the thermal behavior of busmaterial without resorting to a complex mathematical model whichrequires the solution of a non-linear sunR(T)RaReprojected area (m2)surface area (m2)cross-sectiona m a (m2)specific heat at constant pressure (kJ/kg C)acceleration of gravityGrashof numberconvective heat transfer coefficient (W/m2."C)currcnt (A)thermal conductivity of air (W/m."C)length of conductor(m)mass 0%)Nusselt numberPrandtl number of air (4.7)incident solar energy per unit area (W/m2)A.C. electric resistanceas a function of temperature (ohms)Rayleigh number ( GrPr)Reynolds number94 WM 134-7 PWRDA paper recommended and approvedby the IEEE Substations Committee of the IEEE PowerEngineering Society for presentation at the IEEE/PES1994 Winter Meeting, New York, New York, January 30 February 3, 1994. Manuscript submitted July 1, 1993;made available for printing November 29, 1993.tTTmaxT,VVR.A. BushGeorgia Power CompanyResearch CenterForest Park,GAtime or thickness (s or m)temperature("C. K for radiation terms)maximum operatingtemperature ("C)ambient air temperature("0 'velocity of ambient air (m/s)volume of cumnt carrying element (m3)Greek Symbolsasolar absorptivitytemperature coefficientof electric resistivity (0c-1) ethermal expansion coefficient of air ( " - 1 )PEinfrared emissivityparameterdefined in Table 25parameterdefined in Table 3YVkinematic viscosity of air (m2/s)parameter defined in Table 25Pdensity g / m 3 )electric resistivity at 20 C (oh")pe0Stefan-Boltmann constant (W/m2 K4)zthermal time constant (s)wind angle defined in Table 3 (deg.)0SubsCriDtsBCDLmaxPrST12bottom surfacevalue based on cross flow component of velocityvalue based on diametervalue based on lengthmaximum valuevalue based on parallcl component of velocityreference value for calculatingradiative resistanceside surfacetop surfaceinitial valuefinal valueINTRODUCTIONThe current-carryingcapacity, or ampacity. of all elements in thecurrent path of a power delivery system is limited by a maximumoperatingtemperature and the equation relating the current to temperaturecan be derived by applying the conservation of energy. This'principlestates that the net heat transfer into the element plus the heat generatcddue to Joulian heating is equal to the energy stored in the element. The netenergy into the clement is the absorbed solar energy minus the convectiveloss and the energy radiated to the SU"IdingS ordrpc V - 2 R ( T ) p q -&(T-T,)-&oAs(T4,ldt-T:)(1)assuming the component has negligible intemal thermal resistance. Thatis, the temperatures at all locations in the element are the same at anytime. This assumption is valid for practically all conditions that exist inan electric dcliveqr system, because the components are comprised of high0885-8977/94/ 04.00 0 1994 IEEE
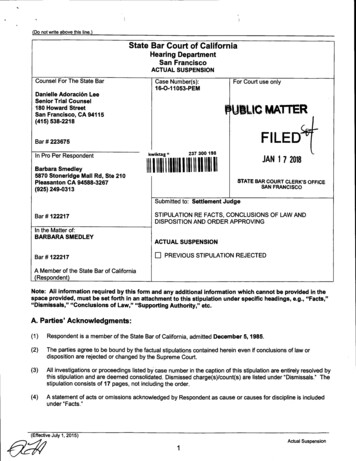
1823conductivity (both thermally and electrically) materials and the majority ofthe thermal resistance resides in the convective layer outside of theconductor.Numerous papers have been written that discuss the calculation ofsteady-state ampacity of current carrying components. Ampacity relatedpapers first appeared in the early 1900's. Many of these early papersconcentrated on ampacity models for underground cables and overheadlies. Fewer have concentrated on the problem of calculating theampacity of bus bar. As the ampacity field matured, the models forcalculating the current canying capacity of conductors became moresophisticated. In the late 1950s two papers were published thatsummarized the existing models used to calculate the ampacity ofunderground cables [I] and overhead lines [2]. During this same period,ampacity models for bus bar centered around steady-state thermal modcls[3-61. Little. if any, effort has been put into the subject of transientampacity models for bus conductors.Equation 1 can be used to determine the relationship between thecomponent temperature and the current it cames. By solving thisdifferential equation, the transient ampacity can be calculated, and if thedifferential term is set equal to zero, the resulting algebraic equationgovems the steady-state ampacity of the element. Transient ratings betterreflect thc thermal performance of a conductor than steady-state values,because a conductor will not instantaneouslyjump from one temperatureto another wheh the current or environmental conditions change. Thecomponent will, however, change temperature gradually as the metalstores energy due to its thermal capacitance.The thermal capacitance can be a significant factor whencalculating the ampacity, because it can lead to a greater current canyingcapability over short periods of time than is revealed by steady-stateampacity calculations. The increase in thermal capacity in some of themore massive elements in the circuit. like transformers, can be sizable,because they have thermal time constants that can range up to days inlength. Smaller and less massive components such as conductors, busbar, line traps and switches have time constants that can range from a fewminutes up to an hour. Therefore. they are capable of storing significantlyless energy. Obviously, given the wide variety of components thatcomprise the current canying path. there may exist a single element thatcan limit the power delivery capability of the entire circuit. This "weakthermal link" can only be revealed by calculating the transient ampacity ofall components in the circuit. Fortunately the cost of bus bar Is very lowcompared to most other components in the overhead system. Thereforethere is little economic penality in selecting an oversixd bus bar to ensurethat it is not the thermal weak link in the system.This is the first in a series of papers that will examine and model thesteady-state and transient ampacity of the current canying components inoverhead transmission and distribution systems. Two follow-on papers tobe submitted next year will propose computer models that are capable ofpredicting the temperature and ampacity of switches and line traps. Thecompilation of programs, along with ampacity programs for transformersand overhead lines, is contained in the EPRI Transmission Workstationsoftware package. The research effort summari7Rd in this paper wasfunded by the Electrical Systems Division of EPRI.When all thermal models are assembled, the weak thermal link inthe network can be determined and corrective measures can beimplemented to upgrade the weak thermal link and thereby increase thecapacity of the entire circuit. The collection of programs can also be usedas a design tool allowing a design engineer to select appropriate overheadhardware that will have compatible steady-state and transient ampacitycharacteristics.NUMERICAL ANALYSISThe equation for steady ampacity can be written by removing thetime derivative term from Eqn. 1 or-The solution to the inverse problem of calculating the steady-stateconductor temperature for a given current'is not as straightfoward andcannot be written in closed form because of the non-linear nature ofEqn. 2.Before Eqn. 2 can be solved for the bus bar temperature, all termsmust be expressed as a function of the component temperature. Forexample, the electrical resistance can be written as a function oftemperature(3)Values for the electrical resistivity at 2OoC and the temperature coefficient.of resistivity for several common conductor materials are listed inTable 1.TABLE 1ELECTRICAL PROPERTIES OF SEVERAL COMMONCONDUCTOR MATERIALS AT 20 CMaterialHard Drawn CopperAluminum 1350-19Aluminum 6061-T6Aluminum 5005-19Aluminum 6063-T6Aluminum 6201-81Aluminum 6101-61Steelpe x 108aex 103w-m (1/ 42.643.533.503.473.833.20The expressions for the convective heat transfer coefficient thatappear in Eqn. 2 are obtained from traditional heat transfer research [7-91and they are typically expressed in terms of dimensionless groups. Thevalue of the convective heat transfer coefficient is a strong function of theair velocity over the surface of the bus bar. For no wind, or free.convection conditions, the values for h are determined from Nusscltnumbers that are given in Table 2 for bus bars with circular, rectangularand angular cross-sections. When the air surrounding the bus bar is inmotion, forced convection conditions exist that correspond to theconvective coefficients listed in Table 3. Since the forms of the Nusseltnumber correlations vary for the different surfaces on the bus bar. thecorrelation taken from Table 2 or 3 must be multiplied by the appropriatesurface area, as indicated in Fig. 1 for tubular, rectangular and angularbus bar. before it can be inserted into Eqn. 2.The radiative properties of bus bar that appear in Eqn. 2 (aand E)are functions of the age and contamination of the surface of the material.New bus with a shiny. unoxidizcd surface has a low emissivity andabsorptivity which minimizes the influence of emitted and absorbedradiation. As bus bar ages, the presence of an oxide layer increases boththe absorptivity and emissivity. Typical emissivity values for aluminumand copper are given in Table 4 [IO-111. Absorptivity values can beestimated by [ 1I]a s 0 . 2 (as1.0)(4)The solar flux (q",,,) that is incident upon the bus. a portion ofwhich that is ultimately absorbed by the bus bar material, can greatlyinfluence thc bus bar temperature. Before the bus bar temperature andampacity can be calculated. the solar energy must be estimated. Accuratepredictions of solar flux values can be calculated by using standardequations that provide clear-sky values for any location on the earth aslong as the date and time of day are specified. Examples of theseequations can be found in Rcf. [12. 131. In order to avoid thecomplications of calculating the solar flux, a reasonable peak summer-
1824time value of 1 kWh? can be used to estimate the effect of solar heatingon ampacity values. Most areas in the Northern Hemisphere rarelyexperience incident solar energy in excess of this value [17].TABLE 3FORCED CONVENTION CORRELATIONS FOR BUS BARTU YLARCROSS-SECTION ISTEADY-STATE AMF'ACITY RESULTSThe ampacity values in Table 5 summarize a comparison of thesteady-state ampacity results published by the Aluminum Association 1141for several common bus bar designs and the predictions of the thermalmodel which results from solving Eqn. 2 and using the convectivecoefficients in Tables 2 and 3. The ampacity values shown in Table 5assume indoor conditions with an ambient temperature of 40 C and amaximum operating temperature of 7OOC. Since the calculations werecarried out for indoor conditions. the ambient air is calm (free.convectionconditions prevail) and no solar energy is incident on the bus bar (q"sun 0). Although the Aluminum Association values were determined bysolving the same energy balance equation, differences between the twomodels are expected to arise, because the two models do not use identicalexpressions for the convective heat transfer coefficient.The computer code presented in this paper is capable ofdistinguishing the ampacity of an angular segment of bus when it isoriented concave up from the ampacity when it is oriented concave down,because it uses different convective conclations for the two orientations.The concave down arrangement produces a stagnant air layer in theconcave section which inhibits the flow of heat from the bus bar.Therefore the program predicts a higher ampacity when angular bus bar isplaced concave upward. The ampacity values from Ref. [14] do notTABLE 2FREE CONVECTION CORELATIONS FOR BUS BARNUD y l o[-O.O7O43 0.31531loglo Reg o.O3553(log10 Reo)*y 1.194-sino -0.194cos(2w) 0.368sin(2o)VDReD NU -hDkthere:w(wPr angle between wind and normal to bus0 denotes normal or cross flow)0.7Cross FlowRe, 5x10⁵N q (0.033(ReC)'.*)-799 (o.033(Re )0.8)-799Re, 5 x 1 0 5NUT 0.59( Re,)*/*NUB O.59(Rec)112LD NU -Pr vhere:component lengthcomponent outer diameter0.7mCTANGUmR AND ANGULAR CROSS-SECTIONS r71Nus [o.825 0 . 3 0 5 3 ( G r d ' ] 2R a 1 x lo7NUT 0.54(Ra)::Ra 1x10⁷NU, 0 . 5 4 ( R ) " NU, 0 . 2 7 ( R ) " NU, 0.27(Ra)Ra GrPrhxNU -k{here:xPr height for vertical surfaceswidth for horizontal surfaces0.7Flow,NUT NUB Rep 5 x lo5NUT 0.59( Rep)112112NUB 0.59( Re
ampacity of bus bar. As the ampacity field matured, the models for calculating the current canying capacity of conductors became more sophisticated. In the late 1950s two papers were published that summarized the existing models used to calculate the ampacity of underground cables [I] and overhead lines [2]. During this same period,