Transcription
NewsomPsy 521/621 Univariate Quantitative Methods, Fall 20201Missing DataSome degree of missing data is nearly inevitable in social and behavioral sciences. Missing values canoccur for a variety of different reasons and can occur in a variety of different patterns. Individuals may fail torespond to some questions on a scale or test, some participants may be missing an entire assessment(e.g., participant drops out), such as when a participant completes the pretest but not the posttest, or datamay be missing in a planned fashion, as when a random selection of participants are given a specialmodule in a survey.Before discussing some classic definitions and remedies for dealing with missing data, I will first describe afew computational details about how missing data are routinely handled in SPSS and R.Computational Details and Missing Data in SPSSThere are several somewhat small details with how missing data are handled by some common operationsin SPSS that may have major implications for how a computed variable may be interpreted. These detailsinvolve very common circumstances for researchers, and I’m not sure all researchers are always fullycognizant of them.MEAN function. One can compute a new variable by averaging several variables using a COMPUTEstatement and the MEAN function. For each person, the MEAN function takes an average of the values foreach variable that is listed. For example, if you want to create a composite measure by averaging variablesX1 through X4, you would do the following:COMPUTE NEWVAR MEAN(X1,X2,X3,X4).An alternative way to compute the same thing is by using the following:COMPUTE NEWVAR (X1 X2 X3 X4)/4.If there are any data missing for variables X1, X2, X3, or X4, however, these two methods will not giveequivalent results. Assume we have a small data set of only 5 subjects. A period '.' indicates a .14.NEWVAR(MEAN Function)251268NEWVAR(adding and dividing)2.12.When the MEAN function is used, SPSS computes the average of the variables in the list for a subject basedon whatever data are available, even if only one of the variables is present for a subject. The secondmethod in which the variables are added and then they are divided by the number of variables will notproduce a result for the variable NEWVAR unless all of the variables are present.Notice that one way to think about how the MEAN function computes the average is that the mean of theitems for a case is assumed to be the value for the missing values for that case. For example, for subject 4in above example, the value for NEWVAR using the MEAN function is the same as if the scores were 7,6,5,6,where the missing values are assumed to be equal to the average score in the list for that person.SUM Function. Analogous methods can be used to compute the sum of a set of variables when creating acomposite score.COMPUTE NEWVAR SUM(X1,X2,X3,X4).
NewsomPsy 521/621 Univariate Quantitative Methods, Fall 20202Alternatively, one could specify it this way:COMPUTE NEWVAR X1 X2 X3 X4.Let’s see what the NEWVAR scores look like with these two methods, using the data from the 5.2.14.NEWVAR(SUM Function)81548128NEWVAR(adding)8.48.NEWVAR is not computed using the adding method unless all the data are present. The SUM function,however, computes a sum based on the data available. This means that the sums will tend to be lower forindividuals who have any missing data on the variables in the list. Notice that this is equivalent to assumingthat the missing data are equal to ‘0’s. For example, using the SUM function, the data for subject 4 is reallyassumed to be: 7,0,5,0.Requiring a certain number of present cases of the SUM or MEAN function. One can require that allor some of the values in the list be nonmissing when either the SUM or the MEAN function are used byspecifying a number after the MEAN or SUM function. This is best explained with an example:COMPUTE NEWVAR MEAN.3(X1,X2,X3,X4).orCOMPUTE NEWVAR SUM.3(X1,X2,X3,X4).The above command requires that at least three of the values be present or NEWVAR will not be computed.In the above examples, subject 3 would get a score but subject 4 and 5 would not. Any value can be usedin place of ‘.3’ up to the number of variables in the list. Note that .1 does not do much good, since one hasto have at least one variable present to get a value of NEWVAR anyway. Note also that using .4 in thisinstance is the same as using the adding method.Computational Details and Missing Data in RCreating composite scale scores is not as convenient in R. Several ways are shown below. The scalescore is not computed if any of the items are missing for a case in the first two methods.#simple ways to compute mean composite (no missing data allowed)#lessRd Transform(ias (q1 q2 q3 q4 q5 q6 q7 q8 q9 q10 q11 q12)/12)d#base Rd ias (d q1 d q2 d q3 d q4 d q5 d q6 d q7 d q8 d q9 d q10 d q11 d q12)/12d ias#more complicated (missing data can be replaced by mean or median of items)library(psych)#name the itemskeys.list list(ias 1:12)#keys are weights used in scoring--all 1s here and usually the casekeys - make.keys(12,keys.list,item.labels colnames(d)[1:12])#scoreItems can compute composite index but also can compute Cronbach's alpha#impute "mean" gives mean response when missing,#impute "none" computes only if all present, which is the same as missing FALSE#totals FALSE compute the average rather than the sumiasdata - scoreItems(keys, d, missing FALSE, totals FALSE, impute "mean",digits 3)iasdata scores
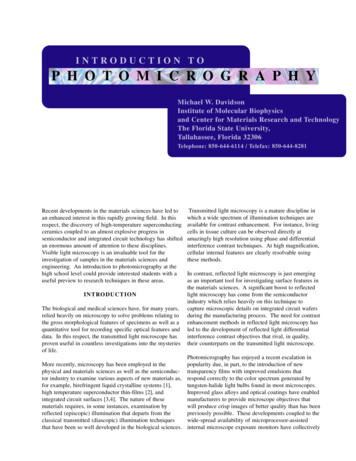
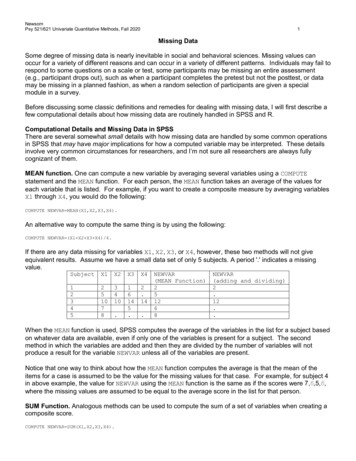
NewsomPsy 521/621 Univariate Quantitative Methods, Fall 20203#add mean scores back into d with itemsd data.frame(d,iasdata scores)dMechanismsMAR and MCAR. A distinction about the nature of missing data was made by Rubin (1976; Little, 1995),who classified missing values as missing at random (MAR), missing completely at random (MCAR), orneither. Both MAR and MCAR require that the true values of the variable with missing values be unrelatedto whether or not a person has missing values on that variable. For example, if those with lower incomesare more likely to have missing values on an income question, the data cannot be MAR or MCAR. Thedifference between MAR and MCAR is whether or not other variables in the data set are associated withwhether or not someone has missing values on a particular variable (say Y). For example, are older peoplemore likely to refuse to respond to an income question? If other variables are related to missingness on Y,then the missing values are MAR. If no other variables are related to missingness, then missing values areMCAR. The term “missing at random” is confusing because values are not really missing at random—forMAR, missingness seems to depend on some of the variables in the data set. MCAR is more what we thinkof when we think values are missing at random. For MCAR, it is as if we took a completely random selectionof cases, and deleted their values for a Figure 13.1. Analogue representation of missing data mechanisms. Adapted from Schafer and Graham (2003). Reprinted from Newsom (2015). The variable zrepresents the true, but unknown, cause of missingness. In the figure, ymis is the variable of interest that has some missing data, yobs is another variable with nomissing data, m is the missingness indicator, and z is the true cause of the missingness.Determining Whether Missing Values Are MARResearchers can investigate whether any variables in the data set are related to missingness on a variableby computing a new variable that indicates (0, 1) whether data are missing or present and then usingcorrelations or group comparisons. Little (1988) developed a simultaneous test along these lines. 1 If noneof the variables in the data set are related to missingness, then the data are observed to be missingcompletely at random, although this does not guarantee that the values for the missing variable are notrelated to missingness for that variable (Allison, 2002). Practically speaking it is not possible ever todetermine whether the true values of a variable are related to the probability of missingness on thatvariable, because we do not have the missing information. As Schafer and Graham (2002) state: "Whenmissingness is beyond the researcher's control, its distribution is unknown and MAR is only an assumption.In general, there is no way to test whether MAR holds in a data set, except by obtaining follow-up data fromnonrespondents or by imposing an unverifiable model." (p. 152). With attrition over time, it may be possibleto test whether missingness is associated with the value of the variable that has present values at an earliertime point (i.e., usually all case have mostly complete data at the first time point). For example, in a pretestposttest design, we could investigate whether the variable at Time 1 (i.e., with complete data) is associatedwith the missingness for that variable at Time 2 (Little, 1995), which provides some information but is nearlyalways an imperfect proxy. In other circumstances, one may have to provide a theoretical argument thatmissingness is not associated with the variable or rely on information in the literature. Recent workillustrates that modeling potential causes or correlates of the variables with missing values has importantadvantages when values are only MAR, particularly when the association of those “auxiliary” variables withthe variable with missing values is high (e.g., .4) and when the amount of missing data is large (e.g., 25%; Collins, Schafer, & Cam, 2001; Graham, 2003). So, to the extent that we can incorporate some of thevariables or proxies for the variables that may be causally related to the probability of missingness, we mayLittle's test for MCAR, [Little, R.J.A. (1988). A test of missing completely at random for multivariate data with missing values. Journal of theAmerican Statistical Association , 83, 1198-1202] can be conducted in SPSS with the missing data module (must be separately purchased), in SASusing Craig Ender's macro tml, and through other specialty packages such as Mplus.1
NewsomPsy 521/621 Univariate Quantitative Methods, Fall 20204be closer to meeting the MAR assumption. For this reason, there is an argument for always using modernmissing data techniques, such as multiple imputation or full maximum likelihood estimation (see below),because there are few if any cases in which listwise deletion would provide better statistical tests.Dealing with Missing Data: Conventional MethodsThere are a variety of less sophisticated methods of handling missing data that are worth mentioning,because several of them are still employed in certain circles.Listwise deletion. Most analyses that we have studied, including t tests, ANOVA, chi square, andregression, require that all cases have data on all of the variables specified in the analysis. Until morerecently, listwise deletion has been the most common way of dealing with missing data. That is, completedata were required on all variables in the analysis—any cases with missing values on one or more of thevariables was eliminated from the analysis. Because statistical software programs have not incorporatedbetter approaches in their common statistical test procedures, listwise deletion is still overwhelmingly themost common way of dealing with missing data. When there are small percentages of missing data (5%,10%, less than 20% of cases are lost with listwise deletion?), there may not be serious harm in this practice(Arbuckle, 1995. In the last few years, however, researchers have begun to use data estimation techniques,such as multiple imputation, more often, particularly when many cases will be lost in the analysis. Andsimulation studies convincingly show that when there are a lot of missing values, listwise deletion will havebiased parameters and standard errors (see Enders, 2001, for an illustration).Pairwise deletion. Pairwise deletion is what occurs when correlations are required. You get themaximum N for each pair of variables. The correlation of X1 with Y1 may have a different N than thecorrelation of X1 with Y2. Pairwise deletion is a possible option in some analyses, such as multiple regressionor structural equation modeling, but there are other potential problems with the approach and I do notrecommend it (see Enders, 2010, for more information).Other imputation methods. There are several other estimation approaches in which the data areimputed. That is, a full data set is created based on the imputation method that fills in data based oninformation from existing data. Older methods, such as mean imputation (in which the average of all scoreson a variable for individuals with data is filled in for a case that has a missing value on that variable),regression-based methods (in which a regression is used to predict a score), and resemblance-based “hotdeck imputation” (in which new values are imputed using similar cases) do not perform as well as othermethods, and some may produce highly biased coefficients and/or standard errors (Gold & Bentler, 2000).Dealing with Missing Data: Modern MethodsModern approaches, in particular multiple imputation (MI; Rubin, 1987) and full maximum likelihood (FIML;Dempster, Laird, & Rubin, 1977, which uses a structural modeling approach), produce superior estimatescompared with listwise deletion and the other conventional methods mentioned above as long as data areat least MAR (Enders, 2010; Schafer & Graham, 2002). The standard multiple imputation approach requiresan initial step (the I Step) in which multiple data sets are imputed with some degree of uncertainty built intothe imputed estimates. There are a number of different methods for doing this (see Enders, 2010, for a nicesummary). Current recommendations are for approximately 10 to 20 imputed data sets (Graham, Olchowski& Gilreath, 2007; 20 seems to be the most commonly suggested number lately). In the second stepanalyses (the P step), the multiple, imputed data sets are analyzed and results are combined (or "pooled")using variability across the multiple imputations to better estimate standard errors in the analysis. Specialsoftware or special procedures within existing software are needed for multiple imputation, including SPSSMissing Values (which is an add-on with additional cost), several packages, such as mice and mitml in R,and free software Blimp (Enders, Keller, & Levy, 2018), which also handles multilevel data sets.Structural equation modeling packages, such as Mplus, AMOS and the lavaan package in R, useFIML that is employed seamlessly in a single step when specifying a model (Mplus also can be used forMI). Regression models can be specified within these packages conveniently by simply requesting FIMLestimation (often it is the default). These types of models are regression-based, and, although models canbe constructed to test group difference hypotheses, structural equation modeling packages are generallynot set up for analysis of variance per se as we are familiar with at this point.References and Further Reading
NewsomPsy 521/621 Univariate Quantitative Methods, Fall 20205Arbuckle, J.L. (1996) Full information estimation in the presence of incomplete data. In G.A. Marcoulides and R.E. Schumacker [Eds.] Advancedstructural equation modeling: Issues and Techniques. Mahwah, NJ: Lawrence Erlbaum Associates.Bernaard, C.A., & Sijtsma, K. (2000). Influence of imputation and EM methods on factor analysis when item nonresponse in questionnaire data isnonignorable. Multivariate Behavioral Research, 35, 321-364.Collins, L. M, Schafer, J.L., & Kam, C-M. (2001). A comparison of inclusive and restrictive strategies in modern missing data procedures. StructuralEquation Modeling, 6, 330-351.Dempster, A. P., Laird, N. M., & Rubin, D. B. (1977). Maximum likelihood from incomplete data via the EM algorithm. Journal of the Royal StatisticalSociety, Series B, 39, 1–38Downey and King (1998). Missing data in likert ratings: A comparison of replacement methods. The Journal of General Psychology, 125, 175-191.Enders, C. K. (2001). The performance of the full information maximum likelihood estimator in multiple regression models with missing data.Educational and Psychological Measurement, 61, 713-740.Enders, C. K. (2010). Applied missing data analysis. Guilford Press.Enders, C.K., Keller, B.T., & Levy, R. (2018). A fully conditional specification approach to multilevel imputation of categorical and continuousvariables. Psychological Methods, 23, 298-317. http://dx.doi.org/10.1037/met0000148.Gold, M.S., & Bentler, P.M. (2000). Treatments of missing data: A Monte Carlo comparison of RBHDI, iterative stochastic regression imputation,and expectation-maximization. Structural Equation Modeling, 7, 319-355.Graham, J. W., Olchowski, A. E., & Gilreath, T. D. (2007). How many imputations are really needed? Some practical clarifications of multipleimputation theory. Prevention Science, 8(3), 206-213.Little, R.J.A., & Rubin, D.B. (1989). The analysis of social science data with missing values. Sociological Methods and Research, 18, 292-326.Little, R. J., & Rubin, D. B. (2002). Statistical analysis with missing data. New York: Wiley.Newsom, J.T. (2015). Longitudinal structural equation modeling: A comprehensive introduction. New York: Routledge.Rubin, D.B. (1987). Multiple Imputation for Nonresponse in Surveys. John Wiley & Sons Inc., New York.Schafer, J.L., & Graham, J.W. (2002). Missing data: Our view of the state of the art. Psychological Methods, 7, 147-177.
missing data techniques, such as multiple imputation or full maximum likelihood estimation(see below) , because there are few if any cases in which listwise deletion would provide better statistical tests. Dealing with Missing Data: Conventional Methods