Transcription
Department ofHospitalitypyAdministrationData BookletFall Term 2007Quality EnhancementReviewprepared by the Office of Institutional Research,Budget & Analysis Department
Hospitality Administration DepartmentFALL TERM 2007Most recent available statisticsDegrees Offered2ReportPage No(s)1Faculty72Majors (Fall 2006 63-53-53-53-52006-2007 Degrees 0SDCF*calculatedAverage Class Size (Fall 2006)UndergraduateLower - classroomUpper - classroomGraduate - classroomCredit Hours - Annual (2006-2007)FundableNon-fundableTotalUniversity (fundable)2006-2007 Department Fundable Hours As Percent of University Fundable HoursStudent FTE's- Annual (state fundable 2006-2007)139.4Credit Hours Percentages by Instructor Type (Fall 2005)FacultyFaculty OverloadAdjunctsGraduate AssistantsA&P/USPSPhased RetirementOthersAverage Total Credit Hours Taught per Faculty FTE (All Hours, 2005-2006)Fall TermSpring TermAcademic YearAnnual Student FTE's Taught by all Faculty (Fall & Spring total hrs converted to annual FTE's, 2005-2006)Undergraduate (academic year hours/40)Graduate (academic year hours/32)TotalDoctoral Students/Faculty Ratio (source: Research-Doctorate Programs in the United States- 1993 Study, N.R.C.)National AverageFSU tedNot reported by NRCNot reported by NRCNRC*NRC*Annual C&G expenditures (2005-2006)Annual C&G expenditures per Faculty (2005-06) [Using 9.00 Filled Faculty from IR Faculty Salaries Report] Please contact Donna Smith in FSU IR (644-4203) if you would like additional information about UDE Study.259.7241.9501.61616 in expenditures and in faculty courses and hours taught. *SDCF Student Data Course File, NRC National Research alculatedcalculatedcalculated266352Annual E&G Expenditures (2006-2007)Annual Student FTE's (state fundable 2006-2007)Annual E&G Expenditures per Annual Student FTE (2006-2007)Note: most statistics are based on the Hospitality Administration account 115xxx. Related accounts may not be 6Delaware Study , Hours Taught per Faculty (instructional faculty only, Fall 2004, national research univ.)FSU Hours taught per Faculty (instructional faculty only, Fall 2004)8 1,512,487139.410,850208calculated 114,61212,73521calculated
Hospitality Administration Department ReviewFall Term 2007Table of ContentsPageDegree Programs .1The Faculty .2Majors .3Degrees Awarded .6Average Class Size .7Credit Hours by Semester/Fall & Spring/AnnualFundable.8Non-fundable .9Total.10Credit Hours and Courses by Instructor Type .E&G Detail 2001-02 to 2005-06 .11Faculty Courses and Hours 2001-02 and 2005-06(Individual Faculty Summary)2001-02 .122005-06 .13Delaware Study, Hours Taught per Faculty.14E&G Budgeted Faculty and Staff Lines .19E&G Beginning of Year Budget .20C&G Expenditures .21E&G Expenditures by Summary Object Code .22Unit Accomplishment Summary Pages 1 and 2 .23
COLLEGE OF BUSINESSHOSPITALITY ADMINISTRATIONDEGREE PROGRAMSMajor NameHospitality AdministrationMajor Code215710CIP Code520901Degree OfferedBachelorsMajor NameProfessional Golf ManagementMajor Code215711CIP Code520901Degree OfferedBachelorsSource: Degree Program Inventory, FSU and SUS
Hospitality AdministrationDEMOGRAPHICS OF FACULTYNAMEFIRSTHIDEGDEG UNIVBRYMERROBERTDOCTUniversity of Denver900199Professor0918/1/81MWBONNMARKDOCTTexas A&M EYDOCTVirginia Tech rida State University900299Associate Professor0918/1/89FWLATOURCHARLESBACHMichigan State SSouthern Methodist OCTBrigham Young University900499Instructor12312/2/91MWLast Updated on 6/22/07By Department of Hospitality AdministrationCLASS ADMIN CODE TITLEMO TENURE FSU HIRE GENDER RACE
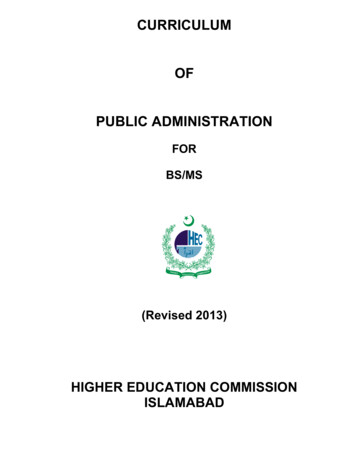
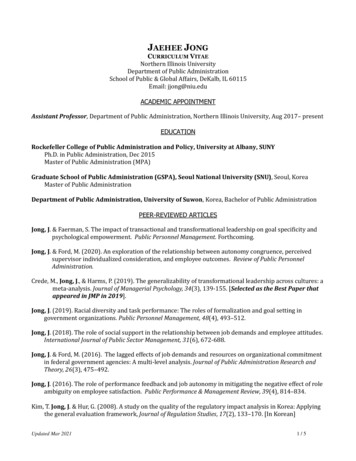
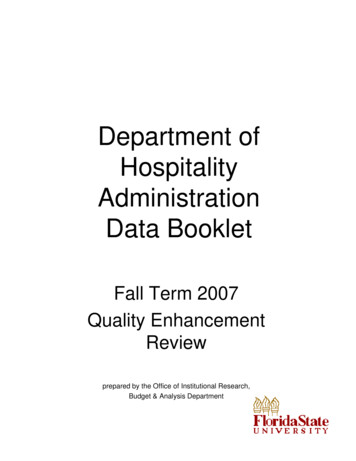
College of BusinessDedman School of Hospitality AdminEnrollment by Fall SemesterHospitality JuniorSeniorTotal200022876106200124872122Source: Fall Preliminary Student Data Course 61075107192
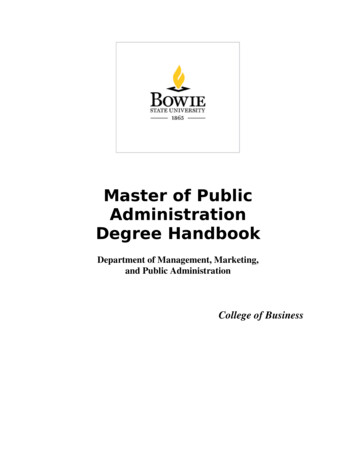
College of BusinessDedman School of Hospitality AdminEnrollment by Fall SemesterProfessional Golf niorTotal20022439200318514Source: Fall Preliminary Student Data Course Files20041020044109232005112132620061121124
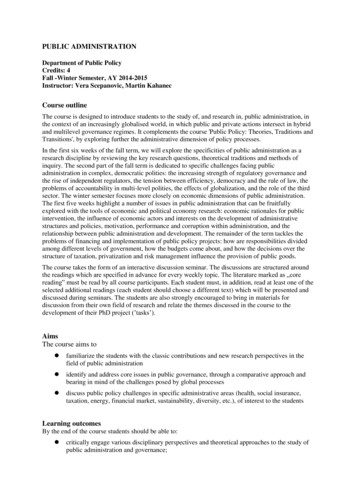
College of BusinessDedman School of Hospitality AdminEnrollment by Fall 479471069056FemaleFemaleMaleMaleAmerican Indian or Native AlaskanAsian or Pacific IslanderBlackHispanicNon-Resident AlienWhiteTotalAsian or Pacific IslanderBlackHispanicNon-Resident AlienWhiteNot ReportedTotalDepartment TotalSource: Fall Preliminary Student Data Course 13211413867228173187723925948068282146181182186216
COLLEGE OF BUSINESSHOSPITALITY ADMINISTRATIONDEGREES AWARDED BY SEMESTERCIP Code: ummer '021919Fall '02Spring '03213521352002-03Total75752003-04Summer '031111Fall '03Spring '04185018502003-04Total79792004-05Summer '04Fall '04172817282002-03Spring '05382004-05Total8338832005-06Summer '051515Fall '05Spring '06253525352005-06Total75752006-07Summer '06Fall '0618221822Spring '0748Total8848882006-07Source: Final Student Data Course Files (SDCF)Note: Some 2006-07 degrees have been earned, but not yet reported on the official data files.2006-072005-062004-052003-042002-030
COLLEGE OF BUSINESSHOSPITALITY ADMINISTRATIONAVERAGE CLASS SIZEAverage Class Size (Cs, Ds, Ls 4.32011.58.2DiscussionClassLectureTotalFall 2003 UpperGraduateTotalFall 2004 UpperGraduateTotalFall 2005 LowerUpperFall 2006 lmentNumber ofSectionsClassSizeEnrollmentNumber ofSectionsClassSizeEnrollmentNumber 047.48251845.8GraduateTotalFall 2006Fall 2003Fall 2002Class LectureFall 2002 UpperGraduate3.01.0Fall 20051.00Fall 211.597424.3Class LectureFall 2006 Enrollment by Class TypeDiscussionLaboratoryAll Others724449723Source: Instructional Activity File
College of BusinessDedman School of Hospitality AdminFundable Student Credit Hours and FTESCH ProducedAnnual FTE ContributionSummerSummerLevelUpperGrad IGrad 415,322FallLevelLowerUpperGrad IGrad .112.5LevelLowerUpperGrad IGrad 71.362.454.8LevelLowerUpperGrad IGrad 005-060.3129.60.32006-071.1137.90.5130.1139.4Fall & SpringLevelLowerUpperGrad IGrad IITotalAnnualAnnualLevelLowerUpperGrad IGrad IITotal200412.5SpringFall & SpringLevelLowerUpperGrad IGrad IITotal20033.70.8FallSpringLevelLowerUpperGrad IGrad IITotalLevelUpperGrad IGrad perGrad IGrad IITotalSource: Final Student Data Course FilesNote: Lower and Upper hours are divided by 40 to obtain annual FTE; for Graduate I, Graduate II and Graduate III, hours are divided by 32Distribution of Annual FTE by Semester Within 0%2006-074.5%39.3%56.2%100.0%
College of BusinessDedman School of Hospitality AdminNon-Fundable Student Credit Hours and FTESCH ProducedAnnual FTE ContributionSummerSummerLevelUpperGrad IGrad 3003200709039FallLevelLowerUpperGrad IGrad 90.012.1LevelLowerUpperGrad IGrad .70.1LevelLowerUpperGrad IGrad .60.015.912.6Fall & 2712LevelLowerUpperGrad IGrad IITotalAnnualAnnualLevelLowerUpperGrad IGrad IITotal200412.1SpringFall & SpringLevelLowerUpperGrad IGrad IITotal200315.90.0FallSpringLevelLowerUpperGrad IGrad IITotalLevelUpperGrad IGrad 2006-0705040630504LevelLowerUpperGrad IGrad IITotalSource: Final Student Data Course FilesNote: Lower and Upper hours are divided by 40 to obtain annual FTE; for Graduate I, Graduate II and Graduate III, hours are divided by 32Distribution of Annual FTE by Semester Within .0%2006-0797.6%0.6%1.8%100.0%
College of BusinessDedman School of Hospitality AdminTotal Student Credit Hours and FTESCH ProducedAnnual FTE ContributionSummerSummerLevelUpperGrad IGrad 005112,488212,8622,520FallLevelLowerUpperGrad IGrad 0060.554.420.30.124.6LevelLowerUpperGrad IGrad 71.663.154.9LevelLowerUpperGrad IGrad 005-060.3144.80.92006-071.1150.50.5146.0152.0Fall & Grad IGrad IITotalAnnualAnnualLevelLowerUpperGrad IGrad IITotal200424.5SpringFall & SpringLevelLowerUpperGrad IGrad IITotal200319.60.8FallSpringLevelLowerUpperGrad IGrad IITotalLevelUpperGrad IGrad pperGrad IGrad IITotalSource: Final Student Data Course FilesNote: Lower and Upper hours are divided by 40 to obtain annual FTE; for Graduate I, Graduate II and Graduate III, hours are divided by 32Distribution of Annual FTE by Semester Within .8%100.0%2006-0712.2%36.1%51.6%100.0%
Hospitality Administration - Faculty Courses & HoursFall 2001 - Spring 2002Faculty 9002900290049121Organized Classes TOTALSAVERAGE PER Hospitality Administration - Faculty Courses & HoursFall 2001 - Spring 2002Faculty 9002900290049121Individualized 001.001.00TOTALSAVERAGE PER .01.0Hospitality Administration - Faculty Courses & HoursFall 2001 - Spring 2002Faculty 9002900290049121TOTALSAVERAGE PER FACULTYAll 023.023.063.06.34.34.367.36.7
Hospitality Administration - Faculty Courses & HoursFall 2005 - Spring 2006Faculty DIOOHLINRISCIGNOClass 090021.0090021.5091202.00TOTALSAVERAGE PER FACULTYOrganized Classes 8.0163.0224.078.0189.0106.0129.0101.0SectionsUGrad 04.2SectionsUGrad lity Administration - Faculty Courses & HoursFall 2005 - Spring 2006Faculty DIOOHLINRISCIGNOClass 090021.0090021.5091202.00TOTALSAVERAGE PER FACULTYIndividualized 3.30.30.313.33.3Hospitality Administration - Faculty Courses & HoursFall 2005 - Spring 2006Faculty DIOOHLINRISCIGNOClass 090021.0090021.5091202.00TOTALSAVERAGE PER FACULTYAll ionsTOTALUGrad 3.03.03.03.06.02.02.048.05.33.31.751.35.72103 Faculty courses hours Y0102-y0506.xls
Department of Hospitality AdministrationE & G Student Credit Hours and Headcount ProductivityBy Instructor TypeStudentFTECredit HrsHeadcount/SCH/FTEHeadcountFall 2001FacultyOPS Regular FacultyOPS Faculty AdjunctsGraduate AssistantsA & P / USPSOthersOPS Regular FacultyOPS Faculty AdjunctsGraduate AssistantsA & P / 2.57330000073387.40.00.00.00.00.087.4OPS Regular FacultyOPS Faculty AdjunctsGraduate AssistantsA & P / 0.00.0119.2OPS Regular FacultyOPS Faculty AdjunctsGraduate AssistantsA & P / 109.60.00.00.00.00.0109.6OPS Regular FacultyOPS Faculty AdjunctsGraduate AssistantsA & P / USPSOthersSource: Instruction Research Data .00.086799.10.00.00.00.00.099.1FacultyOPS Regular FacultyOPS Faculty AdjunctsGraduate AssistantsA & P / acultyOPS Regular 00.084.1OPS Faculty AdjunctsGraduate AssistantsA & P / USPSOthersFacultyOPS Regular 0.0122.4OPS Faculty AdjunctsGraduate AssistantsA & P / .095.0Spring 2001Fall 2005FacultyHeadcount/SCH/FTESpring 2004Fall 2004FacultyCredit HrsSpring 2003Fall 2003FacultyFTESpring 20029.5000009.5Fall 2002FacultyStudentFTEFacultyOPS Regular FacultyOPS Faculty AdjunctsGraduate AssistantsA & P / USPSOthersSpring 2006FacultyOPS Regular FacultyOPS Faculty AdjunctsGraduate AssistantsA & P / USPSOthers
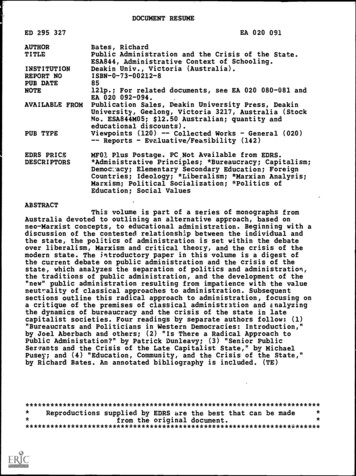
University of Delaware Study of Instructional Costs and ProductivityPercent of Undergraduate Classes Taught by Type of FacultyHospitality Administration5209CIP:Florida State University Percent of Undergraduate Classes Taught by Faculty 20%0%2000FUGGA%Florida State University Percent of Undergraduate Classes Taught by Faculty TypeYearTenure/Tenure EarningAdjunctOther Regular FacultyGrad. Assistants200063 %16 %21 %0%200161 %11 %28 %0%200244 %19 %38 %0%200373 %11 %16 %0%200467 %14 %19 %0%Research I Institutions Percent of Undergraduate Classes Taught by Faculty TypeYearTenure/Tenure EarningAdjunctOther Regular FacultyGrad. Assistants200066 %11 %18 %5%200153 %18 %22 %7%200246 %26 %23 %2%200347 %26 %22 %6%200454 %17 %21 %1%SUG Institutions Percent of Undergraduate Classes Taught by Faculty TypeYearTenure/Tenure EarningAdjunctOther Regular FacultyGrad. Assistants200056 %27 %14 %3%200151 %21 %21 %8%200245 %26 %24 %2%200338 %31 %24 %7%200456 %17 %22 %1%
University of Delaware Study of Instructional Costs and ProductivityPercent of Graduate Classes Taught by Type of FacultyHospitality Administration5209CIP:Florida State University Percent of Graduate Classes Taught by Faculty 0%2000FGGA%Florida State University Percent of Graduate Classes Taught by Faculty TypeYearTenure/Tenure Earning20002001AdjunctOther Regular Faculty0%Grad. 0%0%2004Research I Institutions Percent of Graduate Classes Taught by Faculty TypeYearTenure/Tenure EarningAdjunctOther Regular FacultyGrad. 00392%7%1%0%200481%13%6%0%SUG Institutions Percent of Graduate Classes Taught by Faculty TypeYearTenure/Tenure EarningAdjunctOther Regular FacultyGrad. Assistants2000100 %0%0%0%200186 %11 %3%0%200288 %0%0%0%200368 %11 %21 %0%200492 %0%8%0%
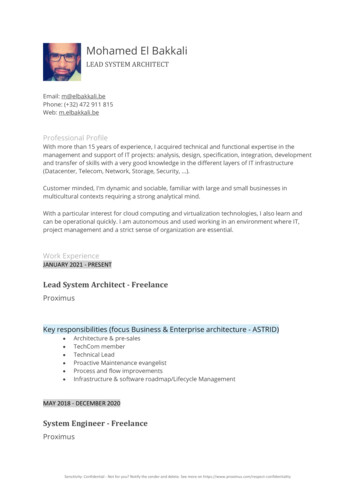
University of Delaware Study of Instructional Costs and ProductivityStudent Credit Hours Taught per Tenured FTE FacultyHospitality AdministrationCIP:5209Total Student Credit Hours per Tenured FTE Faculty450400350300250FSCHTRSCHTSSCHTFlorida State University Student Credit Hours per Tenured FTE 1217320022876293200339834012004352185352Research I Student Credit Hours per Tenured FTE 00126824292200227422296200328926313200427325266SUG Student Credit Hours per Tenured FTE 42003200220011502000200
University of Delaware Study of Instructional Costs and ProductivityOrganized Courses Taught per Tenured FTE FacultyHospitality AdministrationCIP:5209Total Organized Courses Taught per Tenured FTE Faculty2.902.702.502.30FOCTROCTSOCTFlorida State University Organized Courses per Tenured FTE 02.002.80Research I Organized Courses per Tenured FTE 020042.100.502.30SUG Organized Courses per Tenured FTE 0.702.5020042003200220011.9020002.10
University of Delaware Study of Instructional Costs and ProductivityFTE Students per Tenured FTE Instructional FacultyHospitality AdministrationCIP:5209FTE Students per Tenured FTE Instructional Faculty282624222018161412FTE Students per Tenured FTE Instructional FacultyYearFSUResearch 182120042003SFTE2002RFTE20012000FFTE10
Operating Budget E & G Position FTE and Rate TotalsBy Pay Plan, Month Type, Filled/Vacant and RankCollege of BusinessHospitality AdministrationTotal All Pay PlansFTEPerson YearsCurrent RateFilled 9- & 12-Month FacultyFTEPerson YearsCurrent RateFTEPerson YearsCurrent RateFTEPerson YearsCurrent RateFTEPerson YearsCurrent RateVacant & Reserve FacultySummer FacultyFilled SupportSource: Academic Profile 4.3 with OMNI account2005-200612.999.43 751,3532006-200713.109.44 801,5352005-20062006-20079.007.23 679,1628.006.48 636,6481.000.75 89,9382.100.21 20,7182.002.00 54,2311.990.20 19,9642.002.00 52,227
E & G Expenditures By Budget Category, By Major Object CodeCollege of BusinessHospitality AdministrationCategory CodeSALARYOject CodeFACULTYUSPSFRINGE BENEFITSOTHER SALARYSALARYEXPENSESub Total:OFFICE SUPPLIES2005-06 707,721 717,009 51,751 49,814 201,249 189,737 12,208 1,000 972,929 957,560 17PRINTING 7REPAIRS & MAINTENANCE 108TELEPHONE 118TRAVELEXPENSE2004-05 7,543 8,999Sub Total: 7,793 8,999Department Total: 980,722 966,559Source: Office of Institutional Research - Academic Profile 4.3 with OMNI account
COLLEGE OF BUSINESSHOSPITALITY ADMINISTRATIONE&G BUDGET & EXPENDITURES BY BUDGET CATEGORY (2002-03-2006-07)BEGINNING OF YEAR E&G OPERATING BUDGETSALARY & BENEFITSOPSEXPENSEOCOTOTALPERCENT INCREASEPERCENT OF UNIVERSITY E&G OPERATING BUDGEND OF YEAR EXPENDITURES & ENCUMBRANCESEDUCATION & GENERALSALARYOPSEXPENSEOCOTOTALSOURCE: OPERATING BUDGETS2002-032003-042004-052005-062006-07 2002-03879,4707,200886,670 2003-04927,9789,600937,578 2004-05958,5978,100966,697 2005-06955,2359,000964,2352006-07 1,017,536 8,000 %0.24%0.24%2002-032003-042004-052005-062006-07
COLLEGE OF BUSINESSHOSPITALITY ADMINISTRATIONC&G & OTHER FUND EXPENDITURES BY BUDGET CATEGORY 06CONTRACTS & GRANTSSALARYOPSEXPENSEOCOOTHERTOTAL 9,36734,26374944,379 52,55382,56314,084149,200 8730,4059,2222,16641,880 47,032148,07941,1899,194245,494 58,62837,43033,840129,898AUXILIARY ENTERPRISESSALARYOPSEXPENSEOCOTOTAL 5,7365,736 4,5954,595 34,66234,662 30,72330,723 31,10531,105CONCESSION FUNDSSALARYOPSEXPENSEOCOTOTAL - - - - -ALL FUNDSSALARYOPSEXPENSEOCOOTHERTOTAL 9,36734,2636,48550,115 8730,40543,8842,16676,542 SOURCE: OPERATING ,56318,679153,79547,032148,07971,9129,194276,217 58,62837,43064,945161,003
ALL SOURCESFaculty nt(%)Number ofNumber ofNumber of Number oforganized dents assignmenttaught(G,T,I,O,P,R, Instructional individual(%)(C,D,L)S,Z)contact hours studies (DIS) tionsand/orcreativeNumber of Number of Total grant Number ofproposals proposalsfundshonors andsubmittedfundedawardedawards
Faculty DIOOHLINRISCIGNOSUMMEANMEDIANofNumber oforganizedindividualizecoursesd otalTotal(C,D,L) ct .0464.0395.5Number ofNumber thesis/dissertatof honors ion studentcommitteescourses
Dedman School of Hospitality Admin College of Business Enrollment by Fall Semester Hospitality Administration