Transcription
Accountable CareOrganizationsJune 8, 2021This program is supported by the Health Resources and Services Administration (HRSA) of the U.S. Department of Health and Human Services (HHS) as part of an awardtotaling 510,424 with zero percentage financed with nongovernmental sources through a contract between the Missouri Hospital Association (MHA) and the MissouriDepartment of Health and Senior Services, Office of Rural Health and Primary Care (DHSS ORHPC). The contents are those of the authors and do not necessarily represent theofficial views of, nor an endorsement by, HRSA, HHS, the U.S. Government, MHA or DHSS ORHPC.Funding for this program was made possible by the Health Resources and Service Administration (HRSA) funding opportunity HRSA-19-024.Helping Hospitals Manage Operations Treat Patients Serve Communities
www.MHAnet.comHousekeeping Please review your name as displayed and change ifnecessary. Questions can be submitted via the chat window. Webinar being recorded; link will be available on the MHAwebsite. https://web.mhanet.com/grants-contracts/flex/2
Accountable Care OrganizationsMHA Flex Grant Program for MO Critical Access Hospitals: June 8, 2021
PRESENTEREric RogersPrincipalBKD National Health Care Grouperogers@bkd.com4
Agenda ACO historical perspective Current landscape and options for Critical Access Hospitals Should I participate? Benefits Risks Important considerations Tax ID, providers and PECOSBeing an ACO vs. participating in an ACOPatient attribution and entitlement codesHistorical spend and benchmark calculation from CMSHCC codingPhysician engagementIT considerationsMSR/MLR, adjustments, update factors and other “black box” items duringsettlement process Commercial ACOs, CINs quality bonus programs, etc. Case Studies5
Polling Question #1Is your hospital currently participating in a MedicareShared Savings ACO?A.B.C.D.YesNoWe are in the process of applying/joining currentlyNot sure6
Polling Question #2What aspects of an ACO would you like to learn moreabout?A.B.C.D.Participation requirementsFinancial implicationsPhysician engagement strategiesCare redesign strategies7
ACO Historical Perspective 2009 “The Cost Conundrum” 2010 Affordable Care Act Access vs. delivery model transformation CMMI funding ACO concept formalizesAll roads lead to risk 2011/2012 First ACO programs: MSSP, Pioneer,Advanced Payment, and Investment Model 2015 ESRD Model 2016 Next Gen ACO 2017 Vermont All Payer 2019 Pathways to Success (July 1, 2019 start)8
ACO Historical Perspective9
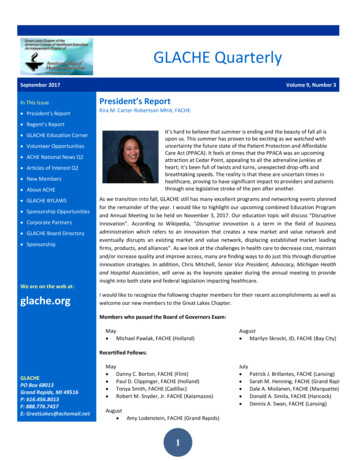
ACO Historical Perspective (2019 Results)Initial StRisk MoBnchmkMinExACO NameACO State art Date Track delN ABSav rateMinSavPerc pBJC HealthCare ACO, LLC MO, IL7/1/20123 Two-Sided37,5210.02310.0232 4,754,334Central US ACO, LLC1 One-Sided11,871-0.11870.0289 (9,309,528)KY, MO, AR, O 1/1/2014Health Choice Care, LLC FL, NC, RI, MO 1/1/20141 One-Sided15,3700.03090.0269 5,363,330SSM ACO, LLCMO, IL1/1/20143 Two-Sided19,5760.05030.02 12,155,454SLPA ACO, LLCMO, IL1/1/20151 One-Sided23,6450.05160.0246 12,180,561Mercy Health ACO, LLCMO, OK, AR 1/1/20151 One-Sided137,4140.03380.02 48,844,522USMM ACCOUNTABLE CARE TX, MI, OH, FL 1/1/20152 Two-Sided19,718-0.01310.0251 (3,259,084)Kentucky 2016 ACOKY, MO, IL1/1/20161 One-Sided6,1430.02890.0357 839,317Heartland Physicians ACO, IIA, MO1/1/20161 One-Sided4,269-0.11620.043 (2,496,990)Baxter Physician Partners AR, MO1/1/20161 One-Sided12,698-0.07130.0284 (4,302,234)Missouri 2017 ACOMO, KY, IL1/1/20171 One-Sided4,6450.02890.0409 1,556,859Prime Healthcare ACO II LLCMI, KS, MO 1/1/20171 One-Sided14,3610.03640.0274 5,833,197Central Oregon ACOOR, WA, AR, F 1/1/20181 One-Sided239,9240.02710.02 71,441,841St. Luke's ACO, LLCMO, IL1/1/20181 One-Sided14,9520.03610.027 5,627,954Keep Well ACO LLCMO, OK, IL, FL 1/1/20181 One-Sided9,257-0.04360.0307 (6,981,298)CHSPSC ACO 7, LLCAR, MO, LA, O 1/1/20181 One-Sided18,2460.0360.0257 6,934,037Centrus Health of Kansas Ci KS, MO1/1/20181 One-Sided28,951-0.00880.0241 (3,423,092)GenSaveLoss (9,309,528) 5,363,330 12,155,454 12,180,561 48,844,522 (2,496,990) (4,302,234) 5,833,197 71,441,841 5,627,954 (6,981,298) 6,934,037 -EarnSaveLoss 2,471,641 8,666,458 5,964,668 24,248,253 2,688,175 32,923,308 2,680,313 3,421,514 -Per Capita ExQualScor UpdatedBnchmkp TOTAL PYeHistBnchmk ABtotBnchmk ABtotExp93.1311,2109,881 206,103,009 ,68315,51292.1711,73310,468 173,438,947 168,075,61811,37095.0612,59711,576 241,685,560 229,530,10711,96397.9410,2509,642 236,194,839 224,014,2799,72299.2910,78110,144 1,444,040,538 1,395,196,01610,41692.1726,96726,517 249,618,891 310,64653,875,20452,318,34511,60792.1711,45210,232 160,433,533 154,600,33611,03692.1711,28210,481 2,632,883,830 2,561,441,98910,97695.2510,6969,790 156,098,037 150,470,08310,31194.4318,19016,143 160,099,523 167,080,82118,98398.6910,84010,133 192,405,491 185,471,45310,44992.1713,92613,089 390,322,835 393,745,92614,04810
Current Landscape and OptionsCMS Pathways to SuccessLevel ALevel BLevel CLevel DLevel EEnhancedQualityMIPS AMPMIPS AMPMIPS AMPMIPS AMPAdvanced APMAdvanced APMSharing RateUp to 40%Up to 40%Up to 50%Up to 50%Up to 50%Up to 75%MSR/MLR2%-3.9% MSRSame as AOptional 0% to 2%Same as CSame as CSame as CPerformancePayment Limit10% of totalbenchmarkSame as ASame as ASame as ASame as ASame as AShared Savings Rate40% of first dollaronce MSR isachievedSame as A50% of first dollaronce MSR isachievedSame as CSame as C75% of first dollaronce MSR isachievedShared Loss Raten/an/aFirst dollar at 30%not to exceed 2%rev capped at 1%benchmarkFirst dollar at 30%not to exceed 4%rev capped at 2%benchmarkFirst dollar at 30%not to exceed 8%rev capped at 4% of2019/2020 benchFirst dollar at 4075% not to exceed15% of benchmarkbased on quality11
Community Health Access and Rural Transformation (CHART) CMS is providing funding for rural communities to build systems of care through a CommunityTransformation Track and is enabling providers to participate in value-based payment modelswhere they are paid for quality and outcomes, instead of volume, through an Accountable CareOrganizations (ACO) Transformation Track. In the ACO Track, CMS will select up to 20 rural-focused ACOs to receive advanced payments. Amajority of ACO providers/suppliers of the CHART ACO must be located within rural counties orcensus tracts as defined by FORHP. CMS will offer CHART ACOs advanced shared savings payments comprised of two components: A CHART ACO will be able to receive a one-time upfront payment equal to a minimum of 200,000 plus 36per beneficiary to participate in the five-year agreement period in the Shared Savings Program. A CHART ACO will be able to receive a prospective per beneficiary per month (PBPM) payment equal to aminimum of 8 for up to 24 months. The amount for the upfront payment and the PBPM will vary based on the level of risk that theCHART ACO accepts in the Shared Savings Program and the number of rural beneficiariesassigned to it based on the Shared Savings Program assignment methodology, up to a maximumof 10,000 beneficiaries.12
Should I Participate?Benefits Exposure to VBC with gradualrisk/prepare for futurereimbursement model Access to data Decrease network leakage Improve quality Strengthen partnerships withother health care providers Opportunity to engage physicians Shared savingsRisks Staff and provider timecommitment Investment costs (EHR, carenavigators, data analysts, medicaldirector, etc.) Lost FFS revenue (swing bed,admissions, imaging) Shared losses13
Important Considerations Tax ID, providers and PECOSBeing an ACO vs. participating in an ACOPatient attribution and entitlement codesHistorical spend and benchmark calculation from CMSHCC codingPhysician engagementIT considerationsMSR/MLR, adjustments, update factors and other “black box” itemsduring settlement process Commercial ACOs, CINs quality bonus programs, etc.14
Case Study 1Total Savings/Losses Calculation[A] Assigned Beneficiaries[B] Person Years[C] Per Capita Expenditures by Enrollment Type ( )ESRDDisabledAged/dualAged/non-dual[D] Assigned Beneficiary ProportionsESRDDisabledAged/dualAged/non-dual[E] Per Capita Expenditures ( )[F] Per Capita Expenditures Benchmark ( )[G] Total Expenditures ( )[H] Total Benchmark Expenditures ( )[I] Total Benchmark Expenditures Minus Total Expenditures ( )[J] Total Savings ( )[K] Total Losses ( )[L] Minimum Savings Rate (%)[M] Minimum Loss Rate (%)[N] Minimum Savings Rate ( )[O] Minimum Loss Rate ( )[P] Savings or Losses RealizedSharing and Losses Rate Calculations[Q] Maximum Sharing Rate (%)[R] Quality Score (%)[S] Eligible to Share in Savings (Y/N)[T] Final Sharing Rate (%)[U] Final Loss Rate (%)Shared Savings Calculation[V] Shared Savings ( )[W] Shared Savings Cap ( )[X] Sequestration Adjustment ( )[Y] Earned Performance Payment ( )Shared Losses Calculation[EE] Shared Losses ( )[FF] Total Medicare Parts A and B FFS Revenue for ACO Participants ( )[GG] Shared Losses Cap ( )[HH] Shared Losses After Applying Cap ( )[II] Share of Beneficiaries in Counties Affected by an Extreme and Uncontrollable Circumstance (%)[JJ] Share of Year Affected by an Extreme and Uncontrollable Circumstance (%)[KK] Extreme and Uncontrollable Circumstance Adjustment ( )[LL] Payment Due to CMS ( 6500.1%30.0%00.0015
Case Study 1Number of ACOsTotal Assigned BeneficiariesTotal Expenditures by Assigned Beneficiary Medicare Enrollment Type[6]TotalEnd Stage Renal DiseaseDisabledAged/DualAged/Non-DualAssigned Beneficiaries with Non-Claims Based Payments[8]Person YearsTotal Non-Claims Based Payments per Assigned BeneficiaryComponent Expenditures per Assigned Beneficiary[9]Hospital Inpatient Facility, TotalShort-Term Stay HospitalLong-Term Stay HospitalRehabilitation Hospital or UnitPsychiatric Hospital or UnitSkilled Nursing Facility or UnitOutpatient FacilityHospital Outpatient Department (including CAH)Outpatient Dialysis FacilityPart B Physician/Supplier (Carrier)Evaluation and ManagementProceduresImagingLaboratory and Other TestsPart B DrugsAmbulanceHome Health AgencyDurable Medical EquipmentHospiceSubstance Abuse Treatment ServicesTransition of Care/Care Coordination Utilization[10]30-Day Post-Discharge Provider Visits Per 1,000 DischargesChronic Obstructive Pulmonary Disease or AsthmaCongestive Heart FailureAdditional Utilization Rates (Per 1,000 Person Years)[11]Hospital Discharges, TotalEmergency Department VisitsEmergency Department Visits that Lead to HospitalizationsComputed Tomography (CT) Events[12]Magnetic Resonance Imaging (MRI) Events[12]Primary Care ServicesNational Assignable National AssignableFFS 12-Month[3] FFS Year to ll MSSP 29,9752635771896011979,29916
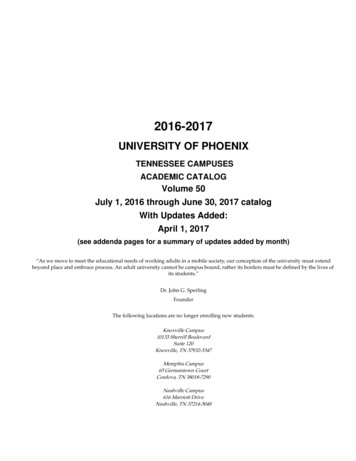
Case Study 12020 Base BenchmarkHCC ImpactRun Out rateLivesAdjusted LivesCalculated as of2ND QTR ACO Report asOCTOBER 2020 CCLF data of SEPTEMBER 30 , 2020Run 73454,816,911450,313,773Annualized spend406,927,703414,702,461Non-claims dataSubstance abuse treatmentTruncationNo data SharingRun OutTotal SR 1%10.0% (Savings) or 4.0% (Loss)Saving / Loss rateQuality ScoreShared savings/Loss CalcFinal Shared saving /lossSequestration Adjustment 00%17,805,65617,805,656356,113Net earned / repayment16,787,23117,449,5432020 RECONCILIATION withCCLF files YTD OCTOBER 2020Benchmark 17
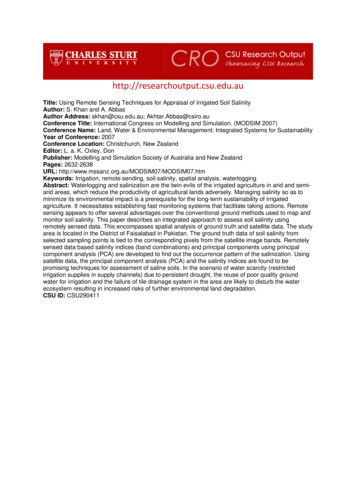
Case Study 2Total Savings/Losses Calculation[A] Assigned Beneficiaries[B] Person Years[C] Per Capita Expenditures by Enrollment Type ( )ESRDDisabledAged/dualAged/non-dual[D] Assigned Beneficiary ProportionsESRDDisabledAged/dualAged/non-dual[E] Per Capita Expenditures ( )[F] Per Capita Expenditures Benchmark ( )[G] Total Expenditures ( )[H] Total Benchmark Expenditures ( )[I] Total Benchmark Expenditures Minus Total Expenditures ( )[J] Total Savings ( )[K] Total Losses ( )[L] Minimum Savings Rate (%)[M] Minimum Loss Rate (%)[N] Minimum Savings Rate ( )[O] Minimum Loss Rate ( )[P] Savings or Losses RealizedSharing and Losses Rate Calculations[Q] Maximum Sharing Rate (%)[R] Quality Score (%)[S] Eligible to Share in Savings (Y/N)[T] Final Sharing Rate (%)[U] Final Loss Rate (%)Shared Savings Calculation[V] Shared Savings ( )[W] Shared Savings Cap ( )[Y] Earned Performance Payment ( )[DD] Net Earned Performance Payment ( )Performance 18
Polling Question #3In your opinion, how likely are ACOs and similarvalue-based care delivery/reimbursement models togrow and replace traditional FFS business models?A. Very likelyB. Likely, but will be gradualC. Unlikely19
THANK YOU!erogers@bkd.comThe information contained in these slides is presented by professionals for your informationonly & is not to be considered as legal advice. Applying specific information to your situationrequires careful consideration of facts & circumstances. Consult your BKD advisor or legalcounsel before acting on any matters covered20
www.MHAnet.comThank you for joining us today.Please assist us by completing the evaluation that follows.In addition, please share via email to kpurdy@mhanet.comthe following information or enter it into the chat window: What is one activity you are considering implementing basedon today’s presentation? Comments not addressed in the evaluation Suggested topics for future training21
This program is supported by the Health Resources and Services Administration (HRSA) of the U.S. Department of Health and Human Services (HHS) as part of an award totaling 510,424 with zero percentage financed with nongovernmental sources through a contract between the Missouri HospitalAssociation (MHA) and the Missouri