Transcription
Family Offices:Global Landscape andKey TrendsFinal report22/04/2020
Scope andobjectivesProvide a macro overview of FamilyOffices and global trends within theindustryOffer key learnings from selected bestin class family offices1
AgendaAOverview of the family offices landscapeBGlobal Trends for Single Family OfficesCKey Learnings from selected SFOs2
AgendaAOverview of the family offices landscapeGlobal Trends for Single Family OfficesKey Learnings from selected SFOs3
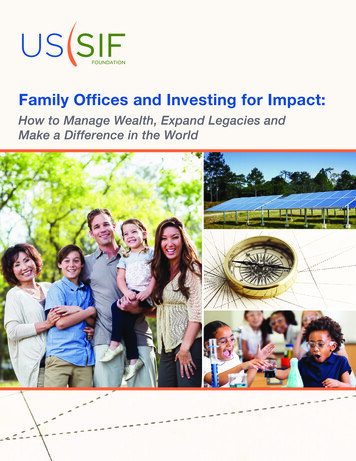
Scope: We focus on single family offices, which represent 80% of total familyofficesShare of Single Family Offices in the family office space9%11%Four key areas to be covered in thischapter1 General overview of global wealth2 Background and history of familyoffices80%3 Dominant investment strategies4 Overview of enablers (governance andoperations)Single family officesCommercial multi family officesPrivate multi family officesNote: Based on 360 family offices participating in The UBS / Campden Wealth Global Family Office Survey 2019Source: The Global Family Office Report, 2019, UBS and Campden Research4
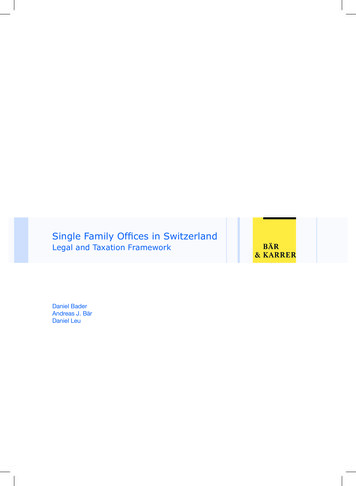
1General overview of global wealthAs of 2018, global wealth stood at around 206 trillion, with almost half of it inNorth AmericaWealth distribution across geographies, 2018, in trillions90 206trillion4437165North WesternAmerica EuropeAsiaJapan443Latin Oceania Middle ce: The Global Family Office Report, 2019, UBS and Campden Research
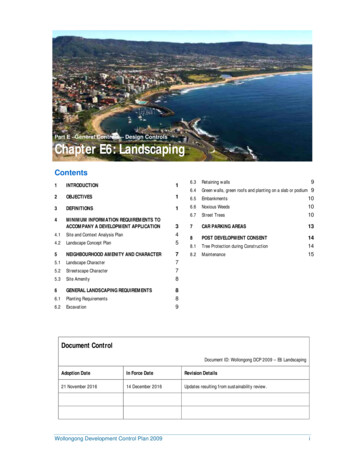
2Background and historyMost family offices were formed in the last 20 years, representing first orsecond generation Decade the family office was formed, %Generations served by the family office, %61%53%48%33%25%6%Unknown1%Pre th5%4%6th7th Unknown1%6Source: The Global Family Office Report, 2019, UBS and Campden Research
2Background and history with over half of their wealth generated by finance & insurance,manufacturing, and real estatePrimary industry of the operating business of family offices, %Finance and InsuranceManufacturingReal Estate and Rental/ LeasingManagement of Companies and EnterprisesTechnologyDiversified / MultipleRetail TradeAgriculture, Forestry, and Aqua-cultureMedia and PublishingHospitality and Food ServicesEnergy and ResourcesTransportation and WarehousingConsultancyHealthcare and Social AssistanceConstructionArts, Entertainment, and RecreationInformation and CommunicationUtilitiesWholesale %3%7Source: The Global Family Office Report, 2019, UBS and Campden Research
2Background and historyOverview: Ranking size by AUM reveals domination by North American officesTop FOs ineach regionTop 10 FOs worldwideTop family offices by AUMRankNameOwner (family/person)Total AUMHQ Location1.Walton Enterprises LLCThe Walton Family 167,000,000,000North America2.Bezos ExpeditionsJeff Bezos 107,800,000,000North America3.Cascade InvestmentBill Gates 51,000,000,000North America4.MSD CapitalMichael Dell 31,000,000,000North America5.Bayshore Global ManagementSergey Brin and Anne Wojcicki 30,100,000,000North America6.Emerson CollectiveLaurene Powell 26,000,000,000North America7.Euclidean CapitalJim Simons 21,600,000,000North America8.Vulcan IncPaul Allen and Jody Allen 16,000,000,000North America9.KIRKBI A/SKirk Kristiansen family 12,140,300,000Europe10.Point72 Asset ManagementSteve Cohen 11,000,000,000North America13.Sunrise Capital ManagementShu Ping 7,700,000,000Asia17.Portland House GroupDavid Hains 2,300,000,000Australia and Pacific21.Ahmed Salem Bugshan GroupAhmed Salem Bugshan 1,800,000,000Middle East8Source: Sovereign Wealth Fund Institute
3Dominant investment strategiesGlobally, more than half of FOs follow a balanced strategy to investment56% of FOs follow a balancedstrategy to investmentDistribution of FOs based on investmentstrategy followedA percentage that seems consistentacross different FO sizesHowever, FOs in emerging marketsprefer balance over growthDistribution of FOs based on investment strategyfollowed and AUMDistribution of emerging markets FOs based oninvestment strategy followed67%57% 56% 54%56%25%19%25% 26% 27%19% 18% ervationGrowthBalancedPreservation 250M and less19% 1B Between 251M - 1B9Source: The Global Family Office Report, 2019, UBS and Campden Research
3Dominant investment strategiesFamily offices invest primarily in equities, private equity, and real estateWhen it comes to private equity, family officesinvestments are present across all key typesCurrent approximate strategic asset allocationPercentage of family offices involved in investing in the private equityinvestment typeCommodoties REITSHedge Funds3%5%1%Cash or xed income 16%55%Private debt49%Real assets49%Special situation17%Real estate19%Other41%5%Private equity10Source: The Global Family Office Report, 2019, UBS and Campden Research
3Dominant investment strategiesFurthermore, majority of PE investments are through either PE funds or directinvestments with an active management role1More than 60% of PE portfolio are through PE funds ordirect investments with an active management roleDirect investments with an active management role hadthe highest annual returnsBreakdown of PE portfolio, in %Annual returns across PE portfolio, in M16%14%13%33%12%9%22%32%PE fundsDirect with an active mgt. rolePE fund of fundsDirect with a passive shareholder roleDirect with anactive mgt. roleDirect witha passiveshareholderrole1. FOs investing directly in companies and being an active shareholder (e.g. board representation, etc.)Source: The Global Family Office Report, 2019, UBS and Campden ResearchPE fundsPE fundof funds11
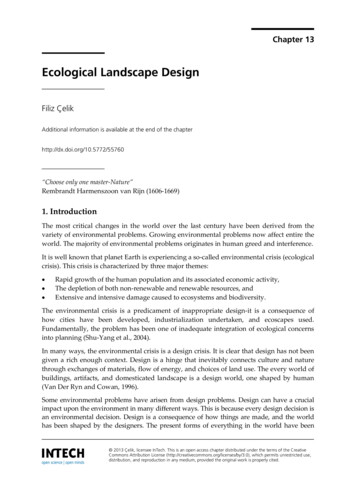
3Dominant investment strategiesFinally, direct investments were mainly in technology, real estate andrental/leasing, and finance & insuranceTop 10 industries of direct investmentPercent of FOs directly investing in this sectorTechnology49%Real Estate and Rental/ Leasing42%Finance and Insurance30%Healthcare and Social Assistance27%Manufacturing24%Hospitality and Food Services21%Agriculture, Forestry, and Aqua-culture18%Consumer products and retail18%ConstructionInformation and communications17%11%12Source: The Global Family Office Report, 2019, UBS and Campden Research
4Overview of enablersAs for governance, family offices implement several structures, and they havea few key governance prioritiesShare of family offices implementing the governancestructure, %Definition for strategicasset allocationControl plan formonitoring investments74%64%62%67%Investment process guidelines62%Mission statement54%Analysis and monitoring ofmarket research reports54%Formally written succession plan39%35%35%20%34%Operational manual for decisionportfolio constructionOtherShare of family offices that regard the topic a priority, %30%2%Risk mgt. Investment Humanguidelines capitaloversightControlpoliciesBoard re- Inclusiondesignof nonfamilymembers13Source: The Global Family Office Report, 2019, UBS and Campden Research
4Overview of enablersWhen it comes to operations, investment related activities seem to constitutethe largest portion of FO’s operating costsInvestment related activities constitute 38% of FO’soperating costsIn terms of absolute values, an SFO spent 2.2M in 2019on investment related activities on averageProportion of operating cost, in %Operating cost for the average SFO, in 7%Investment relatedactivitiesFamily professionalservicesGeneral advisory servicesAdmin. ServicesAdmin. ervices14Source: The Global Family Office Report, 2019, UBS and Campden Research
AgendaOverview of the family offices landscapeBGlobal Trends for Single Family OfficesKey Learnings from selected SFOs15
9 major trends are shaping the SFO landscapeDescription1 Decline of the global wealth of HNWIs amid market turbulencesGeneraltrends2Increasing popularity of the FO model and of the share of wealth managed by familyoffices3 Fast-growing private capital market, with dry-powder reaching an all-time high4 Major increase in allocation to real estate as families move away from hedge fundsInvestmenttrends5 Family offices are leaning towards active investment strategy in Private Equity6 Growing interest in sustainability and impact investing7 Digitalization and transition to AI-enabled toolsEnablertrends8 Increasing focus on attracting, training and retaining talent9 Cybersecurity becoming a key concern for FOsSource: Team analysis16
1Decline of the global wealth ofHNWIs amid market turbulencesGlobal wealth of HNWI1 declined for the first time in 2018 after in 7 years ofsteady growth, and is expected to further dip due to the covid-19 crisisHNWI1 financial wealth by region, trillions2020 total stock market decline, YTD, as of 22 April 2020-2.9%70.242.11.77.110.111.468.21.71.6 8.9%63.42.5 2.61.58.758.758.08.42.41.41.42.3 8.052.62.31.37.415.92.1 7.746.215.41.37.714.7 x% CAGR1.81.113.613.07.5Africa12.4Middle East19.819.610.918.0Latin America16.616.214.9Europe12.7North 6201420152016201720181. Individuals with financial wealth above 1 MSource: Capgemini World Wealth Report 2019Asia-Pacific-16.0%S&P500-17.6%Nikkei 225FTSE100HSI-25.8%-17.2%Key insights SFOs likely to face additional pressure on returns Risk aversion of HNWI may increase, forcing reallocationof capital to safer asset classes For families willing to bear the risk of heightenedvolatility, there is a unique opportunity to buy backassets under distress at deep discounts17
2Increasing popularity of the FO modeland of the share of wealth managedby family officesHowever, the proportion of family wealth under management by family officesand the popularity of family offices are increasing, driving up total AUMProportion of family wealth undermanagement by family office, MFO SFO, %73%Number of Single Family Offices76% 1620172018201920173,100Emerging marketsAsia-PacificEuropeNorth America 5.9trillionEstimated totalAUM (USD, 2019)2019Key insights Family offices are growing faster than global wealth, and are increasingly common in all regions However, they have yet to fully take off in Asia-Pacific and emerging markets, where most UHNWIs are still first-generationwealth holders, still very involved in the operating businessSource: The Global Family Office Report - UBS & Campden Research (2016-2019); Campden Research18
Fast-growing private capital market, withdry-powder reaching an all-time high3The broader private capital market is at an all-time high, representing anincreasingly large share of global investmentsGlobal assets under management in Private Capital markets, billionsDry PowderUnrealized value x.x%AUM breakdown, %, June 2019CAGR7,443 12.1% 6,7765,868 8.1% 18.5%2,524 2,5802,8211,2403,1461,1533,4541,1594,282 4,4323,7721,1221,397 1,3894,7181,51561%12%Real EstateInfrastructure9%2,652Private Debt15%Natural Resources2,4005,0802,056Key insights1,6894,3761,8921,143 1,2333,8113,3911,3752,886 3,043 3,2039151,0652,650770 810 837 9506471,993 2,2954741,5821,381 1,347332 417 458 460978728592438 392 379 4904,7912000 2001 2002 2003 2004 2005 2006 2007 2008 2009 2010 2011 2012 2013 2014 2015 2016 2017 2018 2019Note: As of December for all years, as of June for 2019Source: PreqinPrivate Equity3%Private capital funds are risingin parallel to family offices,who will have to choosebetween competing with themfor investment opportunities orpartnering with them aspassive investors.19
4Major increase in allocation to realestate as families move away from hedgefundsPrivate Equity and Real Estate emerge as popular asset classes as family officesmove away from hedge funds (1/2)Allocation of assets to major 2%20%18%Family offices’ investment in private equity by %20%93%81%73%19%27%35%0%0%20152016PE2017Real Estate20182019Hedge FundsProportion of familyoffices that invest inPEProportion of familyTypes of PE fundoffices that invest ininvestments familyPE fundsoffices are involved inKey insights Allocations to hedge funds have been declining over the past five years as family offices expect a recession towards end2020; some family offices also perceive the fees to be relatively high compared to performance delivered Private Equity is a popular asset class with 81% of family offices currently allocating 19% of their portfolio to it; over 40%of family offices plan to increase their allocation towards Private Equity in 2020Source: The Global Family Office Report - UBS & Campden Research (2016-2019)20
Major increase in allocation to realestate as families move away from hedgefunds4Private Equity and Real Estate emerge as popular asset classes as family officesmove away from hedge funds (2/2)Real estate allocationsReal Estate Annual %10%Local15%Regional20%25%30%InternationalKey insights Over 70% of family offices invest in real estate citing location, cost and opportunity to invest directly as key motivations Family offices lean more towards commercial real estate (55% of average real estate portfolio is commercial) and prefer toinvest closer to home as they can leverage their social networks to get better dealsSource: The Global Family Office Report - UBS & Campden Research (2016-2019)21
5Family offices are leaning towards activeinvestment strategy in Private EquityFamilies are keen to invest directly in Private Equity and participate in coinvestments but face several challenges in finding the right dealsBreakdown of PE investments by typeChallenges related to co-investing deals80%64%60%34%PE Funds,46%69%42%40%Direct PE,54%30%31%31%20%20%9%Key insightsLack of qualifiedinvestment advisorsDeal flowWillingness ofcompanies to providegovernance rightsCo-investmentsMinimum investmentsizeMinorityLack of resources,skills etc.MajorityDifficulty findingattractive deals37%Deal Due Diligence0% Family offices are interested to increase allocation to direct private equity (versus PE funds) as they offer greater operationalcontrol and can reduce management fees; however, families have found it difficult to deploy larger sums through direct deals Co-investments are a key enabler as family offices get more sophisticated and move from PE funds to direct PE; access to qualifiedopportunities through trusted networks and opportunity to collaborate with like-minded investors are key motivationsSource: The Global Family Office Report - UBS & Campden Research (2016-2019)22
6Growing interest in sustainability andimpact investingFOs are increasingly embracing sustainability and impact investing as theyrealize that high returns can materializeMost common areas of impact investmentsSustainable investment approaches used0%10%20%30%40%50%Thematic Investing (eg. clean energy,gender equality etc.)60%70%62%Integration of ESG factors0%10%20%30%40%Education45%Agriculture & Food45%46%Energy & resource efficiencyNegative/exclusion based (eg. Notobacco, alcohol etc.)Positive/best in class selectionActive engagement (using shareholderrights to influence company managementto improve the management of ESG issues50%36%31%26%43%Heathcare & wellness38%Environmental conservation34%Housing & communitydevelopment34%Sustainable consumer products29%Key insights 1 in 3 family offices engage in sustainable investing currently; climate change and health are the top two causes with 62% and51% of family offices that currently invest in sustainability supporting these themes 25% of family offices engage in impact investing with an average allocation of 14% of overall portfolio; in 5 years 30% of familyoffices expect to allocate 25% or more to impact themesSource: The Global Family Office Report - UBS & Campden Research (2016-2019); survey of 360 family offices in 201923
7Digitalization and transition to AIenabled toolsFOs recognize the potential for digitization to streamline processes in both frontand back officesAreas in the front and back offices that FOs felt would be most amenable to digital transformation, % of respondents80%69%70%60%50%49%40%40%40%Due diligenceResearch and securityselection43%40%30%20%10%0%Portfolio riskmanagmentFront officeFund acountingTrade and settelmentValuation of liquidassetsBack officeKey insights Digital capabilities, such as machine learning, can also be used to make the on-boarding process for new acquisitions much faster,more accurate and efficient A non-digitized processes can drain money and resources that would be better utilised growing the business, working on deals, orhelping portfolio companies improve their operations or increase salesSource: Research survey – KPMG/CREATE, 201824
8Increasing focus on attracting, trainingand retaining talentNon-monetary incentives are becoming widely used to retain talent, however,above average pay is still keyC-level salaries are stable, but with an increased reliance onbonuses, typically around 30-50% of base payThe importance of all types of incentives have increased201720142011367 333335309Benefits - Healthcare and Basesalary, 000sUSDJob stabilityAttractive workenvironmentCash bonus basedon specific goals29Above marketcash salary01234Scale of importance (1-5) according to respondents4842 45Bonus, %of base2016314 3122672662017215 20021319820182019213 2112082065045 47372430303231 291314COOCFO5CEOCIOKey insights The most prevalent monetary incentive is above market salary and cash bonus based on meeting quantitative and qualitative goals.However, most FOs use exclusively discretionary bonuses (55%), as opposed to exclusively formulaic bonuses (9%) Non-monetary incentives such as work environment and benefits, have increased over time and are used at similar rates to retainprofessionalsSource: Family office benchmarking report – Wharton and Northern Trust, 2018; The Global Family Office Report - UBS & Campden Research (2016-2019)25
9Cybersecurity becoming a key concernfor FOsCybersecurity is becoming a key concern to FOs, with over 20% of them havingexperienced a cyber-attack 20% of family offices knowinglyexperienced a cyberattack % of FOs who experienced a cyber-attackDon’t know8% primarily in the formof phishing % of FOs who experienced a giventype of cyber-attack76%Yes20%33%33%20%Source: The Global Family Office Report, 2019, UBS and Campden ResearchRansomwareSocial engineeringMalwareNoPhishing72%.leading majority of FOs to adopt a combinationof strong measuresPrecautions taken to protect against cyber attacks, % of adoptionamong FOsExpert support / external advisory78%Back-up and disaster recovery76%User education and awareness69%Monitoring69%Incident management47Managing user privileges36Control of home and mobile working33Additional internal staff / capability2226
SFOs should focus on trends with the highest expected impact on returns andlikelihood of persistenceImpact on ReturnsHighDecline of the1 global wealth ofHNWIsIncrease of theallocation to real4 estate, away fromIncreasing focusDigitalization andhedge funds8 on attracting,7 transition to AItraining andenabled tools9retaining talentGrowth of theIncreaseinactivenumber of FOs,5investment in PE 2 managing anincreasing share of 6Fast-growing the family wealth3 private capitalmarketMediumIncrease ofcybersecuritythreatsGrowinginterest forsustainabilityand impactinvestingLowLowSource: Team analysisMediumLikelihood of persistenceHigh27
AgendaOverview of the family offices landscapeGlobal Trends for Single Family OfficesCKey Learnings from selected SFOs28
We interviewed 9 single family offices and results were divided into five nvestmentsGovernanceNote: Findings were consistent among all interviewees except for very large firms with 1 st generation founder still involved in operating business29
SFO operations depend greatly on the family mandate, with some common traitsGeneralOfficeHumanCapital All SFOs have 2-3 offices Locations are dependent on access to markets, tax benefits and/or family history Preferences of Singapore in Asia, Luxemburg and London in Europe Senior professionals positions are always filled by reference, handpicking or headhunting. Junior staff hiringpractices also include job listings Trust, reputation and fit with office/family cited as main reasonsStaff retention driven primarily by non-financial incentives in smaller firms(as judged by AUM), very largeoffices tend towards PE industry standard compensation. Juniors turnover high due to less deal executions.Staff time commitments primarily for Deal evaluation, Portfolio Monitoring and any other Immediaterequirement by the family or investmentsAll SFOs expend minimal time/effort in deal sourcing. Reputation and relevant industry expertise of theparent company/office tends to generate organic deal flowAll SFO CEOs travel very frequently, between every 4 days to twice a month (Current lockdowns are thelongest without travel for all interviewees in recent memory)All SFOs have either standard (occasionally adjusted) term sheets, or standard protection requirements whenmaking investmentsPortfolio monitoring usually involves finance and accounting metrics which are reviewed periodically. 2 SFOsinterviewed have software specific for monitoring portfolios, one of which developed their software internallyAbout 60% of SFOs are in communication with other SFOs. Collaboration can include deal forwarding and(rarely) co investing, but always based on trust levelsMajority(90%) have attended conferences(mainly related to portfolio business’ industries). Strong consensusbetween interviewees that FO conferences are disliked, primarily due to being targeted for sales. Bestconferences are judged to be those which allow FOs to meet in smaller groups(around 20) and communicatefreely MILKEN noted as the best conference by multiple interviewees30 Operations
SFOs invest opportunistically but focus on the long term Investments Governance Majority( 80%) decide on investments on an opportunistic basis. Management and monitoring of investmentsare handled out of the closest regional office. “When there's a knock on the door, we answer it”All firms are reluctant to pursue deals presented through traditional investor channels. These are perceived tobe lower quality as they have intermediaries attached that are extracting significant valueDisclosure of principal behind firms usually results in higher premium for purchase prices of investments iffirm name is not well known. Firms with strict privacy concerns will avoid deals that have disclosure rules.In most cases( 75%), exits are not a pain point. Many purchases are done without exit plans, i.e. - potentialintegration into operating business, or holding for long term( 15 years)Majority( 65%) of SFOs provide family services. Most common are accounting and tax management, followedby succession planningMajority( 75%) of SFOs declare Family member involvement in day-to-day operations. All have mandatedInvestment Committees with at least one non-family member. Family member tends to have prominent role ininvestment decisions ranging from deal selection authority to veto rights at final approvalSFOs tend to have separate Family Committees to discuss family related mattersPerceived Trends by SFOs Interviewed Asian SFOs are diversifying and professionalising, and will soon catch up with the standards of the US and Europe whichhave mature FOs on- “You would not send an unskilled person to compete in the Olympics, and Finance is the same” Families will move away from private banks, and will move to more trusted SFO or MFO operations to retain more control Families will invest more in their core businesses, while restricting risky allocations to smaller investment sizes Privacy is reducing Globally as the information age unfolds, and families will find it more difficult to stay under the radar31
THANK YOU32
Your teamAbdullah Al OtaibiJonathan ZimmermanSharon Fernandes 7 years of experience workingin financial services and assetmanagement Head of coverage on industrial,healthcare and pharma sectors Assistant portfolio manager fora US 300M SMA 3 years in McKinsey & Company Relevant projects include preacquisition Due Diligence of alarge pharmaceutical company,and merger and demergerstrategies Chartered Accountant with 6years of experience acrossEquity Research, Private Equityand Venture Capital Part of the Venture Capitalinvesting team at IFCSingaporeShiraz AkbarallyElyse (Yukun) ZhaoAbdelrahman Desouky 7 Years experience in FMCG &Family Businesses; Operationsand Management Directorships in the Agro,Pharma, and RenewablesSectors Worked with government indeveloping long term strategyfor the Tea Industry 8 years in consulting, 6 yearsas project leader; healthcarefocused, but with caseexperience across variousindustries Pre-MBA investment intern in aShanghai-based fund 3 years in BCG Middle East Relevant projects includeestablishment of a governmentreal-estate developmentauthority and the design of PPPmodel for a 8B statesponsored cultural and tourismdevelopment project33
Source: Sovereign Wealth Fund Institute Top family offices by AUM Rank Name Owner (family/person) Total AUM HQ Location 1. Walton Enterprises LLC The Walton Family 167,000,000,000 North America 2. Bezos Expeditions Jeff Bezos 107,800,000,000 North America 3. Cascade Investment Bill Gates 51,000,000,000 North America 4.