Transcription
Developing a framework on supply chain risk mapping,prioritization and engagementKiana DehkhodaA Thesis inThe Department ofMechanical and Industrial EngineeringPresented in Partial Fulfillment of the Requirements forThe Degree of Master of Applied Science (Industrial Engineering) atConcordia UniversityMontreal, Quebec, CanadaApril 2016 Kiana Dehkhoda, 2016
CONCORDIA UNIVERSITYSchool of Graduate StudiesThis is to certify that the thesis preparedBy:Kiana Dehkhoda.Entitled:Developing a framework on supply chain risk mapping,prioritization and engagementand submitted in partial fulfillment of the requirements for the degree ofMaster of Sciencecomplies with the regulations of the University and meets the accepted standards with respect tooriginality and quality.Signed by the final examining committee:Dr. Chun-Yi SuChairDr. Gerard GouwExaminerDr. Satyaveer ChauhanExaminerDr. Nadia Bhuiyan, Dr. Ahmet SatirSupervisorApproved byChair of Department or Graduate Program DirectorDean of FacultyDate04/22/2016ii
ABSTRACTDeveloping a framework on supply chain risk mapping, prioritization and engagementKiana DehkhodaSupply chain risk and uncertainty have been drawing much attention in the past few decades. Inthis thesis, a holistic risk management framework is developed to cope with such risks anduncertainty. The framework assists decision-makers first by detecting internal and/or external risksat early stages. In order to visualize the probability of risks and their impacts, risk-mappingtechniques are then proposed. Risk assessment is used to determine risk occurrence and the effectsin either quantitative or qualitative terms. Once risks are analyzed, risks relations should beinvestigated to further adopt risk management strategies for high importance items. Finally,ongoing control of existing and emerging risks requires an appropriate management strategy inorder to increase supply chain efficiency. The framework is validated through an application in asmall manufacturing company that struggles with outsourcing risk arising from both lead time anddemand uncertainties. We first detect uncertainties, then design a simulation model to illustratethe impact of these uncertainties on the company’s performance, where we use the number of lostcustomers as the company’s performance indicator. Moreover, we conduct an experimental designto investigate risk relation and their impact on the number of lost customers. The experimentaldesign also allows for comparing various supplier’s performance and indicates which supplierwould be most beneficial to work with.Keywords: supply chain risk management, framework, case studyiii
AcknowledgementI would like to greatly thank Dr. Bhuiyan, my supervisor, for her advice and guidance through mygraduate study.I would like to express my gratitude to Dr. Ahmet Satir as my co-supervisor for his constantguidance, support and inspiration. He kindly and diligently supported me and answered thequestions I faced regarding my hypotheses, writing and the project in general.Finally, I would like to thank my family for their unconditional love and endless support in everystep of my master’s study. My parents encouraged me to be persistent and determined to achievemy goal.iv
Table of ContentsList of Tables . vList of Figures . viList of Equations . vii1Introduction . 11.12Thesis organization . 1Literature review . 32.1Risk definition . 32.2Risk classification . 42.3Risk mapping . 82.3.1Risk heat map and risk matrix . 92.3.2Risk value map . 102.3.3Risk Breakdown Structure (RBS) . 112.4Risk assessment . 122.5Risk interactions . 132.6Risk prioritization . 152.6.12.73Severity analysis techniques . 15Supply chain risk management. 162.7.1Risk management framework . 172.7.2Risk management approaches . 182.7.2.1Avoidance approaches. 182.7.2.2Preventative approach . 182.7.2.3Mitigation approach . 19Methodology . 213.1Introduction . 213.1.1Risk identification . 233.1.2Risk mapping . 253.1.3Risk assessment. 263.1.4Risk interaction assessment . 313.1.5Risk prioritization . 313.1.6Risk management strategies . 323.1.7Risk control . 34
4 An application of the risk management framework developed: A case study in a mattressmanufacturer . 364.1Methods and techniques used in the experiment . 364.1.2Problem description . 404.1.2.1Simulation model description . 404.1.2.2Supplier comparison . 464.1.2.2.14.2Findings . 47Experimental design. 474.2.3Findings . 505Conclusions . 556References . 577Appendix A . 758Appendix B . 779Appendix C . 80
List of TablesTable 2-1 Risk categorization and definition . 6Table 3-1 Risk identification tools and technique . 23Table 3-2 Risk mapping tools . 25Table 3-3 Quantitative and hybrid risk measurement . 26Table 3-4 Qualitative risk assessment tools . 30Table 3-5 Risk interaction assessment tools . 31Table 3-6 Risk prioritization tools . 32Table 3-7 Avoidance approaches . 33Table 3-8 Preventive approaches . 33Table 3-9 Mitigation approach. 34Table 4-1 A comparison with two suppliers with different ordering costs and its impact onresponse values . 46Table 4-2 Experimental design factors with three levels . 48Table 4-3 Response values for each set of input values . 49v
List of FiguresFigure 2-1 Risk mapping structure based on likelihood vs severity (Scandizzo, 2005) . 9Figure 2-2 Risk heat map (Dominguez-Chicas & Scrimshaw, 2010) . 10Figure 2-3 Original risk matrix (Markowski & Mannan, 2008) . 10Figure 2-4 Risk value map -map-yourrisks/). 11Figure 2-5 Demonstration of ABS, RBS, and RBM (Cagliano et al., 2012) . 12Figure 2-6 Risks interaction map (by Deloitte & Touche LLP) . 14Figure 2-7 Bow-Tie Diagram by Deloitte & Touche LLP . 15Figure 3-1Risk management framework . 22Figure 4-1 Current material flow process . 38Figure 4-2 Current process map . 39Figure 4-3 Simulation model logic . 42Figure 4-4 Design of experiments with three factors and three levels . 51Figure 4-5 Residual plots for lost sales versus mean lead time, lead time variance and demandvariance . 52Figure 4-6 Lost sales at given lead time variance levels for various levels of lead time demand 53Figure 4-7 Lost sales at given demand variance levels for various lead time variance levels . 54Figure 4-8 Lost sales at given demand variance levels for various mean lead time levels . 54Figure 7-1 The supply chain of mattress manufacturing from upstream level to downstream level. 76Figure 8-1 A comparison with two suppliers with different ordering costs and its impact onresponse values . 81vi
List of EquationsEquation 2-1 . 12Equation 4-1 . 40vii
1IntroductionIn today’s marketplace, demand variations require manufacturers to provide products with shortlifecycles at high speeds, which results in adding risk and complexity to supply chains. Supplychains must react quickly and use risk management strategies to diminish impacts significantly.Many examples exist of supply chains that could not adequately respond to risks. Ericsson, forexample, lost millions of dollars due to a fire accident that occurred at a sub-supplier (Norrman &Jansson, 2004), while Apple failed to satisfy customers’ demands as a result of an earthquake thattook place at its supplier in Taiwan (C. S. Tang, 2006). Many researchers have highlighted theneed for proactive and reactive risk management strategies to deal with current and emerging risks(Ponomarov & Holcomb, 2009; Ghadge, Dani, Chester, & Kalawsky, 2013; Ghadge et al., 2012).This study contributes to the existing literature about supply chain risk management in severalways. We expand on previous studies by defining a generic comprehensive framework toinvestigate and map the risk, evaluate risk magnitude and risk interactions, prioritize risks, employproper risk management strategies and control risk continuously. Additionally, we elaborate moreabout the framework functionality in an industry specific case study. The implication of theframework on the experiment sheds light on outsourcing risk investigation, evaluating risk by asimulation model, analyzing risk factor interactions by conducting an experimental design andproposing risk management strategies to diminish risk magnitude significantly as well as allowingan ongoing control on existing and new risks.1.1Thesis organizationIn chapter 2, we review the literature on risk definition and broaden our understanding byinvestigating risk management in-depth. We detect gaps in the literature; some studiesunderestimated risks interactions impact. Therefore, we propose risk interaction approaches toexamine any relations among risks before implementing any management strategies, which arehighly reliant upon risk relations. We also propose required tools and techniques to completelyscrutinize risks. Moreover, the defined risk management framework is not limited to a specificindustry as some studies’ findings are constrained to industry specific examples.In chapter 3, we propose a supply chain management framework based on previous studies andextend it in different ways. Former studies reveal a lack in illustrating risk magnitude, risk relations1
and risk prioritization and associated tools and techniques. We thoroughly explain all stages tostudy risk from the beginning and it is an iterative and ongoing loop investigating existing and newrisks.In chapter 4, we employ the defined framework on an industry specific example and use varioustools and techniques to identify risks and verify the framework implementation. In line with therisk management framework, process mapping, inventory management model, simulation model,experimental design, risk avoidance and risk mitigation strategies are used.In the final chapter, we summarize our findings and compare them with previous studies. Wefurther address the limitations of our study and conclude with the potential for future studies.2
2Literature reviewSupply chain risk has been an emerging issue in which several studies concentrating on riskreduction by implementing various risk management strategies (Jüttner, Peck, & Christopher,2003;Jüttner, 2005; Manuj & Mentzer, 2008; C. S. Tang, 2006;O. Khan & Burnes, 2007). To thisend, we study risks associated with supply chain and develop a framework to cope with anydisruptions by implementing proper risk management strategies. In this chapter, we present anexhaustive discussion of risk definition, risk classification, risk mapping, risk assessment, riskinteractions, risk prioritization and risk management.2.1Risk definitionRisk has been a controversial topic for a long time, where researchers in different disciplines takedifferent approaches in defining the term. In finance, risk is regarded as hazard and chance andaccount for “upside” and “downside” potential (Zsidisin & Ritchie, 2008). Many researchers focussolely on the negative aspect of risk (March & Shapira, 1987; Royal Society, 1992). In particular,some researchers consider risk as the probability of occurrence of undesirable outcomes stemmingfrom activities (Chiles & McMackin, 1996; Rowe, 1980; Yates & Stone, 1992). Similarly, risk isdefined as an uncertainty which might have a negative, unfavorable, harmful influence onobjectives (Hillson & Murray-Webster, 2007). Moreover, (Lowrance, 1980) defines risk as thelikelihood and impact of unwanted effect.Over time, the concept of risk has evolved and researchers changed their perspective on itsdefinition. The new definition of risk, including downside as well as upside effect on objectives ispresented by (Hillson, 2006; Hillson & Murray-Webster, 2007; Peck, 2006; Wagner & Bode,2008). Some provided an explanation for the risk which is aligned with uncertainty in the sensethat both arise from information insufficiency and lack of knowledge (J. Li & Hong, 2007;Paulsson, 2004; Ritchie & Marshall, 1993). Moreover, (Hyneman, 1971) addresses the differencebetween risk and uncertainty in that risk is a quantitative measure and its outcomes can be assessed,whereas uncertainty is qualitative and no further estimation can be made on it. Risk is differentfrom uncertainty in that risk incorporates not only uncertainty but also loss or damage (Kaplan &Garrick, 1981). It is also conceived that “risk is possibility of loss” whereas hazard is “source ofdanger” (Kaplan & Garrick, 1981). On the other hand, a different perception of risk is introduced3
defining the risk as a measure with both positive and negative outcomes (Moore, 1983). Forinstance, long term commitments with suppliers are beneficial for both supplier and businessunless one party is determined to exploit the other side (Burnes & Dale, 1998; Cousin, Lamming,& Bowen, 2004; Womack, Jones, & Roos, 1990). Additionally, supply chain risk is recognized asoccurrences of any disruption or interruption in the flow of material or information from theupstream (suppliers) to the downstream level (customers) (Jüttner, 2005). (Zsidisin, 2003) definesrisk as a probable disruption to inbound supply chain contributing to the inability to satisfycustomer’s needs.2.2Risk classificationRisk taxonomy is crucial for assessing and managing risks. Risks are generally classified at themacro level into two areas: external and internal. External risks originate from the environmentexternal to the local company. Conversely, any problems deriving from the local company arecalled internal risks. Disruption risks are comprised of natural or environmental risks (for example,earthquakes and volcanoes) and human-related risks (such as war and hijacking) (C. S. Tang,2006). In addition to disruption risks, any uncertainties in demand or supply are assumed toconstitute process or operation risks (C. S. Tang, 2006). Risk categorization also includes sociopolitical risks (e.g. sanctions) and process risks (e.g. machine and process failure) (Jüttner et al.,2003; Jüttner, 2005; Kleindorfer & Saad, 2005).Furthermore, (Kleindorfer & Saad, 2005; Sheffi & Rice Jr, 2005) provide a classification of riskdomains which incorporate market features (such as, market size, new products and new players)and political risks (e.g. government instability). On the other hand, (Kara, Kayis, & Gomez, 2008)emphasize sourcing risks (such as outsourcing, sole sourcing, disruption in supply) andgovernmental risk (e.g. tax problem, duty issues). Different risk factors are presented includingpolitical factors (e.g. Airbus, which is a four-nation association, is exposed to lose a remarkableamount of money due to a trade-off among four nations interests) (C. Tang & Tomlin, 2009), socialfactors (e.g. child labor at Nike company), market factors (e.g. overstocking or understocking as aresult of demand uncertainty), sourcing factors (e.g. issues in regards to Intellectual Property (IP),especially some overseas suppliers disregarding regulations) and process related factors (e.g. anyambiguity in capacity) (C. Tang & Tomlin, 2008).4
(Jüttner, 2005) argues that disruptions arising from political source (e.g. fuel crisis), social source(e.g. terrorist attacks), sourcing (e.g. long lead times) are the main risk origins. (Singhal, Agarwal,& Mittal, 2011; Zsidisin & Ritchie, 2008) emphasize the likelihood of supply chains beingencountered by economic hazards (for instance deviation in tax and exchange rates), by marketfactors for example, presenting improper products regardless of markets features, customers andcompetitors’ behavior, customer anticipation and any variation in regards to price). (Manuj &Mentzer, 2008) define other risk drivers originating from sourcing (e.g. discontinuity in supplydue to fire and insolvency) and internal processes (e.g. insufficient capacity in procurement). Theseare all external hazard resulting in adverse consequences. (Ritchie & Brindley, 2007) considerother risks triggered by economic hazard (e.g. tax rate shifts and inflation), process (e.g. processor procedure issues) and sourcing (e.g. issues consisting upholding stock, lead-times, support, andservice).The inability to be adaptive to market features, variation in lead-times, low quality, supplierinsolvency, delivery issues and machine failures are all circumstances which endanger supplychains to an eventual complete failure (Gaonkar & Viswanadham, 2007). Different risk terms arealso presented, encompassing market risks (for instance commodity price, interest, and exchangerate) and process risks (e.g. system downtime related) by (Scandizzo, 2005). Although someresearchers emphasize other aspects of risk (e.g. tariff shifts, import, export regulations and beinghighly reliant on single supplier) (Zsidisin, Panelli, & Upton, 2000; Zsidisin, Ellram, Carter, &Cavinato, 2004), others stress that the inability of suppliers in providing customers’ demandsexpose the supply chain to hazards and subsequently adverse effects (Zsidisin et al., 2004).Some researchers argue that even though implementing a risk management strategy might reducerisk exposure in some ways, the probability of being subjected to another risk might increase aswell. For example, while using lean techniques necessitates lower demand forecast errors, suchtechniques also expose the company to supply disruptions (Chopra & Sodhi, 2012). Some scholarsaccentuate that the bullwhip effect is induced by a number of drivers such as disruptions incapacity, information distortion, shifts in demand and lack of knowledge (sourcing risk) (Ketikidis,Lenny Koh, Gunasekaran, Cucchiella, & Gastaldi, 2006; T. Wu, Blackhurst, & O’grady, 2007).Other experts point out that the effect of transportation hazards should not be underestimated (e.g.long lead time, delay in deliveries, port strike, paper scheduling, and high transportation expenses)(O. Tang & Musa, 2011; Yu, Zeng, & Zhao, 2009). In addition to the external risks mentioned5
above, a series of other factors determine internal risk including excessive holding cost, humanerrors, system and process failures, as well as modification in material or processes (Cachon, 2004;Davies, Finlay, McLenaghen, & Wilson, 2006; Han & Chen, 2007;Lockamy III & McCormack,2010). Table 2-1 demonstrates a summary of risk categorization and associated definitions.Table 2-1 Risk categorization and definitionRisk domainLevel 0ExternalrisksArticlesLevel 1DefinitionLevel 2Natural orenvironmental risk(C. S. Tang, 2006)Natural disasters (forinstance hurricanes,earthquakes, volcanoeruption)Man-madedisasters(C. S. Tang, 2006)Terrorism, war,hijackingPolitical risk(Jüttner et al., 2003;Jüttner, 2005; Karaet al., 2008; O. Khan& Burnes, 2007;Kleindorfer & Saad,2005; Sheffi & RiceJr, 2005; C. Tang &Tomlin, 2008; C.Tang & Tomlin,2009; C. S. Tang,2006)Any radical changes ingovernment caninfluence taxationconstitution.Governmentinstability, sanctions.Social/reputational/cultural risk(Jüttner, 2005;Spekman & Davis,2004; C. Tang &Tomlin, 2008; C.Tang & Tomlin,2009; C. S. Tang,2006)Labour strike andrebel, customs, social,and language barriers(For instance, wellknown company suchas Nike was accusedof using child labourin shoe production.Economic risk(Manuj & Mentzer,2008; Ritchie &Brindley, 2007;Wagner & Bode,2006)Fuel price fluctuationschanges, tax ratechanges, inflation ,exchange rates6
Market riskCompetitive risk,financial risk,demand risk,forecasting risk(Gaonkar &Viswanadham, 2007;Kara et al., 2008;Ketikidis et al.,2006; Lockamy III& McCormack,2010; Manuj &Mentzer, 2008;Scandizzo, 2005;Singhal et al., 2011;C. Tang & Tomlin,2008; C. S. Tang,2006; Zsidisin et al.,2000; Zsidisin et al.,2004; Zsidisin &Ritchie, 2008)Governmental risk(Kara et al., 2008;Kiser & Cantrell,2006; Zsidisin et al.,2000)Sourcing risk(Childerhouse,Hermiz, MasonJones, Popp, &Towill, 2003;Chopra & Sodhi,2012; Davies et al.,2006; Gaonkar &Viswanadham, 2007;Ghadge, Dani, &Kalawsky, 2012;Jüttner, 2005; Karaet al., 2008; Kaya &Özer, 2009;Ketikidis et al.,2006; Manuj &Mentzer, 2008;Norrman & Jansson,2004; Ritchie &Brindley, 2007;Singhal et al., 2011;C. Tang & Tomlin,2008; T. Wu et al.,2007; Zsidisin et al.,2004)Single/ multiplesourcing risks,lack ofinformationSharing risk/supply risk7Businesses arethreatened by newproducts, new players,low profit margin,commodity price,market size andproduct.Regulatory risks, taxrules, duty issues Improperforecastingwhich leads toinaccurateunderstandingof customer’sneeds.Bullwhipeffect due tolack ofinformation orinformationdistortionLong leadtimesPoor qualityLack of rawmaterials orinability tomeetcustomer’sdemand
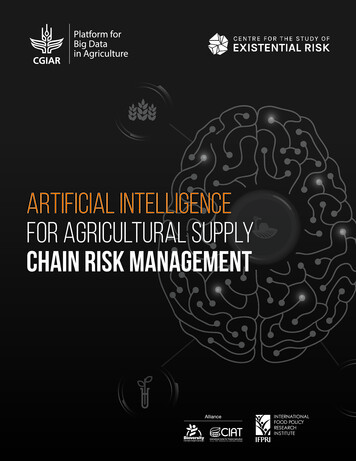
Transportation risk(Gaonkar &Viswanadham, 2007;O. Tang & Musa,2011; Yu, Zeng, &Zhao, 2009)Process risk(Cachon, 2004;Childerhouse et al.,2003; Chopra &Sodhi, 2012; Davieset al., 2006; Gaonkar& Viswanadham,2007; Ghadge et al.,2012; Han & Chen,2007; Jüttner et al.,2003; Kleindorfer &Saad, 2005;Lockamy III &McCormack, 2010;Manuj & Mentzer,2008; Ritchie &Brindley, 2007;Scandizzo, 2005;Singhal et al., 2011;C. Tang & Tomlin,2008; C. S. Tang,2006; Zsidisin &Ritchie, 2008)Machinebreakdown orobsolescence ,Internal risks2.3interruption ofservice or systemdue to powerfailures, labourstrikesTransportation modes,delivery costs, latedeliveriesWhich addresses anyfailures in regards toprocedure, process,system or machineRisk mappingIn order to inform companies about the likelihood of risk occurrence and severity of its impact,risk mapping is an imperative step before adopting any risk management strategies. Somescientists stress the necessity of risk mapping for risk identification, evaluation, auditing andcontrol (Basel Committee, 2003). The plain and general form of mapping is composed of twoelements; likelihood and levels of impact. Risks with high probability and severity have priorityto be assessed (Scandizzo, 2005). Figure 2-1 shows one way of mapping risks on a twodimensional axis (Scandizzo, 2005).8
Figure 2-1 Risk mapping structure based on likelihood vs severity (Scandizzo, 2005)2.3.1 Risk heat map and risk matrixOne type of risk mapping is the risk heat map where the possibility of risk taking place and itsimpact is displayed. Risk levels are categorized into low, medium, high level and are achieved bythe likelihood consequence of risk incidence (Cox Jr, Louis Anthony Tony, 2012; DominguezChicas & Scrimshaw, 2010). Figure 2-2 is a demonstration of the risk heat map (DominguezChicas & Scrimshaw, 2010). Another type of graphical depiction approach, which is similar torisk heat map, is risk matrix. As illustrated in Figure 2-3, a risk matrix is a combination of riskprobability and its impact and is beneficial in finding and assessing critical risks (Markowski &Mannan, 2008).As shown in Figure 2-2, the risks levels categorization are low, medium and high. A risk heat mapis a 5 by 5 matrix in which both the likelihood and consequence elements can get a score of 1 to5. The li
small manufacturing company that struggles with outsourcing risk arising from both lead time and demand uncertainties. We first detect uncertainties, then design a simulation model to illustrate the impact of these uncertainties on the company's performance, where we use the number of lost customers as the company's performance indicator.