Transcription
Global Tech Support ScamResearchThis report is shared by YouGov and Microsoft under mutual agreement. Any reproduction of figures or statements must by approved by YouGov and Microsoft.
Study overviewWhy The goal of this research was to understand the incidence andconsequences of four types of technology scams. Measure the monetary,productivity and psychological impacts to consumers across multiplegeographic and demographic groupsWho Web based survey of 16,254 adult (18 ) internet users in 16 countriesworldwide ( 1,000 per country). Sample within each country weighted toalign with internet user population on age, gender, and region.What Online survey (optimized for PC or mobile) Average survey length 10 minutesWhen May 6-17, 2021Where2021 cludedUnited KingdomincludedUnited StatesincludedFour markets from 2018 survey (China, Denmark, SouthAfrica, New Zealand) were not included in 2021)This report is shared by YouGov and Microsoft under mutual agreement. Any reproduction of figures or statements must by approved by YouGov and Microsoft.
The state of tech support scams in 2021 Continuing the trend from 2018, fewer consumers were exposed to scams: Globally the number of interactions reported fellby 5-points to 59%, largely driven by a reduction in scams involving pop-up ads or windows (37% vs. 45% in 2018) and redirectsto websites (30% vs. 37%). However, those exposed were more likely to have lost money: Despite a subsequent reduction in consumers continuing witha scam (16% vs. 19%), the number of people directly losing money increased slightly from 6% to 7% in 2021. On a positive note,more of those who lost money were able to recover some, and fewer people spent spent time or money on checking andrepairing a computer. Sensitive financial information continues to be at risk: While scammers most commonly asked consumers to downloadsoftware or go to a website (with 30% reporting computer problems), the proportion of consumers asked for their SSN increasedsince 2018, and 16% were asked to their banking website. Not surprising, there was an increase in the number of consumersreporting fraudulent use of credit/debit or store cards or fraudulent use of online stores, accounting for the increase in money lost. Consumers are more wary of scam risk: Consumers have grown more sceptical of unsolicited contact, with 79% thinking itunlikely that a reputable company would contact them in this way ( 5 since 2018), and 86% unlikely to trust it ( 3). Younger consumers and males continue to be most at risk: As in 2018, it is Gen Z, Millennials, and Males who were hardesthit and most likely to have lost money; likely due to younger generations being more ‘online’ and engaging in more risky activities.Interestingly, confidence in computer usage and the internet has decreased across all ages, opening up potential for furthereducation.This report is shared by YouGov and Microsoft under mutual agreement. Any reproduction of figures or statements must by approved by YouGov and Microsoft.
Tech support scam landscape 2021This report is shared by YouGov and Microsoft under mutual agreement. Any reproduction of figures or statements must by approved by YouGov and Microsoft.
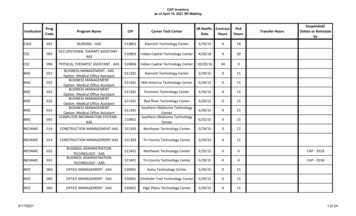
Anatomy of tech support scamsScam exposure had costs beyond the initial loss of money( /- vs. 2018)Around half ofthosecontinuingincurred a directeconomic cost7% ( 1)Lost money to scam59% (-5)41% ( 5)Exposed to ScamNo Interaction16% (-3)42% (-2)ContinuedIgnored scam2% (-2)3% (-3)Spent money on checking &repairingInvested timechecking & repairing5% (-)Nothing happenedThose who avoided direct scamlosses spend time and money onrepairs or to ensure their deviceswere not compromisedBase: Total Note: Boxes may not sum to 100% due to rounding.Q1a. Please indicate whether you have experienced any of the following in the last year or so (January 2020 to present).Q2. For each of the interactions you experienced, please indicate which actions you took. If you experienced more than one interaction of each type, think of the most recent one you can recall.Q8. As a result of this most recent interaction, have you lost any money? If so, how much?Q12. To date, how much money, if any, has it cost you to fix or investigate further as to whether your computer had been compromised after this interactionQ12A. To date, how much time has it taken to fix or investigate further as to whether your computer had been compromised after this most recent interaction?
Fewer scam interactions were reported in 2021, with a drop in pop-upads or windows and redirects to websites fuelling the declineAny scam interactionType of scam interaction45%37%64%59% 27%36%41%20182021No scam interactionScam interactionBase: TotalQ1a. Please indicate whether you have experienced any of the following in the last year or so (January 2020 to present).37%34%37%30%25%Unsolicited callPop-up ad or Unsolicited emailwindow2018 2021Redirect towebsite
As in 2018, consumers were most likely to continue with telephone callsand website redirectsActions taken ( /- vs. 2018)Base: Those who experienced each interactionIgnored interaction completely12% (-1)16% (-2)72% ( 3)Unsolicted telephone callInitially continued, but did not take further action10% (-1)10% (-1)12% (-2)12% (-3)77% ( 2)78% ( 4)Pop-up window or adUnsolicted emailContinued with recommended action11% (-1)17% ( 1)72% (-)Website redirectBase: Total who experienced each type of scamQ2. For each of the interactions you experienced, please indicate which actions you took. Select the best fit for each. If you experienced more than one interaction of each type, think of the most recent one you can recall. Ignored
Fewer scams also meant fewer people continued with an interactionActions taken after scam interaction} Around one-in-sixconsumers (16%) weretricked into continuing with apotentially fraudulentactivity, slightly down on2018 (20%)} A slightly higher proportionwent on to lose money inthe interaction (7% vs. 6%)No scam interactionIgnored scam interactionContinued - didn't lose moneyContinued - lost money6%14%44%36%201820% continued7%9%42%41%2021Base: TotalQ1a. Please indicate whether you have experienced any of the following in the last year or so (January 2020 to present).Q2. For each of the interactions you experienced, please indicate which actions you took. If you experienced more than one interaction of each type, think of the most recent one you can recall.16% continued
Although a higher proportion lost money through a scam interaction,more were able to recover any of itLost moneyBase: Those who continued with any scamYesNoMethod of payment2018Don't %14%Western UnionOtherDon't know32%Gift card3%No48%40%33%Bank transfer*31%Yes34%Paypal43%Base: Those who lost any money2021Credit card52%Recovered any moneyBase: Those who lost any money7%5%*New option in 2021Q8. As a result of this most recent interaction, have you lost any money? If so, how much?Q9. How did you make the payment(s) for any money you lost as a result of this most recent interaction? Select all that apply.Q10. How much, if any, of this money have you managed to recover to date?5%2%20182021
At the global level, tech support scams were less prevalentImpact of tech support scams by country ( /- vs. 2018)Continued - lost money41%( 5)71%( 7)42%(-1)9% (-4)7% ( 1)24%(-5)1% (-3)3% ( 1)53%( 7)50%48%47%( 9)46%( 7)Continued - didn't lose40%( 3)38%(-4)37%Ignored35%No interaction35%( 3)35%( 9)33%(-)32%( 3)31%( 1)21%(-9)38%(-3)6% (-4)4% (-1)38%9%3%41%5%6%44%( 3)6% (-6)4% (-6)42%(-3)7% (-4)5% ( 1)52%( 6)7% (-4)1% (-5)49%( 5)9% (-2)5% ( 1)45%12%6%52%8%6%49%(-1)10%(-5)6% ( 3)42%(-4)14%(-6)9% ( 1)49%(-)49%(-3)8% (-4)10%( 4)10%(-2)9% ( 3)17%(-9)31%( 18)30%(-3)40%(-2)22%( 3)7% ( 2)*New in 2021Base: Total Note: Country percentages may not add to 100% due to roundingQ1a. Please indicate whether you have experienced any of the following in the last year or so (January 2020 to present). Q2. For each of the interactions you experienced, please indicate which actions you took. If you experiencedmore than one interaction of each type, think of the most recent one you can recall. Q8. As a result of this most recent interaction, have you lost any money? If so, how much?
Globally the number of people losing money remained consistentIndia recorded the biggest increase, with almost a third losing money through a tech support scamPercent who continued and lost 16%4%5%4%5%5%4%4%3%2%3%6%1%*New in 2021Base: TotalQ1a. Please indicate whether you have experienced any of the following in the last year or so (January 2020 to present). Q2. For each of the interactions you experienced, please indicate which actions you took. If you experiencedmore than one interaction of each type, think of the most recent one you can recall. Q8. As a result of this most recent interaction, have you lost any money? If so, how much?
Losing money tends to correlate with trust in unsolicited contact, whereconsumers are more trusting, more lose moneyPercent who continued and lost money / Likelihood to trust unsolicited contact47%Increase of 15 points inlikelihood to trust tallies withsignificant increase in moneylostDecrease of 10 points inlikelihood to trust tallies withsignificant decrease inmoney lost in UK and CH31%23%19%18%14%7%13%10%9%12%9%7%10%6%Continued and lost /Somewhat likely to trust unsolicted contactBase: TotalQ1a. Please indicate whether you have experienced any of the following in the last year or so (January 2020 to present). Q2. For each of the interactions you experienced, please indicate which actions you took. If you experiencedmore than one interaction of each type, think of the most recent one you can recall. Q8. As a result of this most recent interaction, have you lost any money? If so, how much? Q14. In the future, if you were to receive an unsolicited call,pop up, text message, advertising or email from someone claiming to be from a reputable company offering you help, how likely would you be to trust this resource?
Those who lost money engaged more in risky activities and displayed(over) confidence in their computer literacyOnline Activities (% always/often)AllComputer literacyContinued, lost moneyUse torrent sitesDownload movies, tv, music, videoShare email address in exchangefor contentBuy products online10%Potentially risky activitiesIntermediate (4-6)Advanced (7-8)Expert (9-10)38%19%23%44%22%43%34%14%42%41%45%62%57%Use social mediaChange passwordsBeginner (1-3)26%Download the latest softwareupdatesAccess my bank/credit cardaccountsBase: TotalQ21a. Please check how often you do the following activities when you are online?Q21b. Which best describes your experience with computers and how to use the Internet?42%43%45%50%49%30%38%6%5%Continued, lost moneyAll
Downloading software and going to a specific website continue to bethe most common requests, though to a lesser degree than in 2018Actions asked to doBase: Those who continued with any scam20182021They asked you to download some softwareThey asked you to go to a specific website29%They tried to sell something to you27%They ran a security scan on your computer which showed a virus infectionor some other problem24%They asked to have remote access of your computer22%24%They asked for your credit card information or other form of payment23%22%They asked you to type something on your computer22%20%They downloaded software onto your computer for you18%13%They asked for your social security numberThey asked you to go to your banking website**New option in 202117%16%4%6%None of theseDon't know43%30%2%2%Base: Total who continued with any interactionQ5. Did any of the following occur during this most recent interaction, and/or as a direct result of it? Please select all that apply.22%27%31%34%
Consumers continued to fall for the most common requestsWhat happened during the interactionBase: Those who continued with any scam20182021You went to a website, as requested by the caller22%New software was downloaded onto your computer21%You purchased what you believed to be authentic software or an anti-virussolution15%The company gained access to your personal information like date of birth orsocial security number15%17%The company gained remote access to your computerThe company obtained your credit card informationThe company gained access to your online banking*You purchased cryptocurrency (such as Bitcoin) to pay the company**New options in 2021Base: Total who continued with any interactionQ6. And which of the following happened during this most recent interaction and/or as a direct result of it? Please select all that apply.17%15%14%13%13%12%19%26%30%
Tallying with an increase in money being lost, victims were more likelyto experience fraudulent use of cards or fraudulent shoppingWhat happened during the interactionBase: Those who continued with any %14%3%ComputerproblemsComputerFraudulent useFraudulentpasswords were of your credit /shopping oncompromiseddebit / storeyour regularcardsonline stores bysomeone elseIdentity fraudMoney wastaken out of yourbank accountBase: Total who continued with any interactionQ7. After this most recent interaction which, if any, of the following problems did you experience that you think relates directly to it? Please select all that apply.3%2%OtherNone of these5%Don't know
And as a result, more contacted their card provider after the interactionActions taken after interactionBase: Those who continued with any scam28%Block the company so they cannot contact you in the futureLook up the issue on the Internet21%21%Seek help from a computer specialist18%18%18%Contact your bank14%Contact your credit / debit / store card company17%15%14%Contact the software/computer company10%12%Call the police9%Take your computer back to the place you bought itOther32%25%Seek help from a computer savvy friend or relative12%4%3%None of theseBase: Total who continued with any interactionQ11. After this most recent interaction, which of the following actions did you take? Please select all that apply.14%15%31%21%20182021
Victims spent time and money on checking and repairing theircomputers after a scam interactionStress caused by scam ( /- vs. 2018)Base: Those who continued with any scamNo stressMild stressModerate stressSevere stressTime to fix/investigate( /- vs. 2018)Base: Those who continued with a computer related scamNo timeWeek or lessUnable to repairCost to fix/investigate Few hours WeekYes3% ( 1)5% ( 2)51%NoDon't know51%45%28% (-5)( /- vs. 2018)Base: Those who continued with a computer related scam45%38% (-1)41% (-3)29% (-3)22%( 5)24% (-)5%4%8% ( 4)2018Q12. To date, how much money, if any, has it cost you to fix or investigate further as to whether your computer had been compromised after this interaction?Q12a. To date, how much time has it taken to fix or investigate further as to whether your computer had been compromised after this most recent interaction?Q13. Thinking back across the interaction, how much stress did you suffer? If you had multiple interactions, think how you felt about the most stressful one. The most stressful interaction caused me 2021
Consumers are increasingly likely to distrust unsolicited contact andtake action to protect themselvesLikelihood of future trustBase: TotalVery/somewhat likelyVery/somewhat unlikelyActions in response to hypothetical contactBase: Those who did not experience any scams/continue with any interactionBlock the company so they cannot contactyou in the future38%43%34%32%Look up the issue on the InternetReport it to the reputable company whosename/product was cited during the contact*83%17%201886%14%2021Contact your bank12%16%Seek help from a computer savvy friend orrelative17%14%Contact your credit / debit / store cardcompany10%14%Seek help from a computer specialist13%12%Take your computer back to the place youbought it201820219%11%Call the policeNone of these*New option in 202127%3%3%17%24%Q14. In the future, if you were to receive an unsolicited call, pop up, text message, advertising or email from someone claiming to be from a reputable company offering you help, how likely would you be to trust this resource?Q16. In the future, if you received this type of unsolicited contact, which of the following would you do? Please select all that apply.
Consumers fail to recognize the importance of making contact with thecompany to verify authenticityVerification of %38%26% 26%10% 9%The company doesThe company does I initiated theNOT ask for any of NOT request orcontact with themy personaldemand paymentcompanyinformation*New option in 2021The email/website The company does The incomingThe company The caller is politedoes not include not try to initiate telephone number gives a physicalmisspellings/uses remote access tois clearlyaddressproper grammarmy computer*identifiableQ20. In the future, if you were to receive a similar communication that appeared to be from a reputable company, how would you verify it was an authentic, legitimate communication? Please select all that apply.
Respondents were unlikely to trust companies and lost trust followingscam interactionsTrust in companiesBase: Those who continued with any scam2018202152%50%Trust lost post fraudBase: Those who continued with any scam30%28%22%18%Base: TotalLost all trustLost a lot of trustVery likelyLost a little trustDid not lose any trustSomewhat unlikely Very unlikely11%DistrustLikelihood of company contact31%42%13%34%39%47%28%19%Trust a lot/a littleDistrust a little Distrust a lot/no trust at allSomewhat likely15%14%2018202152%27%16%7%5%20182021Q13b. How much do you trust reputable software and technology companies not to sell you unnecessary support or repair services to fix new problems that are discovered on your computer?Q13c. Thinking back across the interaction(s) you’ve had, have they caused you to lose trust in reputable software and technology companies to protect you from these types of interactions?Q15. How likely do you think it is that a reputable company would contact customers in the ways we’ve been asking about, without first being contacted by the customer?
Perception of responsibility continues to shift away from the companyscammers claim to represent and towards consumer protection agenciesGreatest responsibility to protect consumers2018202123%20%18%20%13% 14%15%13%13% 12%13%11%8%Consumer protectionagenciesGovernmentregulators in yourcountryGovernmentReputable companies Law enforcement inregulators in thethe scammers claimthe country fromcountry from whichto representwhich the scamthe scam originatesoriginatesBase: TotalQ18. In your opinion, which one has the GREATEST responsibility to protect consumers?Law enforcement inyour country7%None of these
Consumer protection agencies and government regulators are seen tohave the biggest responsibility to protect consumersResponsibility to protect consumers ( /- vs. 2018)Has theGREATEST responsibility:23% ( 3)Great deal/fair amount70% (-1)20% ( 1)70% (-1)14% ( 1)72% (-1)Just someVery little/none12% (-)11% (-2)68% (-5)64% (-6)18% ( 2)22% ( 4)14% ( 2)14% ( 2)Law enforcement in thecountry from which thescam originatesLaw enforcement in yourcountry57% (-6)22% ( 2)19% (-)19% ( 1)17% (-)12% ( 1)11% (-)11% (-)Consumer protectionagencies13% (-3)21% ( 4)Government regulators in Government regulators in Reputable company thescammers claim toyour countrythe country from which therepresentscam originatesBase: TotalQ17. For each of the following organizations, please indicate how much responsibility you believe they should have for protecting consumers from this type of scam or intrusion?Q18. In your opinion, which one has the GREATEST responsibility to protect consumers?
2021 sees more consumers turning to websites of membershiporganizations for information on tech support scamsSources used for tech supportSearch engines43%31%33%Company websites27%25%Online forums/blogs22%23%Social networking sites14%Websites of membership organizations19%18%19%Local news (TV/radio)Computer or electronics-focused l magazine/newspaperWebcasts6%6%Base: TotalQ19. Which, if any, of the sources below would you use for information related to technical support scams like the ones we’ve been discussing? Please select all that apply.2018202146%
As in 2018, Gen Z, Millennials and Males were most likely to experiencea scam interaction, though to a lesser degree than in 2018Type of interaction by generation and genderUnsolicited telephone callPop-up window or adUnsolicited emailRedirect to website46%42%39%38%42%35% 35%35%31%25%25%Any scam( /- vs. 2018)28%24%27% 28%39%35%31%32%29%30%25%22%22%18-23: Gen Z24-37: Millennial38-53: Gen X54 : BoomerMaleFemale67% (-3)64% (-4)56% (-5)53% (-5)64% (-4)53% (-6)Base: TotalQ1a. Please indicate whether you have experienced any of the following in the last year or so (January 2020 to present).
More specifically, Gen Z and Millennial Males experienced more scaminteractionsType of interaction by generation and genderUnsolicited telephone call47%42%40%37%33%30%28%29%18-23: Gen Z and 18-23: Gen Z and 24-37: MillennialMaleFemaleand MaleAny scam68% (-5)Redirect to website65% (-1)37%34%30%41%41%33%28%22%21%( /- vs. 2018)Unsolicited email47%46%41%Pop-up window or ad69% (-4)30%30%20%37%33%29%26%22%25% 26%23%18%24-37: Millennial 38-53: Gen X and 38-53: Gen X and 54 : Boomer and 54 : Boomer andand FemaleMaleFemaleMaleFemale58% (-5)Base: TotalQ1a. Please indicate whether you have experienced any of the following in the last year or so (January 2020 to present).63% (-4)50% (-5)59% (-3)47% (-7)
Despite fewer interactions, younger generations and males were morelikely to continue and lose money in their interactionImpact of tech scam by age and genderContinued - lost moneyIgnoredContinued - didn’t lose moneyNo interaction47%44%42%41%12%36%11%6% 2-5- 318-23: Gen Z40%36%33%11% 12%44%44% 2-6- 424-37: Millennial47%45% 19%-310% 10%7%-3 538-53: Gen X2%--39%4%-2 554 : Boomer 2-4-2 4MaleBase: TotalQ1a. Please indicate whether you have experienced any of the following in the last year or so (January 2020 to present).Q2. For each of the interactions you experienced, please indicate which actions you took. If you experienced more than one interaction of each type, think of the most recent one you can recall.--4-1Female 6vs. 2018
Again, Gen Z and Millennial males were most susceptible to losingmoneyImpact of tech scam by age and gender ( /- vs. 2018)Continued - lost money32% ( 5)42% (-)12% (-7)13% ( 1)18-23: Gen Z Male35% ( 1)46% (-)12% (-3)8% ( 2)18-23: Gen Z Female31% ( 4)Continued - didn’t lose money42% ( 5)37% ( 4)40% ( 2)45% (-4)41% (-2)IgnoredNo interaction50% ( 5)39% (-2)41% ( 3)49% (-1)11% (-5)16% ( 3)10% (-6)10% (-3)7% (-)9% ( 3)24-37: Millennial 24-37: Millennial MaleFemale38-53: Gen X Male8% (-3)3% (-)38-53: Gen X Female8% (-3)2% ( 1)54 : Boomer MaleBase: TotalQ1a. Please indicate whether you have experienced any of the following in the last year or so (January 2020 to present).Q2. For each of the interactions you experienced, please indicate which actions you took. If you experienced more than one interaction of each type, think of the most recent one you can recall.53% ( 7)38% (-3)7% (-3)1% (-1)54 : Boomer Female
Gen Z & Millennials continue to engage more in activities associatedwith scamsOnline Activities (% always/often)Gen ZMillennialGen 5%24%Potentially risky activities41%36%35%26%32%26%30%28%21%17%8%Download thelatest softwareupdatesChangepasswordsUse social mediaBase: TotalQ21a. Please check how often you do the following activities when you are online?Access my bankand/or credit cardaccountsBuy productsonline13%16%15%9%4%Download movies, Share my email in Use torrent sitestv, music, otherexchange forvideocontent
Appendix
Pop-up windows and website redirects had the biggest decline acrossmarkets. India and Singapore saw large increases in phone scamsTech support scam incidence by marketBrazilIndiaMexicoColombia*Spain*United andUnited w or %21%18%Pop-upUnsolicitedUnsolicitedwindow or ad telephone call telephone call /- vs 20182021 /- vs 1%-5%-12%40%1%-13%22%5%NA24%NANA25%NA-12%5%-2%*New markets in 2021Base: TotalQ1a. Please indicate whether you have experienced any of the following in the last year or so (January 2020 to 41%41%34%35%26%35%30%34%31%16%Unsolicitedemail /- vs irect to %19%15%16%15%Redirect to awebsite /- vs -5%
In general, most markets either had fewer interactions, or were able toignore moreImpact of tech support scam by marketIndiaUnited apanFinland*United KingdomNo interaction2021No interaction /- vs. 2018Ignored2021Ignored /- vs. -3%-2%-1%-1%NANANA5%-3%-3%3%-5%NA6%Continued, didn't Continued, didn’t Continued andlose moneylose moneylost money2021 /- vs. %4%6%-6%4%1%-3%3%9%NA3%7%-4%1%Continued andlost money /- vs. 201818%4%1%3%2%1%3%NANANA1%1%-1%-6%1%NA-5%* New markets in 2021 Base: Total Note: Country percentages may not add to 100% due to roundingQ1a. Please indicate whether you have experienced any of the following in the last year or so (January 2020 to present). Q2. For each of the interactions you experienced, please indicate which actions you took. If you experiencedmore than one interaction of each type, think of the most recent one you can recall. Q8. As a result of this most recent interaction, have you lost any money? If so, how much?
Respondents continue to rely on the Internet for adviceThose in South America are more likely to seek expert help from friends or computer specialistsHypothetical future actions takenBase: Those who did not experience any interactions/ did not continue with any k the company so they cannot contact youin the %47%42%Look up the issue on the 32%35%30%Report it to the reputable company whosename/product was cited during the 0%30%28%Contact your %11%Seek help from a computer savvy friend %16%7%10%Contact your credit / debit / store 3%9%12%Seek help from a computer 7%Call the Take your computer back to the place youbought it3%1%6%1%11%1%1%1%6%1%6%2%3%4%1%0%2%None of %25%Q16. In the future, if you received this type of unsolicited contact, which of the following would you do? Please select all that apply.
Government regulators and consumer protection agencies aregenerally viewed as having responsibility to protect consumersGreatest responsibility to protect er protection 21%21%27%Government regulators in your 25%20%Government regulators in the country from whichthe scam %14%20%15%Reputable companies the scammers claim %9%11%13%Law enforcement in the country from which thescam %12%11%Law enforcement in your ne of these7%5%5%9%3%7%7%9%8%19%5%8%7%4%6%6%6%Base: Total.Q18. In your opinion, which one has the GREATEST responsibility to protect consumers?
Search engines and company websites are top resources for techsupport scams informationSources used for tech supportAllAUBRCACOFIFRDEINJPMXNLSGESCHUKUSSearch 6%53%43%Company 32%31%37%Online %10%15%9%19%Local news 0%21%10%18%Computer or electronics 0%14%31%10%19%12%18%12%16%6%16%Traditional %1%6%Others3%4%3%4%1%4%3%2%0%1%1%4%1%3%4%5%4%None of 5%Social networking sites (LinkedIn, Facebook,Twitter)Websites of membership organizations (such asAARP)Base: TotalQ19. Which
Global Tech Support Scam Research. This report is shared by YouGov and Microsoft under mutual agreement. Any reproduction of figures or statements must by approby YouGov and Microsoft. ved. Study overview. Why The goal of this research was to understand the incidence and