Transcription
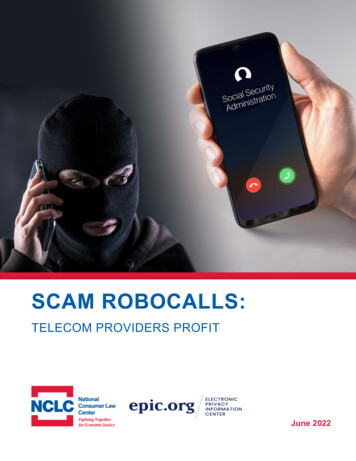
Global Tech Support ScamResearch: India
Study overview Examines the incidence and consequences of techsupport scams worldwide2021 includedColombiaNEW12 countries are consistent with 2018 StudyColombia, Finland, Netherlands, and Spain are new in 2021FinlandNEWFranceIncluded Sampled consumers 18 and older, proportional tointernet user nNEWSwitzerlandincludedUnited KingdomincludedUnited Statesincluded Web based survey of 16,254 adult internet users in16 countries worldwide ( 1,000 per country) Comparisons made throughout this report to 2018studyFour markets from 2018 survey (China, Denmark, SouthAfrica, New Zealand) were not included in 2021)
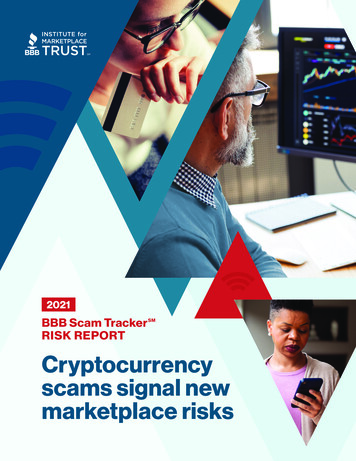
7 out of 10 consumers were targeted by a tech support scammerScam exposure had costs beyond the initial loss of money( /- vs. 2018)Over two-thirdsof thosecontinuingincurred a directeconomic cost69% (-1)31% ( 1)Exposed to ScamNo Interaction48% ( 8)21% (-9)ContinuedIgnored scam31% ( 18)4% (-3)5% (-6)Lost money to scamSpent money on checking &repairingInvested timechecking & repairing7% ( 1)Nothing happenedThose who avoided direct scamlosses spend time and money onrepairs or to ensure their deviceswere not compromisedBase: Total Note: Boxes may not sum to 100% due to rounding.Q1a. Please indicate whether you have experienced any of the following in the last year or so (January 2020 to present).Q2. For each of the interactions you experienced, please indicate which actions you took. If you experienced more than one interaction of each type, think of the most recent one you can recall.Q8. As a result of this most recent interaction, have you lost any money? If so, how much?Q12. To date, how much money, if any, has it cost you to fix or investigate further as to whether your computer had been compromised after this interactionQ12A. To date, how much time has it taken to fix or investigate further as to whether your computer had been compromised after this most recent interaction?
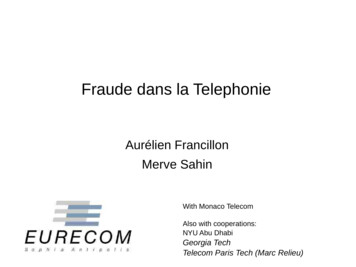
Consumers in India more likely to be impacted by scamsImpact of tech support scams by country ( /- vs. 2018)Continued - lost money41%( 5)71%( 7)42%(-1)9% (-4)7% ( 1)53%( 7)48%47%( 9)46%( 7)40%( 3)38%(-4)37%Ignored35%No interaction35%( 3)35%( 9)33%(-)32%( 3)31%( 1)21%(-9)38%(-3)24%(-5)1% (-3)3% ( 1)50%Continued - didn't lose6% (-4)4% (-1)38%9%3%41%5%6%44%( 3)6% (-6)4% (-6)42%(-3)7% (-4)5% ( 1)52%( 6)7% (-4)1% (-5)49%( 5)9% (-2)5% ( 1)45%12%6%52%8%6%49%(-1)10%(-5)6% ( 3)42%(-4)14%(-6)9% ( 1)49%(-)49%(-3)8% (-4)10%( 4)10%(-2)9% ( 3)17%(-9)31%( 18)30%(-3)40%(-2)22%( 3)7% ( 2)*New in 2021Base: Total Note: Country percentages may not add to 100% due to roundingQ1a. Please indicate whether you have experienced any of the following in the last year or so (January 2020 to present). Q2. For each of the interactions you experienced, please indicate which actions you took. If you experiencedmore than one interaction of each type, think of the most recent one you can recall. Q8. As a result of this most recent interaction, have you lost any money? If so, how much?
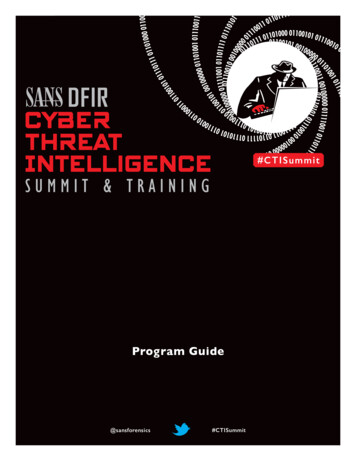
India has biggest increase; almost a third losing money through a scamPercent who continued and lost 16%4%5%4%5%5%4%6%4%3%2%3%1%*New in 2021Base: TotalQ1a. Please indicate whether you have experienced any of the following in the last year or so (January 2020 to present). Q2. For each of the interactions you experienced, please indicate which actions you took. If you experiencedmore than one interaction of each type, think of the most recent one you can recall. Q8. As a result of this most recent interaction, have you lost any money? If so, how much?
Large increase in scams stemming from unsolicited callsType of scam interactionAny scam interaction56%30%31%51%49% 48%44%No scam interaction42%31%23%70%69%Scam interactionUnsolicited call20182021Base: TotalQ1a. Please indicate whether you have experienced any of the following in the last year or so (January 2020 to present).Redirect towebsite2018Unsolicited email2021Pop-up ad orwindow
Respondents were most likely to respond to unsolicited telephone callsActions taken ( /- vs. 2018)Base: Those who experienced each interactionDon’t knowIgnored interaction completelyInitially continued, but did not take further action33% ( 11)45% ( 19)25% ( 2)Continued and took recommended actions36% ( 16)26% (-1)30% ( 7)32% ( 4)28% (-2)39% (-14)36% (-14)36% (-8)2% (-1)An unsolicited email2% (-3)Redirect to a website24% (-14)2% (-3)An unsolicted telephone call4% ( 1)A pop-up window or adQ2. For each of the interactions you experienced, please indicate which actions you took.
On average, 15,334 was lost, but 10,797 was able to be recoveredMoney lost due to fraudMethod of paymentMoney recovered to dateBase: Those who continued with any scamBase: Those who lost any moneyBase: Those who lost any money33%35%Bank transfer43%Gift card59%38%22%Paypal32%Credit card32%8%17%12%Bitcoin25%Western UnionOther12%5%Don’t know options not shownQ8. As a result of this most recent interaction, have you lost any money? If so, how much?Q9. How did you make the payment(s) for any money you lost as a result of this most recent interaction? Select all that apply.7%
Majority of those who continued with a scam had moderate/severe stressNon-monetary impact ( /- vs. 2018)82%( 1)77%76%(-6)(-)69%(-9)Spent time checking/repairing PC*Level of stress (Severe/Moderate)**IndiaGlobal* Base: Those who continued with computer related scam** Base: Those who continued with any scam interactionQ2. For each of the interactions you experienced, please indicate which actions you took. Q8. As a result of this most recent interaction, have you lost any money? If so, how much? Q12a. To date, how much time has it taken to fix orinvestigate further as to whether your computer had been compromised after this most recent interaction? (among those who experienced a computer related scam) Q13. Thinking back across the interaction, how much stress did yousuffer? If you had multiple interactions, think how you felt about the most stressful one. The most stressful interaction caused me (among those who continued with any scam)
Consumers in India are more trusting of unsolicited contactLikelihood of future trustLikelihood of companies contacting customers ( /- vs. 2018)79%( 5)53%68%54%(-6)46%( 6)21%47%(-5)32%2018Very/Somewhat likely2021Very/Somewhat unlikelyVery/Somewhat likelyVery/Somewhat unlikelyIndiaGlobalBase: TotalQ14. In the future, if you were to receive an unsolicited call, pop up, text message, advertising or email from someone claiming to be from a reputable company offering you help, how likely would you be to trust thisresource?Q15. How likely do you think it is that a reputable company would contact customers in the ways we’ve been asking about, without first being contacted by the customer?
Consumers lost trust after being affected by fraudTrust in companies ( /- vs. 2018)Trust lost post fraud ( /- vs. 2018)91%( 10)86%( 1)73%( 7)52%( 2)Distrust30%( 2)18%16%(-1)11%(-6)Trust a lot/a littleDistrust a littleIndiaGlobal14%(-4)Distrust a lot/no trust at all9%(-1)(-10)Did not lose trustLost all/a lot/a little trustIndiaGlobalBase: Those who continued with an interactionQ13b. How much do you trust reputable software and technology companies not to sell you unnecessary support or repair services to fix new problems that are discovered on your computer?Q13c. Thinking back across the interaction(s) you’ve had, have they caused you to lose trust in reputable software and technology companies to protect you from these types of interactions?
As in 2018, Millennials, and males, are most likely to lose moneyImpact of tech scam by ageImpact of tech scam by genderBase: Those who continuedBase: Those who continuedContinued, lost moneyContinued, didn't lose moneyContinued, lost moneyContinued, didn't lose money73%58%65%49%35%28%24%27%16%16%6%2%Gen ZMillennialsGen XBoomersMaleBase: TotalQ1a. Please indicate whether you have experienced any of the following in the last year or so (January 2020 to present).Q2. For each of the interactions you experienced, please indicate which actions you took. If you experienced more than one interaction of each type, think of the most recent one you can recall.Q8. As a result of this most recent interaction, have you lost any money? If so, how much?Female
Consumers should learn about scams and be vigilant Be suspicious of unsolicited contactDo not click or call numbers on pop-up messagesOnly download official software, not modified ones from third-party sitesUse Microsoft Edge to browse the internet to block scamsTurn on antivirus protectionDo not pay in the form of cryptocurrency or gift cardsReport your experiences to Microsoft or local law enforcement
Global Tech Support ScamResearch: India
Examines the incidence and consequences of tech support scams worldwide Web based survey of 16,254 adult internet users in 16 countries worldwide ( 1,000 per country) 12 countries are consistent with 2018 Study Colombia, Finland, Netherlands, and Spain are new in 2021 Sampled consumers 18 and older, proportional to