Transcription
New Research: Human CapitalManagement Metrics andPerformanceDr. Anthony Hesketh, Associate Professor,Lancaster University Management School, UK
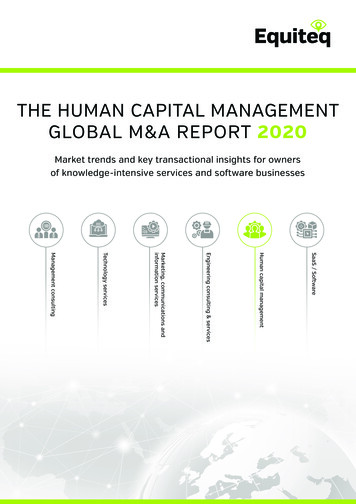
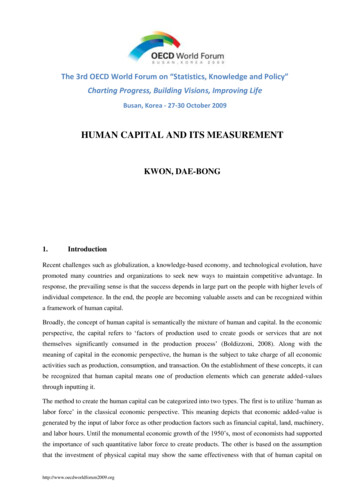
Problems on Both Sides of the EquationDependentVariabley What?y βx0 β1x1 β2x2 β3x3 . β10x10CausalExplanatoryIndependentVariablex Why?MaterialProxiesSpinningNeeds AnAnchor PointMoreProxiesFCFDCFROCEROE IR Executive CraftAcumenInter-RaterReliability1 SD of What,Exactly?Source: Hesketh (2017)
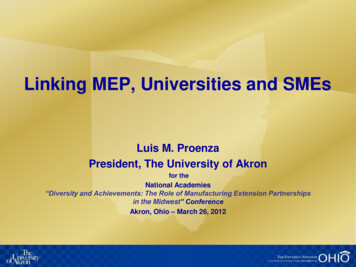
EPIC: Sprint 2 conclusion: Strategic human capital deploymentUnderlying ConceptsHuman capitaldeploymentStrategic humancapital deploymentFundamentals of humancapital deploymentHuman Capital AssetDefinitionThe ability to deploy the humancapital assetCreating a link between humancapital and overarching strategyConnecting workforce metrics backto more traditional financial metricsThe long term value of the humancapital resources owned, managedand protected by the firmExample Metrics-Employee EngagementWorkforce Cost (Salaries & Benefits)Recruitment CostTraining & DevelopmentTurnover Statistics-Effective Narrative Reporting ( IR )Convincing storiesBespoke Not Prescribed MetricsHelping investors to make ross Return On Invested Talent (ROITG)Return On Employee Engagement (ROEE)Human Capital Predictors of Profitability- Fixed Assets / Employee Costs- Total Assets / Employee Costs- Net Return On Invested Talent (ROITN)
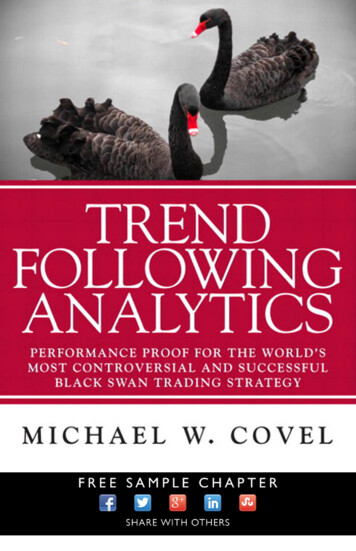
Comparison between EPIC indicators and the 2019 BillEPIC DisclosureItemsHuman capitalcostsTurnoverWorkforceCompositionTraining anddevelopmentEngagement,wellbeingand cultureN/A2019 Bill Disclosure ItemsExamples(I) Workforce compensation and incentivesSalaries, wages, bonuses and pensionbenefits of all employees(B) Workforce stability informationVoluntary/involuntary leavers andincoming employee data points(A) Workforce demographic informationFull/part time employee numbers(C) Workforce composition(D) Workforce skills and capabilitiesDiversity & inclusivity (EDI), skills,capabilities and other related data points(D) Workforce skills and capabilitiesTotal training days, type and costs(E) Workforce culture and empowermentEmployees’ attitudes to work e.g.,purpose, wellbeing and empowerment(F) Workforce health and safety(G) Human rights commitments and theirimplementationFrequency, severity, and lost-time dueto injuries, illness, and fatalitiesPrinciples used to evaluate risk,constituency consultation processes,and supplier due diligence
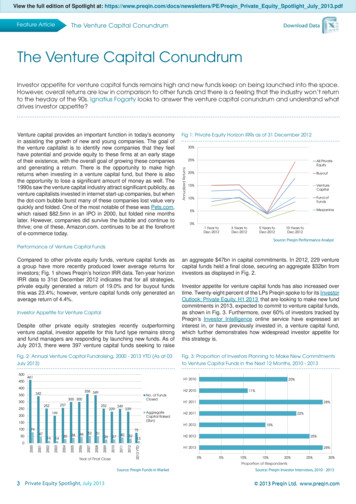
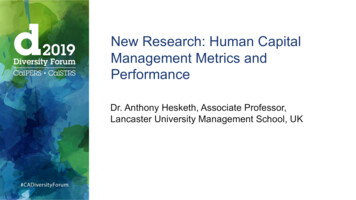
UK: HCRI signals relative employeeout-performance3.01ROITg 2016N 1001.931.711.174th Quartile3rd Quartile2nd Quartile1st QuartileThese data are compiled from HCR scores of equal weighting across all five variables and splitting firms into overall score quartiles.HCR appears to signal firms securing higher productivity from their employee base disclose more human capital related data. Thissuggests we cannot rule out human capital factors as a leading indicator of out-performance.Source: FTSE100 & firm publications, Analysis by Lancaster University Management School for EPIC5
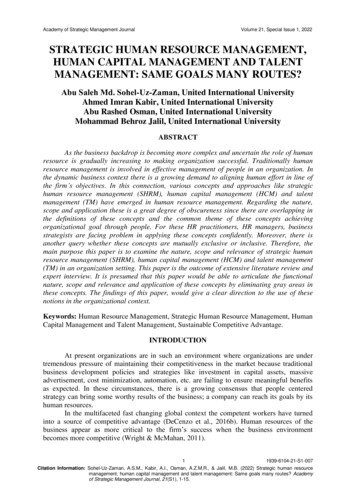
Value creation v value transfer68.5N 75/49561% return 2017DisclosingNot 1911.35ROCEReading from left to right, this chart illustrates how value creation and value transfer differ between those firms who disclose their human capital costs(n 75) and those who do not. Firms disclosing their HC costs perform strongly in value creation, whereas those firms not disclosing their costs offer theirshareholders higher rates of returns, but not significantly so. These findings are broadly repeated across the last three years (2015-17) with the patternthen breaking down pre-2015, suggesting modification in the underlying decisions made by disclosers versus non-disclosers in the last several years.Source: S&P, Compustat & firm publications, Analysis by Lancaster University Management School for EPIC6
Disclosers outperform non-disclosersYearly Average Data2017Disclosure GroupNon-Disclosure GroupMean Excess Returns (%)0.790.73Sharpe Ratio0.210.17Volatility (Std. re GroupNon-Disclosure Group2015Disclosure GroupNon-Disclosure Group2014Disclosure GroupNon-Disclosure Group2013Disclosure GroupNon-Disclosure Group2012Disclosure GroupNon-Disclosure GroupThis slide provides analysis of the performance of disclosing versus non-disclosing firms in relation to two important benchmarks with which asset managers have challengedus. First, mean excess returns captures the performance of firms relative to the risk free rate. The second, the Sharpe Ratio, helps us to understand the return of an investmentcompared to its risk and is the most widely used method for calculating the risk-free return. On both measures, the human capital disclosing firms outperform non-disclosingfirms in five and four of the six years (2012-17), respectively. Human capital disclosure is, then, financially material in the terms of the asset management’s own industry standard.Source: S&P 500, Analysis by Lancaster University Management School
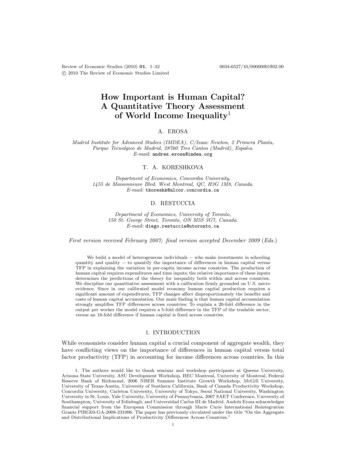
UK: The materiality of human capital400N 100Human capital costs / auditmateriality level 2016350300250200150100500More than 4/5 firms in the FTSE 100 spend more on their human capital than their formally stated and audited level of materiality.Half FTSE 100 firms exceed this materiality level by greater than a factor of 20, underlying the fiduciary requirements of greatertransparency relating to the reporting of human capital management.Source: FTSE100 & firm publications, Analysis by Lancaster University Management School8
More than 4/5 firms in the FTSE 100 spend more on their human capital than their formally stated and audited level of materia lity. Half FTSE 100 firms exceed this materiality level by greater than a factor of 20, underlying the fiduciary requirements of gr eater transparency relating to the reporting of human capital management.