Transcription
Reasons for ChronicAbsenteeism AmongFlorida SecondaryStudentsSurvey Summary ReportAmber Humm Brundage, Jose M. Castillo, & George M. Batsche7/14/2017Florida’s Problem Solving & Response to Intervention ProjectA collaborative project between the Florida Department of Education and the University of South Florida
Reasons for Chronic Absenteeism (RCA) ReportFloridaTable of ContentsContact Information .3Executive Summary .4Introduction.5Participants & Findings.7Summary of Findings .18-2-
Reasons for Chronic Absenteeism (RCA) ReportFloridaContact InformationResearchersAmber Humm Brundage, PhD, NCSPJosé Castillo, PhD, NCSPProject Co-DirectorsGeorge Batsche, EdD, NCSPJosé Castillo, PhD, NCSPFor specific staff contact information, go to .-3-
Reasons for Chronic Absenteeism (RCA) ReportFloridaExecutive SummaryThis report presents information on the results of the Reasons for Chronic Absenteeism (RCA)survey for secondary students. The data were collected directly from 4,772 chronically absent6th-12th grade Florida students from October through December, 2016. Participants wereselected based upon having missed 10% or more of instructional days during the 2015/2016school year. The students rated survey items on a 0-3 scale which represented the reasons thatthey “never”,” rarely”, “sometimes”, or “usually” missed school. The percentage of students whorated items within each category as “sometimes” or “usually” (rating of 2 or 3) the reason formissing school are calculated. The report provides information about their perceptions of howoften they miss school, common barriers to attendance experienced by secondary students, andideas for improving attendance. The information provided by the survey may be used to inform adata-based problem-solving process that includes the development of evidence-basedinterventions.FindingsPerceptions of Absences. In an effort to better understand students’ perception of their ownabsences, students were asked to provide their number of absences during the previous schoolyear. Forty-one percent (41%) of the students recalled and/or reported absences consistent withchronic absenteeism. This finding may suggest an intervention opportunity to increase studentawareness of absences and implications associated with chronic absenteeism.When students were asked about their absences in relation to peers, 58.9% of studentsperceived their absence rate to be the same or less than peers. This response may indicate askewed perception of what is considered typical absence rates and indicate an interventionopportunity for correcting misconceptions and building awareness of good attendance patterns.Reasons for Absences. Common barriers experienced by students were identified bydetermining the percentage of students who endorsed an item as “sometimes” or “usually” thereason they missed school. The top reported reasons for chronic absenteeism among studentswere related to health [92.4%] (short-term illness, chronic illness and medical/dental/mentalhealth appointments), transportation [54.8%] (missing the bus, car problems, not wanting towalk in bad weather and being out-of-town), personal stress [41.1%] (depression/sadness,stressed/upset, family emergencies), preferred activity outside of school [41.1%] (hung outwith family/friends, stayed up too late/overslept, substance use), and value of school [38.9%](perceptions that school is boring, no reason to come to school, belief that school will not helpreach future goals, perception that parents don’t care if absent from school).Ideas for Improving Attendance. The students provided ideas for supports to improveattendance by responding to open-ended prompts. Top ideas included: decreased level ofdifficulty/strictness (less homework, more fair/consistent rules, more lenient dress codes),engaging environments (more interesting/fun/relevant/hands-on classes or instruction),illness prevention (not getting sick), improved climate/relationships (nicer peers or adults,less “drama”, less bullying), and academic support (tutoring, better instruction, additional helpfrom teachers).-4-
Reasons for Chronic Absenteeism (RCA) ReportFloridaIntroductionChronic absenteeism, commonly defined as missing 10% or more of instructional days perschool year, has significant impact on student outcomes. It is associated with decreasedreading levels, overall academic performance, on-time graduation rates, and post-secondary12enrollment as well as increased dropout rates. , Fortunately, chronic absenteeism rates arealterable at the student and system level when interventions are appropriately targeted andmatched to student needs.In order to efficiently and effectively match interventions to student needs, there is a need forreliable and valid data that provide sufficient information to understand the various challengesstudents experience. The Reasons for Chronic Absenteeism (RCA) Survey was developed tomeet this need. RCA items were developed based on research and theory related tomultifaceted reasons that students miss school. The items were reviewed for clarity, relevance,and necessity by an expert panel that was comprised of national, state, district, and school levelstakeholders who have experience with dropout prevention, attendance, truancy, or schoolrefusal. Items that did not meet 70% agreement in each of the dimensions (clarity, relevance,necessity) were altered based on reviewer feedback or eliminated.After revisions, the items were then used in cognitive interviews with chronically absent middleand high school students to ensure that they perceived the items as intended. The studentsread the items aloud and verbalized their thoughts about what they thought the items wereasking and how they would respond based on their experiences. The students providedfeedback related to item language, content, clarity, and overall organization of the instrument.The items were again adjusted based on information gained during the cognitive interviews. Thefinal version of the RCA used in the validation study was comprised of 13 demographics/perception of absences questions; 41 items measuring multifaceted reasons for absences; andthree open-ended questions asking about other reasons for missing school, the reasons they docome to school, and what would help them come to school more often. The data weresummarized at the school, district, and state level.This RCA report provides information about common barriers to attendance experienced bysecondary students that may be used to inform a data-based problem-solving process thatincludes the development of evidence-based interventions. This report provides an overview ofcommon barriers experienced by students in Florida as measured by the percentage of studentswho endorsed an item as “sometimes” or “usually” the reason they missed school. The barriersare organized around the following 12 categories: 12 Health RelatedPersonal StressPhysical Safety/ConflictSchool ClimateSchool StressAdult ResponsibilitiesHousing/Material InstabilityLegal System InvolvementSuspensionTransportationPreferred Activity Outside of SchoolValue of SchoolBalfanz, R., & Byrnes, V. (2012). Chronic Absenteeism: Summarizing what we know from nationally available data.Baltimore: Johns Hopkins University Center for Social Organization of Schools.Chang, H. & Romero, M. (2008). Present, engaged and accounted for the critical importance of addressing chronicabsence in the early grades. National Center for Children in Poverty (NCCP): The Mailman School of PublicHealth at Columbia University.-5-
Reasons for Chronic Absenteeism (RCA) ReportFloridaIn addition, the report provides student perceptions of their own number of absences andabsence rates relative to peers. Also provided are student reports of perceived existingresources or motivators for school attendance and what they think would help them attendschool more regularly or miss fewer days. More detailed information for each of the categoriesand student responses within each category are included below, followed by a summary of keyfindings and questions for state-level stakeholders who are responsible for or are interested inaddressing barriers to improving chronic absenteeism rates.-6-
Reasons for Chronic Absenteeism (RCA) ReportFloridaParticipants & FindingsParticipantsThe data provided are based on 4,772 secondary school students from 10 school districts and62 middle and high schools within the state of Florida. The data were collected via studentsurveys from October through December of 2016. Districts were recruited for participationthrough a variety of means: flyers at conferences; promotion at state-wide conferences;promotion in state disseminated discretionary project newsletters; emails to district multi-tieredsystem of supports (MTSS) and positive behavior intervention and support (PBIS) contacts;emails via national listservs for PBIS, MTSS, and attendance; webinars for regional state-levelMTSS professional learning communities; and a webinar for a national state-level attendanceassociation.Participant districts selected which schools would participate in the survey. The researchersprovided a one-hour webinar for each participant district/school that provided backgroundinformation on chronic absenteeism, survey development, administration procedures, andreview of the survey items and data collection platform (SurveyMonkey ). Schools identifiedeligible students for participation (i.e., students with at least 18 absences during the previousschool year) and facilitated the collection of survey data.The participant districts were representative of the range of districts throughout the state fromsmall to very large. The average chronic absenteeism rate among the participant districts(based on the rates from the participant schools) ranged from 5.6% to 32.8%, and the numberof reportedly chronic absent students per participant school ranged from 22 to 593. Theparticipant districts survey completion rates varied from a low of 23.9% to a high of 83.7%. Theparticipant school survey completion rates were a bit more disparate with a low of 6% and ahigh of 100% for several schools who surveyed all of their reported chronically absent students.The table below provides a summary of the participant district chronic absenteeism and surveycompletion rates.Table 1Participant District SummaryParticipantDistrictDistrict SizeDesignationDistrict 1District 2District 3District 4District 5District 6District 7District 8District 9District 10SmallSmall/ MediumSmallVery mVery LargeNumber ofParticipantSchoolsAverage ofReportedChronicAbsenteeismRate 2%28.9%18.3%5.6%21.9%13.4%24.0%-7-Range of theNumber ofChronicallyAbsentStudents 4338-33597-213187-378AveragePercentage .6%52.8%75.8%44.0%46.5%50.5%83.7%45.3%23.9%Range of theReportedChronicallyAbsentStudentsSurveyed %51-100%27-64%7-45%
Reasons for Chronic Absenteeism (RCA) ReportFloridaTable 2 provides an overview of the participant student demographics.Table 2Participant Student Summary DemographicsSelected DemographicsFree/Reduced Lunch EligibleReceive Exceptional Student EducationEnglish Not Primary LanguageMother’s Education- High School or GEDMother’s Education- College alAsianBlack/African AmericanHispanic/LatinoWhiteAmerican IndianNative Hawaiian/Pacific IslanderPrefer not to 0.22.917.318.019.213.012.99.89.8The majority of students who participated in the survey were eligible for free or reduced pricelunch and reported their mother’s education level to be “some high school”, “high schooldiploma”, or “GED”. There were slightly higher than the state average of students withdisabilities (13%) who participated in the survey. These data are consistent with researchindicating that students with disabilities and those from economically disadvantaged householdsare often over-represented within the chronically absent student population.There was a fairly equal distribution of males versus females with 1% identifying as Other(transitioning, transgendered, etc.). Roughly half of the survey participants identified as Whiteand the majority reported being in middle grades.-8-
Reasons for Chronic Absenteeism (RCA) ReportFloridaFindingsTable 3 below provides an overview of the percentage of all students who rated items in eachcategory as “sometimes” or “usually” the reason(s) they missed school. Health Related reasons(92.4% endorsed an item within this domain as “sometimes” or “usually” the reason they missedschool) were the most commonly reported, followed by Transportation (54.8%), Personal Stress(41.1%), and Preferred Activity Outside of School (41.1%). On the following pages, moredetailed information is provided for each of the categories.Table 3Percentage of Endorsements by CategoryOverall ResponsesReasonPercentageHealth Related92.4Transportation54.8Personal Stress41.1Preferred Activity Outside of School41.1Value of School38.9School Stress34.6School Climate32.6Safety/Conflict21.1Adult Responsibility17.3Legal System Involvement15.6Housing/Material Instability14.1Suspension10.4Perceptions of AbsencesIn order to be eligible to participate in the survey, students had to have missed 18 or more(10%) days of school during the 2015/2016 school year. Table 4 provides a summary of studentperceptions of the number of school days they missed during the 2015/2016 school year.Approximately 41% of students accurately recalled and/or reported absences consistent withchronic absenteeism. This finding may suggest an intervention opportunity to increase studentawareness of absences and implications associated with chronic absenteeism.Table 4Absences Last YearReported Number of AbsencesLast Year0-5 daysPercentage14.66-10 days22.211-15 days22.316-20 days17.421 days23.4-9-
Reasons for Chronic Absenteeism (RCA) ReportFloridaStudents were asked to report on their perceived number of absences within the last month.This statistic may be an indicator of students who are on-pace to be chronically absent during agiven year. As few as two absences per month can lead to 18 or more days of school missedper year. Approximately 67% of students reported two or more absences in the previous monthindicating they may have had an increased likelihood of chronic absenteeism during the schoolyear in which they were surveyed.Table 5Absences Last MonthReported Number of AbsencesLast Month0-1 daysPercentage32.72-3 days41.64 days25.6In an attempt to better understand student perceptions about the frequency of their absences,students were asked to report if they perceived they had the same, fewer, or greater number ofabsences relative to other students. Over one-half of students (58.9%) perceived their absencerate to be the same or less than peers. This rate may indicate a skewed perception of what isconsidered typical absence rates and indicate an intervention opportunity for correctingmisconceptions and building awareness of good attendance patterns.Table 6Absences Compared to OthersAbsence Rate Compared toPeersPercentageAbsence Rate Less than PeersAbsence Rate the Same asPeers26.5Absence Rate More than Peers41.132.4Resources/MotivatorsTo better understand student perceptions of resources or motivators for school attendance,students were asked to identify the reasons that they do come to school. The student responseswere then organized into themes, and each instance in which a theme was mentioned wascalculated and aggregated. Table 7 provides the top reported reasons for school attendancewhich were Value of Education (Desire to learn, future goals, to get an education), followed byPeer Relationships. It is interesting to note that despite the survey participants having beenidentified as chronically absent in the previous school year, many recognized that school is ameans to achieve future goals and necessary for obtaining a foundational education. Thisfinding may reflect a lack of understanding of the impact of chronic absenteeism on educationaloutcomes (course performance, graduation and/or dropout rates, etc.).- 10 -
Reasons for Chronic Absenteeism (RCA) ReportFloridaTable 7Reasons for School AttendanceTop 5 ResponsesMotivatorValue of Education (Desire to learn, future goals, toget an education)Peer RelationshipsInstancesMentioned25561605School Activities (Clubs, sports, extra-curricularactivities)Required- Unspecified (I have to)590Parent Support (Parent expectation/support forattendance)140148SupportsStudents were asked to provide ideas for what they thought would help them attend schoolmore regularly. Table 8 indicates that the top reported support to improve attendance was toaddress the Level of Difficulty/Strictness (less homework, more fair rules, lenient dress code),which was closely followed by creating an Engaging Environment (more interesting/funinstruction or classes, more hands-on activities).Table 8Supports to Improve AttendanceTop 5 ResponsesSupportsLevel of Difficulty/ Strictness (Lesshomework, more fair rules, lenient dresscode)Engaging Environment (More interesting/ funinstruction or classes, more hands-on)Illness Prevention (If I didn’t get sick)Improved Climate/Relationships (Nicerpeers/adults, less drama, less bullying)Academic Support (Tutoring, better teachers,help from teachers)InstancesMentioned437407358333241- 11 -
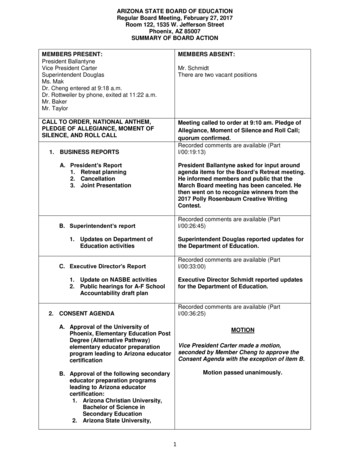
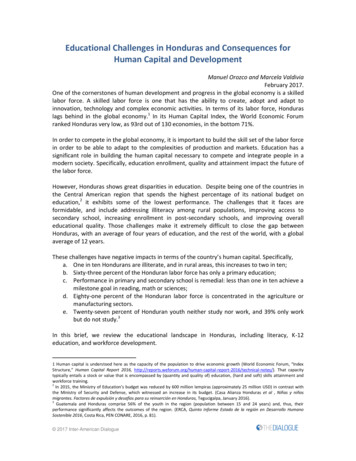
Reasons for Chronic Absenteeism (RCA) ReportFloridaResponse by CategoryHealth RelatedPersonal StressHealth Related barriers were reported by92.4% of the chronically absent students tobe the reasons they missed school“sometimes” or “usually”. Health Relatedbarriers were the most frequently reportedreasons for students missing school amongall the categories. Items within the healthrelated category measured short-term (cold,flu, etc.) and chronic illnesses (asthma,allergies, disease), medical appointmentsand the perception of becoming or gettingsick while at school.Personal Stress was reported as“sometimes” or “usually” the reason formissing school by 41.1% of the chronicallyabsent students. Personal Stress includeditems that measured perceived levels ofstress; depression or sadness; being too“upset” to attend school; or familyemergencies that may include death,illness, injury, or “drama”.Within grade levels, 6th, 7th, and 8th gradestudents reported missing school forpersonal stress related reasons to a slightlygreater extent than did students from othergrade-levels. Among student subgroups,students who identify as Female, those whoidentify as White, and those who qualify forfree or reduced price lunch reported missingschool due to personal stress most often.Within grade levels, 6th, 7th, and 8th gradestudents reported missing school for healthrelated reasons to a slightly greater extentthan did students from other grade-levels.Among student groups, students whoidentify as White, and those who qualify forfree or reduced price lunch, reported healthrelated reasons for missing school mostoften.Figure 2Personal StressFigure 1Health Related- 12 -
Reasons for Chronic Absenteeism (RCA) ReportFloridaPhysical Safety/ConflictSchool ClimatePhysical Safety/Conflict reasons wereendorsed by 21.1% of students overall.Items in the Physical Safety/Conflictcategory measured student perceptions ofsafety on the bus ride or walk to/fromschool, safety while at school,teasing/bullying, or avoidance of otherstudents due to conflict.School Climate barriers were reported as“sometimes” or “usually” the reasons formissing school by 32.6% of the chronicallyabsent students. School Climate includeditems that measured student perceptions ofthe physical environment of the school(condition, cleanliness, basic supplies) aswell as the affective environment (perceivedfairness of rules/discipline practices,kindness of others, recognition of absencesby others).Within grade levels, 6th, 7th, and 8th gradestudents reported missing school forphysical safety/conflict related reasons to aslightly greater extent than did studentsfrom other grade-levels. Among studentsubgroups, students who identify asFemale, those who identify as Black/AfricanAmerican or White, those who receivespecial education, and those who qualify forfree or reduced price lunch reported missingschool due to physical safety/conflict mostoften.Figure 3Within grade levels, 6th, 7th, and 8th gradestudents reported missing school for schoolclimate related reasons to a slightly greaterextent than did students from other gradelevels. Among student subgroups, studentswho identify as Hispanic/Latino,Black/African American, or White; thosewho receive special education, and thosewho qualify for free or reduced price lunchreported missing school due to schoolclimate most often.Physical Safety/ConflictFigure 4School Climate- 13 -
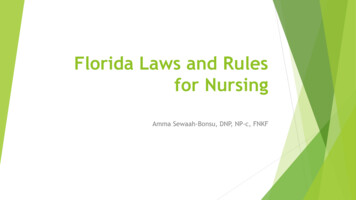
Reasons for Chronic Absenteeism (RCA) ReportFloridaSchool StressAdult ResponsibilitiesSchool Stress reasons were endorsed by34.6% of students overall. Items in theSchool Stress category measured theperception of the level of difficulty in schoolwork, lack of preparedness for a class, andavoidance of a teacher or class.Adult Responsibilities were reported as“sometimes” or “usually” the reasons formissing school by 17.3% of the chronicallyabsent students. Adult Responsibilitiesincluded items that measured having towork, care for another family member, orhelp a family member.Within grade levels, 8th grade studentsreported missing school for school stressrelated reasons to a slightly greater extentthan did students from other grade-levels.Among student subgroups, students whoidentify as Hispanic/Latino or White, thosewho receive special education, and thosewho qualify for free or reduced price lunchreported missing school due to schoolstress most often.Figure 5Within grade levels, 6th and 8th gradestudents reported missing school for adultresponsibility related reasons to a slightlygreater extent than did students from othergrade-levels. Among student subgroups,students who identify as Male,Hispanic/Latino, Black/African American, orWhite; those who receive special education;and those who qualify for free or reducedprice lunch reported missing school due toadult responsibilities most often.School StressFigure 6Adult Responsibility- 14 -
Reasons for Chronic Absenteeism (RCA) ReportFloridaHousing/Material InstabilityLegal System InvolvementHousing/Material Instability was reported as“sometimes” or “usually” the reasons formissing school by 14.1% of the chronicallyabsent students. Housing/Material Instabilityincluded items that measured lack of cleanor appropriate clothing or materials forschool, mobility, lack of housing orhousehold utilities.Legal System Involvement reasons wereendorsed by 15.6% of students overall.Items in the Legal System Involvementcategory measured incarceration (juvenileor adult facilities) and missing school due tocourt attendance.Within grade levels, 6th, 7th, and 8th gradestudents reported missing school for legalsystem involvement related reasons to aslightly greater extent than did studentsfrom other grade-levels. Among studentsubgroups, students who identify as Male,those who identify as Hispanic/Latino orWhite, those who receive special education,and those who qualify for free or reducedprice lunch reported missing school due tolegal system involvement most often.Within grade levels, 6th, 7th, and 8th gradestudents reported missing school forhousing/material instability related reasonsto a slightly greater extent than did studentsfrom other grade-levels. Among studentsubgroups, students who identify asHispanic/Latino, Black/African American, orWhite; those who receive special education;and those who qualify for free or reducedprice lunch reported missing school due tohousing/material instability most often.Figure 8Legal System InvolvementFigure 7Housing/Material Instability- 15 -
Reasons for Chronic Absenteeism (RCA) ReportFloridaSuspensionTransportationSuspensions were reported by 10.4% of thechronically absent students to be thereasons they missed school “sometimes” or“usually.” One item made up this category(student absences due to suspensions).Transportation reasons were endorsed by54.8% of students overall. Items in theTransportation category measured carproblems, bus problems (late, missed, didnot come), not wanting to walk in badweather, or being out of town.Within grade levels, 7th and 8th gradestudents reported missing school due tosuspension to a slightly greater extent thandid students from other grade-levels.Among student subgroups, students whoidentify as Male, those who identify asBlack/African American or White, those whoreceive special education, and those whoqualify for free or reduced price lunchreported missing school due to suspensionsmost often.Within grade levels, 6th, 7th, and 8th gradestudents reported missing school fortransportation reasons to a slightly greaterextent than did students from other gradelevels. Among student subgroups, studentswho arrive to school by bus, those whoidentify as White, and those who qualify forfree or reduced price lunch, reportedmissing school due to transportation mostoften.Figure 9Figure 10SuspensionTransportation- 16 -
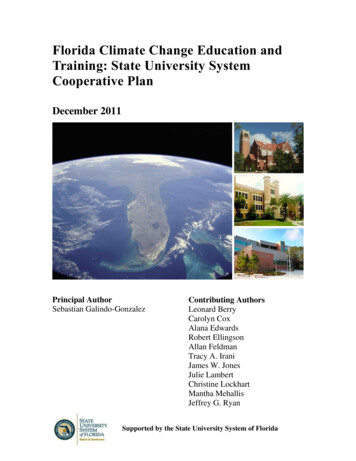
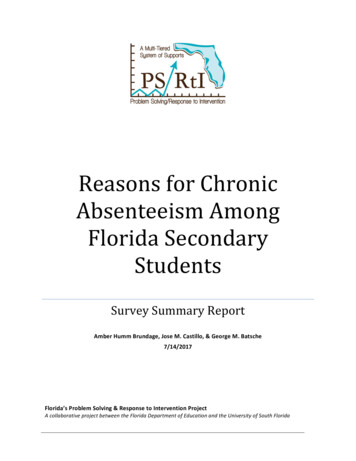
Reasons for Chronic Absenteeism (RCA) ReportFloridaPreferred Activity Outside of SchoolValue of SchoolPreferred Activity Outside of School wasreported as “sometimes” or “usually” thereason for missing school by 41.1% of thechronically absent students. PreferredActivity Outside of School included itemsthat measured hanging out withfamily/friends instead of attending school,staying up too late to get up for school,oversleeping, and substance use.Value of School was reported as“sometimes” or “usually” the reasons formissing school by 38.9% of the chronicallyabsent students. Value of School includeditems that measured student perceptionsthat school is boring, their parents don’tcare if they miss school, school will not helpthem reach future goals, and a generalbelief that there is no reason to attendschool.Within grade levels, 7th and 8th gradestudents reported missing school forpreferred activity outside of school reasonsto a slightly greater extent than did studentsfrom other grade-levels. Among studentsubgroups, students who identify as White,those who receive special education, andthose who qualify for free or reduced pricelunch reported missing school due topreferred activity outside of school mostoften.Within grade levels, 8th grade studentsreported missing school more often forvalue of school reasons than did studentsfrom other grade-levels. Among studentsubgroups, students who identify as Male,those who identify as White, those whoreceive special education, and those whoqualify for free or reduced price lunchreported missing school due to value ofschool most often.Figure 11Figure 12Preferred Activity Outside of SchoolValue of School- 17 -
Reasons for Chronic Absenteeism (RCA) ReportFloridaSummary of FindingsThis report includes data on reasons for chronic absenteeism provided by over 4,500 chronicallyabsent students in Florida. Below is a summary of the major findings from the survey followedby questions for state-level stakeholders to consider. Specifically, questions regarding thestate’s role in supporting districts and schools to address students’ perceptions of chronicabsenteeism and to address barriers to students attending school consistently are provided.One of the most basic strategies to begin to address concerning behaviors is to build generalawareness of the behavior and the extent to which it deviates from standard levels ofacceptability. Based on the responses to the items measuring perceptions of absences, itappears that students may be largely unaware of their own rate of absenteeism over time andmisperceive what typical or acceptable rates of absenteeism are among secondary students.Question: What is the state’s role in supporting districts and schools in consistently defining day of schooling? consistently defining an absence? consistently defining chronic absenteeism? building awareness of absenteeism rates among students? building awareness or correcting misperceptions of what constitutes typical or acceptablerates of absenteeism among students?The top reported reasons for chronic absenteeism among students were related to health(short-term illness, chronic illness, medical/dental/mental health appointments), transportation(missing the bus, car problems, not wanting to walk in bad weather, being out-of-town),personal stress (depression/sadness, stressed/upset, family emergencies), preferred activityoutside of school (hung-out with family/friends, stayed-up too late/overslept, substance use),and value of school (perceptions that school is boring, no reason to come to school, belief thatschool will not help reach future goals, perception that parents don’t care if absent from school).The students provided ideas for supports to improve attendance that included decreased levelof difficulty/strictness (less homework, more fair/consistent rules, more lenient dress code
Reasonsfor Chronic AbsenteeismAmong Florida Secondary Students Survey Summary Report AmberHummBrundage, Jose M. Castillo, & GeorgeM. Batsche 7/14/2017 Florida'sProblem Solving & Response to InterventionProject A collaborative project between the Florida Departmentof Education and the University of South Florida