Transcription
Scientia Iranica D (2019) 26(6), 3582{3591Sharif University of TechnologyScientia IranicaTransactions D: Computer Science & Engineering and Electrical d PaperEvaluation of online techniques utilized for extractingthe transformer transfer functionF. Nasirpour, M.H. Samimi , and H. MohseniSchool of Electrical and Computer Engineering, University College of Engineering, University of Tehran, North Kargar St., Tehran,P.O. Box 14395-515, Iran.Received 27 June 2019; accepted 8 September 2019KEYWORDSFault diagnosis;Fourier transform;Frequency responseanalysis;Online diagnosis;Power transformermonitoring;Transfer function;Wavelet transform.Abstract. Power transformers are of vital importance in power delivery and, therefore,di erent diagnostic techniques have been proposed for them. The Frequency ResponseAnalysis (FRA) is an e ective method that detects mechanical changes in transformerwindings by extracting the transfer function. There are various approaches to obtainingthe transfer function online, which is known as the online FRA technique. This papercompares these di erent mathematical approaches for obtaining the transfer function ofa transformer. A comparison is carried out by de ning an appropriate model for thetransformer and applying these mathematical methods to it. The e ect of other powernetwork equipment on the transformer transfer function is also studied in this paper. Theresults of this contribution determine proper methods for the online FRA technique, whichcan be used in the transformer monitoring applications. 2019 Sharif University of Technology. All rights reserved.1. IntroductionPower transformers are considered one of the most important equipment in the power system. They operatein various climates and are subject to di erent types ofmechanical and electrical stresses. Hence, transformerscan always encounter faults [1]. The power system mayface outage problems that can result in a considerablecostly impact on utilities if transformer faults arenot detected in the early stage [2]. Therefore, it isvital to continuously evaluate transformers' conditionsin order to diagnose problems that may occur. Forthis purpose, many di erent mechanical, electrical,*. Corresponding author. Tel.: 98 21 88011247;Fax: 98 21 88027766E-mail addresses: Farzad.nasirpour@ut.ac.ir (F.Nasirpour); m.h.samimi@ut.ac.ir (M.H. Samimi);mohseni@ut.ac.ir (H. Mohseni)doi: 10.24200/sci.2019.53890.3473chemical, and optical methods have been introducedand employed [3,4].Winding deformation, turn-to-turn short circuit,and insulation degradation are some types of transformer faults. One of the widely used techniques fordetecting these faults is the Frequency Response Analysis (FRA), which consists of obtaining and analyzingthe transfer function of the transformer in the desiredbandwidth [5].The FRA technique is mainly applied in the o inemode, in which the transformer should be taken outof service. According to the nature of the excitationsignal, two measurement methods can be distinguishedin the o ine FRA technique: the Impulse FrequencyResponse Analysis (IFRA) and the Sweep FrequencyResponse Analysis (SFRA) [5,6]. In the IFRA, a lowvoltage impulse is applied to the winding as the excitation, and the transformer response is measured in thetime domain. The input current, output voltage, andneutral current can be considered as the transformer
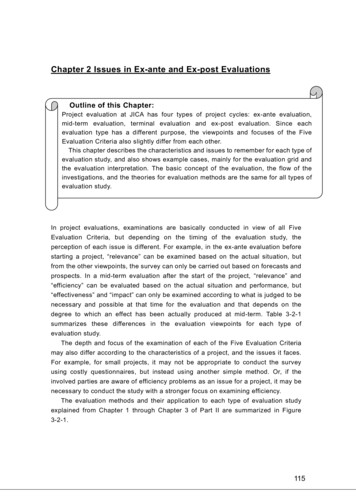
F. Nasirpour et al./Scientia Iranica, Transactions D: Computer Science & . 26 (2019) 3582{3591response in the IFRA method. On the other hand, asinusoidal signal with a xed amplitude and varyingfrequencies is applied to the transformer in the SFRAtechnique, and the response is measured directly in thefrequency domain. In this case, the transfer functionis usually the ratio of the output voltage to the inputvoltage. A typical range of frequency sweeps is from20 Hz to 2 MHz [7].The main drawback of the o ine FRA techniqueis that the transformer has to be taken out of service,which may interrupt the energy delivery in the powernetwork [8]. Furthermore, the external factors a ectingthe FRA can be di erent in two consecutive measurements since the interval between two measurements isseveral months or years. For instance, the possibletemperature variation between di erent measurementscan have a signi cant impact on the captured FRAtrace [9]. The interval between consecutive tests alsomay cause changes in the transfer function because ofthe variation of the paper humidity. These unwantederrors and uncertainties yield sometimes in misunderstanding the transformer condition. By employing theonline FRA technique, the aforementioned errors aredismissed since the FRA is captured more frequently,and the interval between measurements is signi cantlyshortened.Capturing the online FRA enjoys other bene ts,too. By applying this method, there is no needto take the transformer out of service, which savescosts and time and is in accordance with the newrequirements of the power system [10,11]. Moreover,the transformer is evaluated in shorter time frames,i.e., the transformer is monitored more appropriately.In the online FRA technique, the excitation signalcan be power system transients caused by lightningand switching operations or a pulse that is manuallyinjected to the transformer [12].The assessment of the transformer condition bythe FRA technique has been widely studied in thelast decade. Various methods of transformer evaluation compared to FRA technique and also di erentmathematical approaches for obtaining the transferfunction have been studied in the literature [1,5,13,14].To implement the FRA by the injection of excitationsignals, several practical methods and related issueswere presented in the referenced studies [7,15-17]. Anumber of authors conducted further studies on faulttype classi cation, the FRA sensitivity, and temperature dependency of the FRA [18-20]. Gomez-Luna etal. presented a review of the current status and futuretrends of the online FRA technique [6].Regardless of previous studies, there is no recordof comparing the di erent methods for obtaining theonline transfer function of the transformer. In otherwords, it is not yet speci ed which mathematicalmethod can extract the online FRA trace of the3583transformer more appropriately. The focus of thecurrent contribution in this study is to compare thesemethods and determine a proper mathematical tool forthe online FRA.In this paper, di erent methods presented in theliterature for obtaining the online transfer functionof transformer winding are compared, and the bestmethod is identi ed. For this purpose, the transferfunction obtained by the SFRA method is consideredas the reference. The method that results in a tracemore analogous to the SFRA trace is a better one.In addition to this comparison, the e ect of otherpower network apparatuses on the transformer transferfunction is studied. Accordingly, an attempt is madehere to nd out if the other existing equipment a ectsthe captured trace of a transformer.The rest of this paper is organized as follows. Section 2 discusses the mathematical approaches brie y.Section 3 describes the details of modeling a transformer winding for the purpose of investigating di erent online methods. Afterward, di erent methods fordetermining an online frequency response are studied inSection 4, and the corresponding results are presented.In Sections 5, the e ect of power network equipmenton an online transfer function is investigated. Theconclusion is nally given in Section 6.2. Theoretical backgroundThe online FRA technique is based on measuringthe transfer function of the transformer winding. Asmentioned before, di erent currents and voltages canbe considered as the transformer transfer function.The rst step for obtaining the transfer function is tomeasure these signals in a wide frequency range. Forthis purpose, a high-frequency signal can be appliedto the transformer winding, and the correspondingresponse signal is measured in the time domain. Thehigh-frequency signal can be a power system transient,e.g., lightning and switching phenomena.Figure 1 shows a basic method for online transferfunction measurement using network transients as theexcitation signal. As can be seen, a transient signalreaches the transformer winding through the connectedtransmission lines. Upon receiving the signal, the signalitself and a response signal are measured by sensorsand, then, processed by the signal processing unit. Themethod described in Figure 1 measures the input andoutput voltages using two metal foil pieces insertednear the bushing ange. These metal foil pieces actas a capacitive sensor for measuring the voltage signal.Similarly, by employing a high-frequency current transformer on the neutral lead, the neutral current can becaptured as the response signal.After measuring any of the described signals inthe time domain, these signals are transferred to the
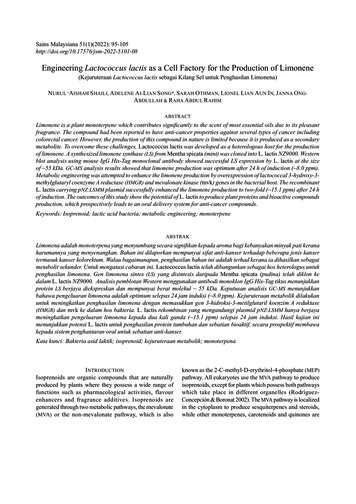
3584F. Nasirpour et al./Scientia Iranica, Transactions D: Computer Science & . 26 (2019) 3582{3591Figure 1. The basic circuit for measuring the online FRA.frequency domain by utilizing mathematical methods.Di erent mathematical methods such as Fast FourierTransform (FFT), Short Time Fourier Transform(STFT), and wavelet transform are used for achievingthis goal in the literature [3,9,10]. In the followingsubsections, the basics of each method are discussedbrie y. In the nal stage, the signals transferred tothe frequency domain are divided by each other togather the intended transfer function.2.1. Fast Fourier Transform (FFT)The FFT is an algorithm for computing the DiscreteFourier Transform (DFT). The DFT is de ned asfollows [15]:Xk NX1n 0x[n] e( i2 kn N ) k 0; ::::::; N1; (1)where x[n] is the discrete input signal, N is the totalnumber of samples, and k is the desired frequency.After measuring the signals in the time domain,the FFT of the excitation and the response signals aremeasured through Eq. (1):Vin (f ) F F T (vin (t));(2)Vout (f ) F F T (vout (t));(3)where vin and vout are the discrete signals in the timedomain, and Vin and Vout are the signals transferredto the frequency domain. The transfer function hascomplex values; however, the evaluation of frequencyresponse is usually performed on its magnitude. Inthis paper, the transfer function is de ned similarly asthe ratio of the response magnitude to the excitationmagnitude as follows: jVout (f )j ;(4)T FIF RA 20 logjVin (f )jwhere T F is the transfer function. The transferfunction is normally displayed in a log-log plot.2.2. Short Time Fourier Transform (STFT)The discrete STFT of function x[n] is expressed as inthe following equation [13]:STFTfx[n]g (m; !) X (m; !) 1Xj!n ;(5)1where ![m] is the window function that is nonzero foronly a short period of time. In the STFT method, thewindow function divides the signal into equal, shortersegments and, then, the Fourier transform of eachsegment is computed. The length of each segmentequals that of the window function. The Blackmanwindow function, as shown in Figure 2, is used in thispaper for dividing the input signal. It is noteworthythat the Blackman function is one of the most usedwindow functions in the STFT method.STFT transfers a signal from the time domainto the time-frequency domain; however, in order toobtain the transfer function, frequency domain data arerequired. Here, the transfer function is de ned as in Eq.(6), which provides the frequency domain informationof the signal.n Figure 2. Blackman window.x[n] ! [n m] e
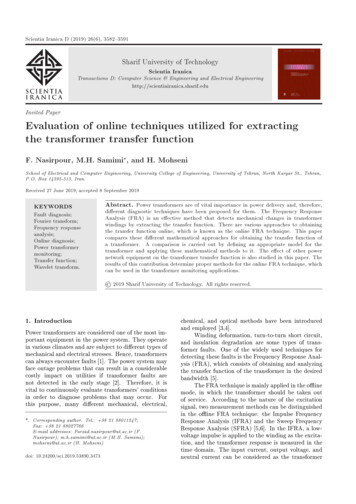
F. Nasirpour et al./Scientia Iranica, Transactions D: Computer Science & . 26 (2019) 3582{35911P1PVout [n] ! [n m] e j!n1n 1T FIF RA P;11PVin [n] ! [n m] e j!n (6)m 1 n 1where Vout and Vin are STFT of the response andexcitation signals, respectively.m 2.3. Wavelet transformThe continuous wavelet transform of function x(t) isde ned as follows [5]:Z11t bX (a; b) 1 2(7)jaj 1 x(t) ( a ) dt;where a is the scale, b is the translational value, andis the mother wavelet. In this paper, Morlet is usedas the mother wavelet. Unlike the STFT, the windowfunction has variable lengths in the wavelet transform,which is de ned by the parameter a.The wavelet transform also transfers signals fromthe time domain to the time-scale domain. Therefore,Eq. (8) should be used to obtain information in thescale domain.F (a) vuPu (CV out ( ; a))2uu;tP(CV in ( ; a))2(8)Figure 3, consists of R, L, C , and M that representthe electrical characteristics of the unit. The windingunit can be a disk, two disks or several turns. Thismodel is valid for the frequency range of a few kHz upto approximately 1 MHz [21].The elements of this model can be calculated byanalytical formulas [21]. In this paper, an HV windingwith 60 discs, 11 turns in each disk with a 20-turn helical LV winding, and 12 parallel conductors in each turnis modeled. Each disk of the HV winding is consideredas an HV winding unit. Similarly, each LV windingturn is considered as the LV winding unit. Figure 4shows the windings diagram and the correspondingFigure 3. The detailed model of transformer windingsbased on mutual inductance.where CV out and CV in are the continuous wavelettransforms of the response and the excitation signals,respectively. There must be a relationship betweenthe scale and frequency so that one can express thefrequency domain information of the signal from thescale domain. Although there is no exact relationbetween these two, the following approximation can beapplied [5]:fc;(9)a: where fc is the center frequency of a wavelet in Hz, and is the sampling period. Consequently, the transferfunction can be obtained through Eqs. (8) and (9).fa 3. Modeling the transformer windingsIn the previous section, the details of the three mathematical methods for obtaining the online transfer function have been described. In order to examine thesemethods, a winding with the known transfer function isrequired. In this contribution, a high-frequency modelof the winding is considered as the test case. Allmethods with regard to this model are examined whosedetails are described in this section [21].In the utilized model, the winding is divided intoseveral winding units, where each unit, as shown in3585Figure 4. The diagram of the modeled winding. Thedimensions are in cm.
3586F. Nasirpour et al./Scientia Iranica, Transactions D: Computer Science & . 26 (2019) 3582{3591dimensions needed for calculating the model parameters. All of the elements depend on the geometricaldimensions of winding units and transformer; thus, anychange in the geometrical dimensions in uences thevalues of these elements and, therefore, the frequencyresponse changes. In the following paragraphs, thecalculation of these parameters is brie y explained: Self and mutual inductance: Maxwell's equationscan be solved to calculate the self and mutualinductances between the winding units. The mutualinductance between two loops shown in Figure 5 canbe calculated using Eq. (10):I I 0d s1 :d s2M12 ;(10)4 R12C1 C2where 0 is the permittivity of the vacuum, and therest of the parameters are depicted in Figure 5. Thisequation can be rewritten as follows:ZZ 0 2 2 r1 ( 1 ):r2 ( 2 ): cos( 21)M12 :4 0 0R12 ( 1 ; 2 )d 1: d 2:(11)For un-deformed turns, the analysis of Eq. (11)results in the closed Eq. (12):p2 r rM12 0p 01 2 : [K (k0 ) E (k0 )];(12)kwhere:Figure 6. Parameter de nition of one-single turn [21].ps21p1 k2 ; k (r 4rr1)r22 d2 :k0 1 1 k12(13)K (k0 ) and E (k0 ) are the complete elliptic integralsof the rst and second kinds, respectively.For an un-deformed turn, shown in Figure 6,self-inductance can be calculated using Eq. (14): 8RLi 0 R ln2 ;(14)GMDwhere:GMD2ba2abln p 2 2 tan 1 tan 13ab3baa b a2b2ln 1 2212aba2b225ln 1 2: (15)212ba12The parameters of the single turn needed for calculating Eq. (15) are illustrated in Figure 6; Capacitance: Cig and Cjg represent the capacitancebetween the individual winding unit and the earth,which can be the transformer tank or the core. Cijrepresents the capacitance between two windings(HV and LV). These capacitances can be calculatedbased on the homogenous distribution of the electriceld.Ci and Cj represent the energy stored betweenthe turns of the winding unit and can be calculatedsimilar to Cig , assuming that there is a linear voltagedistribution along with the winding unit [21]. Resistance: Rig , Rjg , Ri , Rj , and Rij representthe dielectric losses of the dielectric system betweenwinding units and also between windings and thetank. All of the resistances are frequency dependentsince the dielectric loss changes with frequency.Compared to dielectric resistances, the conductorresistance has insigni cant e ect on damping mechanisms and, thus, is ignored for the sake of simplicity.4. Comparing the mathematical methodsFigure 5. Two parallel conducting loops [21].In this section, the mathematical methods are compared with each other. The winding model described
F. Nasirpour et al./Scientia Iranica, Transactions D: Computer Science & . 26 (2019) 3582{35913587in Section 3 is utilized as the test object for examiningthe methods.4.1. Examining the mathematical methods inthe o ine modeIn the rst step, the methods are investigated in theo ine mode. For this purpose, a pulse according toEq. (16) is injected into the transformer HV winding,and the input current is measured as the response.Figure 7 shows these signals in the time domain forthe modeled winding. As can be seen, the excitationsignal is very short in the time frame; however, theresponse signal continues to oscillate in a wider timeframe. The sampling frequency is 10 MHz and thesampling duration should be greater than 10 ms. Afterrecording these traces, the aforementioned mathematical methods are applied to both signals to obtain thefrequency response.Vpulse (t) 10 e18:4207 ( t 5 10 6 )210 5:(16)In order to determine the best method, the transferfunction obtained from the SFRA method is considered as the reference. In other words, all obtainedtransfer functions are compared with the SFRA, andthe method that results in the trace most analogousto the SFRA trace is chosen as the proper method. Asimilar approach is carried out in the online mode, too.For capturing the SFRA trace of the winding,a procedure similar to the experimental setup is employed. A sinusoidal voltage source is used as anexcitation signal. The frequency of this signal is sweptin the frequency range of 10 kHz to 1.5 MHz whilethe amplitude is kept constant equal to 1 V. In eachfrequency point, the excitation and response signalare measured in the time domain. The input signalhas a single frequency. The response signal is alsoltered based on the same frequency and, therefore, twosinusoidal signals with the same frequency are derived.Figure 8. Comparison of the o ine transfer functiontrace captured by di erent methods and the SFRA trace.The transfer function is then obtained by dividing themagnitude of the response signal by the magnitudeof the excitation signal at each point. In this case,the input current of the HV winding is considered asthe response because the same signal is employed forexamining the mathematical methods.Figure 8 shows the frequency response traces obtained using FFT, STFT, and the wavelet transform incomparison with the SFRA method. As can be inferredfrom Figure 8, except for the wavelet transform, theother two methods are in complete agreement with theSFRA trace. Therefore, it can be concluded that thewavelet is not a suitable method since it does not give agood answer even in the o ine mode, where the 50 Hzsignal is missing. Nevertheless, all three methods areexamined in the online mode in the next section.4.2. Examining the mathematical methods inthe online modeFor this assessment, the transformer is connected to the50 Hz ac voltage. The transient pulse mentioned in theprevious section is then superimposed onto it. Therefore, the measured signals have both a considerablemagnitude in the 50 Hz and high-frequency contents.It is possible to perform the methods directly on themeasured signal. The other way is to lter the 50 Hzsignal rst and, then, apply the mathematical methods.In order to eliminate the 50 Hz frequency component, a typical Butterworth high-pass lter of the2nd order can be used. This lter can be implementeddigitally. The transfer function of the utilized lter inthe Laplace domain is as follows:H (s) 0:992Figure 7. The excitation and the response signals of themodeled winding. The excitation signal is a voltageimpulse, and the response signal is the input current. s2s22s 11:9s 0:99 2:(17)It is noteworthy that the 3 dB cut-o frequency ofthis lter equals 100 Hz and, therefore, the lterdoes not in uence the higher frequency content of thesignal. Accordingly, the lter does not change thephase information of the response in case that the phaseresponse is also required for the interpretation.
3588F. Nasirpour et al./Scientia Iranica, Transactions D: Computer Science & . 26 (2019) 3582{3591Figure 9. The online transfer function trace captured byFigure 11. The transfer function without ltering 50 HzFigure 10. The online transfer function trace capturedFigure 12. The frequency response (SFRA) of the twodi erent methods without ltering the 50 Hz frequencycomponent.by di erent methods by ltering the 50 Hz frequencycomponent.Figures 9 and 10 demonstrate the output ofvarious methods with and without ltering the 50 Hzfrequency component, respectively. In the online modeand without ltering the 50 Hz frequency component,FFT and wavelet methods have poor agreement withthe SFRA in comparison with the STFT method.Even if the 50 Hz frequency component is ltered, theFFT method shows some uctuations that may leadto misunderstanding the transformer condition. Thisuctuation is magni ed in the subset of Figure 10.It is noteworthy that the FFT method shows goodagreement in the o ine mode, though it demonstratesa weaker performance than the STFT method in theonline mode. Therefore, it can be concluded that theSTFT method is better than FFT and wavelet methodsfor obtaining the frequency response.Hitherto, the e ect of di erent mathematicalmethods on the frequency response has been studied,and it has been demonstrated that STFT has the bestperformance in obtaining the frequency response. Itshould be noted that, until now, the input current ofthe HV winding has been considered as the response.There are also other responses that can be examined.The voltage of the secondary side is now considered asthe response.Figure 11 shows the voltage transfer functioncaptured by di erent methods along with the voltageSFRA trace as the reference. It is evident that even infrequency component.transformers in parallel.the presence of the 50 Hz frequency component, bothSFTF and FFT methods have good agreement withthe SFRA trace. In other words, both STFT and FFTexpress good responses in the voltage mode, though theFFT is weaker when the current is the response signal.In summary, it can be concluded that STFT worksappropriately in both current and voltage waveformsand, therefore, is a suitable method for the online FRA.5. E ect of adjacent equipment on the onlinetransfer function of a transformerInvestigating the e ect of the power system on theonline frequency response of a transformer is one ofthe challenging issues that has been always a matterof concern. In order to investigate such e ects, twoparallel transformers with di erent frequency responsesare assumed here. The di erences between these twofrequency responses are achieved by varying the dimensions of the mentioned transformer and the modelingelements accordingly. The frequency responses of thesetwo transformers, obtained in the o ine mode, arepresented in Figure 12. These traces are in factthe SFRA of these transformers and the referenceto determine whether the measured online transferfunction still corresponds with the target transformer.These two parallel no-load transformers are connected via a 60 km transmission line to a 50 Hz sourcemodeling the rest of the power system. A lightning
F. Nasirpour et al./Scientia Iranica, Transactions D: Computer Science & . 26 (2019) 3582{35913589Figure 13. The schematic connection of two parallel transformers.Figure 14. The frequency response of two paralleltransformers obtained in the online mode. As can be seen,the online and o ine transfer functions are identical.impulse according to IEC 60060 strikes the line andinitiates the transient signal. Figure 13 shows thedescribed arrangement. As can be seen, the inputcurrent and voltage of the HV winding are measuredfor calculating the desired transfer functions.The frequency responses due to the transientsignals of lightning are shown in Figure 14. Theseresponses are obtained using the STFT method. Theother two methods are not shown since the previoussection shows their weakness. It is apparent fromFigure 14 that the frequency responses of these twotransformers are not a ected by each other. In fact,using high-frequency transients as the excitation signalmakes the power system ine ective in the transferfunction.Several simulations like short circuit faults andlightning impulse striking in di erent locations of thenetwork are studied. Based on these simulations, it isconcluded that the presence of a parallel transformeror a transmission line may change the transient signalson the transformer; however, as long as the desiredfrequency components are excited, the frequency response of the transformer does not change. Evenif these frequency components are ltered by thetransmission line, the overall trace of the frequencyresponse does not experience any major change andonly uctuates in higher frequencies. For instance,Figure 15 shows the frequency response of these twoFigure 15. The frequency response traces of two paralleltransformers obtained from the short circuit transient.transformers obtained from a short circuit transient.These traces are extracted by the STFT method.As can be seen, the trances uctuate in the higherfrequency region. However, the extracted frequencyresponse of each transformer is still in good agreementwith the SFRA trace of that transformer. Figure 15also shows the potential of the short circuit transientsto be used for obtaining the online transfer function ofthe transformer.6. ConclusionDi erent mathematical methods for obtaining thetransfer function of a transformer in online FRA werecompared in this paper. The investigated methodincludes FFT, STFT, and the wavelet transform. Inall cases, the SFRA was considered as the referencefor choosing a suitable method. The comparison wasperformed on an appropriate model of the transformer,describing LV and HV windings and their electricalcharacteristics. Based on the presented results, itwas concluded that the STFT method produced themost similar response compared with the SFRA trace.Moreover, this method worked satisfactorily in bothcurrent and voltage responses without any need forltering the 50 Hz signal.In the next step, the e ect of other power network equipment on the online transfer function of thetransformer was studied. The results revealed that thepresence of a parallel transformer or a transmission line
3590F. Nasirpour et al./Scientia Iranica, Transactions D: Computer Science & . 26 (2019) 3582{3591might change the transient waveform of the network;however, as long as the desired frequency componentswere excited, the measured frequency response of thetransformer did not change. Studying the short circuittransient along with the lightning stroke indicated thatusing high-frequency transients as the excitation signalmade the power system ine ective in the online transferfunction.References1. Bagheri, M., Naderi, M.S., and Blackburn, T. \Advanced transformer winding deformation diagnosis:moving from o -line to on-line", IEEE Transactions onDielectrics and Electrical Insulation, 19(6), pp. 18601870 (2012).2. Su, C.Q. \Case study: lessons learned from the failure of a new 230-kV transformer-cable termination",IEEE Electrical Insulation Magazine, 26(1), pp. 15-19(2010).3. Tenbohlen, S., Coenen, S., Djamali, M., et al. \Diagnostic measurements for power transformers", Energies, 9(5), p. 347 (2016).4. Samimi, M.H., Akmal, A.A.S., Mohseni, H., et al.\Open-core optical current transducer: modeling andexperiment", IEEE Transactions on Power Delivery,31(5), pp. 2028-2035 (2016).5. G omez-Luna, E., Mayor, G.A., Guerra, J.P., etal. \Application of wavelet transform to obtain thefrequency response of a transformer from transientsignals-Part 1: theoretical analysis", IEEE Transactions on Power Delivery, 28(3), pp. 1709-1714 (2013).6. Gomez-Luna, E., Mayor, G.A., Gonzalez-Garcia, C.,et al. \Current status and future trends in frequencyresponse analysis with a transformer in service", IEEETransactions on Power Delivery, 28(2), pp. 1024-1031(2013).7. Yao, C. \Transformer winding deformation diagnosticsystem using online high frequency signal injectionby capacitive coupling", IEEE Transactions on Dielectrics and Electrical Insulation, 21(4), pp. 14861492 (2014).8. Abu-Siada, A. and Islam, S. \A novel online techniqueto detect power transformer winding faults", IEEETransactions on Power Delivery, 27(2), pp. 849-857(2012).9. Samimi, M.H., Tenbohlen, S., Akmal, A.A.S., et al.\Dismissing uncertainties in the FRA interpretation",IEEE Transactions on Power Delivery, 33(4), pp.2041-2043 (2018).10. Wang, M., Vandermaar, A.J., and Srivastava, K.D.\Review of condition assessment of power transformers in service", IEEE Electrical Insulation Magazine,18(6), pp. 12-25 (2002).11. Tenbohlen, S. \Experienced-based evaluation of economic bene ts of on-line monitoring systems for powertransformers", Cigr e Session 2002, pp. 12-110 (2002).12. Zhao, X., Yao, C., Zhao, Z., et al. \Performanceevaluation of online transformer internal fault detection based on transient overvoltage signals", IEEE
monitoring; Transfer function; Wavelet transform. Abstract. Power transformers are of vital importance in power delivery and, therefore, di erent diagnostic techniques have been proposed for them. The Frequency Response Analysis (FRA) is an e ective method that detects mechanical changes in transformer windings by extracting the transfer function.