Transcription
Questionnaire AnalysisUsing RDetermining the Validity of InternalStructure Using Factor Analysiswnarifin@usm.my & wnarifin.github.io1
About Me1. A medical doctor (long time ago).2. A lecturer at Biostatistics & Research MethodologyUnit, School of Medical Sciences, USM.3. A PhD candidate at School of Computer Sciences,USM.4. Questionnaire validation research.5. I “eat” R and Python everyday.2
Outlines1. Overview of Validity2. Exploratory Factor Analysis3. Confirmatory Factor Analysis3
Download workshop materials @wnarifin.github.io/workshop.html2019/10/05 Questionnaire analysis using R @ confeRence2019 (Sunway University)4
Overview of Validity5
Measurement validity & reliability Measurement Process of observing & recording. Measurement validity Accuracy. Measurement reliability Precision, consistency,repeatability.6
Classical validity3Cs:1. Content2. Criterion3. Construct7
The validity Unitary concept. Degree of evidence Purpose & Intended use of atool. Evidence from 5 sources:1. Content.2. Internal structure.3. Relations to other variables4. Response process.5. Consequences.8
The validity Construct – Concept to be measured by a tool. Internal structure evidence of validity. How relationship between items and factors reflectconstruct. Analysis:1. Factor analysis.2. Reliability.9
Factoring Group things that have common concept.Simplify.Factoring Grouping.Factor Construct Domain Concept.10
FactoringIntuitive factoring:Orange, motorcycle, bus,durian, banana, carAnything in common?11
FactoringGroup them[ Orange, durian, banana ][ Motorcycle, bus, car ]into two groups12
FactoringName the groupFruitsMotor vehicleOrangeMotorcycleDurianBusBananaCarfactor out the common concept13
Factoring Find out correlated variables from correlationmatrix. Manageable for small number of variables. Impossible for large number of variables.14
Factor analysis In fields like psychology, we cannot observedirectly (latent) psychological states, thusmeasured indirectly in of form items.15
Factor analysis e.g. Depression: depression causes symptoms of depression. depression (latent) is measured indirectly by itssymptoms (items). prove the symptoms are correlated to eachother, representing the concept of depression factor analysis.16
Factor analysis Multivariate analysis 1 outcomes. Numerical items, e.g. Likert scale, VAS scores,laboratory results etc. Group correlated items (in a measurement scale). Factor out latent (unobserved) factors cause thecorrelation between the items. Latent variable model analysis.17
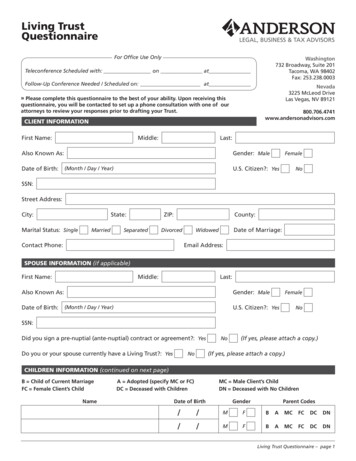
Factor analysisCommon factor model:Common Factors Measurement ErrorClassification: Exploratory factor analysis (EFA). Confirmatory factor analysis (CFA).18
Internal consistency reliability Consistent responses in a construct.Homogenous Reliability.Heterogenous Reliability.Advantage: Measure 1x only.19
Internal consistency reliability EFA: Cronbach's alpha coefficient.CFA: Raykov’s rho coefficient.Range: Not reliable 0 1 Perfectly reliable.Aim 0.7.20
Exploratory Factor Analysis(EFA)21
EFA explorative method. e.g. at early of questionnaire development. theory generating.22
EFAResearch questions: How many factors are there? Strength of relationship between items and thefactors? Factor correlations? % variance explained by the extracted factors?23
EFAApplications: Psychological scales/questionnaires, e.g.personality, depression, stress etc. Explore the number of common factors inpersonality items.24
EFAExtraction methods: classical: Principal axis factoring. other methods: Maximum likelihood, imageanalysis, alpha analysis.Factor loading: item-factor relationship. values 0.3.25
EFATo simplify EFA results, need factor rotation to obtainclear factors and factor loadings.Types of rotation: Orthogonal – uncorrelated factors. Varimax, Quartimax, Equamax. Oblique – correlated factors. Oblimin, Promax.26
EFA - preliminariesSuitability of data for the analysis: there must be correlations between the variables.Judged by: Kaiser-Meyer-Olkin (KMO) measures of samplingadequacy (MSA). KMO 0.7 required. Bartlet’s test of sphericity. P-value 0.05 indicatespresence of correlations.27
EFA - preliminariesNumber of factors to extract: Factors with Eigenvalues 1 (Kaiser’s rule). Cattell’s scree test. Parallel analysis.28
EFA - Practical [20 minutes]efa.R1. Data exploration.2. EFA.3. Reliability Cronbach’s alpha.29
# librarieslibrary(foreign) # for importing SPSS datalibrary(psych) # for psychometrics# )mardia(data)# preliminariesKMO(data)cortest.bartlett(data)scree scree(data); print(scree)parallel fa.parallel(data, fa both); print(parallel)30
# run efafa fa(data, nfactors k, fm "pa", rotate "oblimin"); print(fa)# reliabilityalpha alpha(data[FACTOR]); print(alpha)31
Confirmatory Factor Analysis(CFA)32
CFAStructural equation modeling (SEM): measurement model – CFA. structural model – path analysis.33
CFA Confirmatory method – e.g. at final stage ofquestionnaire development. Theory confirmation. Based on common factor model – similar to EFA. Accounts for measurement errors. Analysis done on variance-covariance matrix. Allows assessment of model fit.34
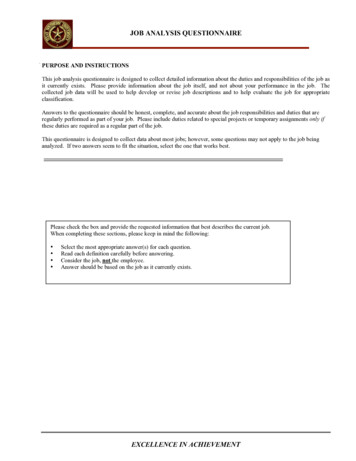
CFA vs EFACFA items: I love fast food I hate vegetable I hate eating fruits I hate exercise Obesity35
CFA vs EFAEFA items: I love catI love statisticsI love snorkellingI love driving carI love computer gameI like to have everything normally distributedI love nasi ayamI eat a lot of pisang gorengI spend most of my time in front of computer What factors?36
CFA vs EFAEFACFAExploratory.Confirmatory.Not necessary to specify factors.Pre-specified factors.Theory generating.Theory confirmation.Items not fixed to factors.Items fixed to factors.Model fit not tested.Model fit assessment.37
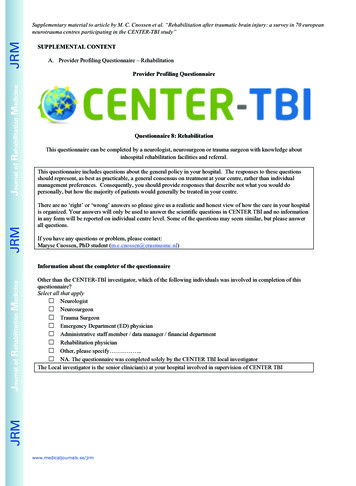
CFA path diagram38
CFAResearch question: Does our theoretical measurement model (factor item correlation) fit the data? Strength of relationship between items and thefactors? Factor correlations? confirm the theory.39
CFAApplications: confirm the measurement model of newlydeveloped questionnaires in target populations. confirm the measurement model of existingquestionnaires in new populations. confirm the measurement model translatedquestionnaires in new populations. confirmatory role of the analysis.40
CFAEstimations methods: numerical scale multivariate normal data maximum likelihood. numerical scale non-multivariate normal data robust maximum likelihood. categorical scale weighted least squares.Many more . . . http://lavaan.ugent.be/tutorial/est.html41
CFAResults to focus on:1. Overall model fit – by fit indices.2. Parameter estimatesa. Factor loadings.b. Factor correlations.3. Localized areas of misfit - Modification indices.42
1. Fit indicesCategoryFit indexAbsolute fitChi-squareStandardized root meansquare (SRMR)Cut-offP 0.05 0.08Parsimony correctionRoot mean square error ofapproximation (RMSEA)RMSEA (90% CI) 0.08,CFit P 0.05Comparative fitComparative fit index (CFI) 0.95Tucker-Lewis index (TLI) 0.9543
2.a Factor loadings (FLs) The guideline for EFA is applicable also to CFA (FL 0.3). In addition, the P-values of the FLs must besignificant (at α 0.05). Also look for out-of-range values – FLs should be inrange of 0 to 1 (absolute values).44
2.b Factor correlations Similar to EFA, a factor correlation must be 0.85,which indicates that the factors are distinct. A correlation 0.85 indicates multicollinearityproblem. Also look for out-of-range values – factorcorrelations should be in range of 0 to 1 (absolutevalues).45
Modification indices (MIs) MI indicates the expected parameter change if weinclude a particular specification in the model. e.g. by correlating between errors of Q1 and Q2. MIs 3.84 should be investigated.46
Model revisionTo improve model fit.Causes of poor fit: Item – low FL, wrong factor. Factor – multicollinearity. Correlated error – items with similarwording/meaning. Model not supported by data.47
Model-to-model comparisonTo choose the best model.Compare models: AIC (Akaike Information Criterion) and BIC(Bayesian Information Criterion). Better model Smaller AIC/BIC.48
CFA - Practical [20 minutes]cfa.R1.2.3.4.Data exploration.CFA.Path diagram.Reliability - Raykov’s rho.49
# librarieslibrary(foreign)library(psych)# for ry(semPlot)# for importing SPSS data# for CFA# for additional functions in SEM# for path diagram50
# lavaan model specificationmodel "FACTOR1 Q1 Q2 Q3FACTOR2 Q4 Q5 Q6Q1 Q2"# fit cfa modelcfa.model cfa(model, data, estimator "MLR")summary(cfa.model, fit.measures T, standardized T)# modification indicesmi modificationIndices(cfa.model); subset(mi, mi 3.84)# model comparisonanova(cfa.model, cfa.model1)51
# path diagramsemPaths(cfa.model, 'path', 'std', style 'lisrel',edge.color 'black', intercepts F)# reliabilityreliability(cfa.model)52
Thank You53
Q&ASession54
Factor analysis Multivariate analysis 1 outcomes. Numerical items, e.g. Likert scale, VAS scores, laboratory results etc. Group correlated items (in a measurement scale). Factor out latent (unobserved) factors cause the correlation between the items. Latent variable model analysis. 17