Transcription
Ranking and Salience*Baolian Wang†AbstractWe investigate the economic consequences of stock ranking using a novel naturalexperiment in which stock ranking is due to the rounding of stock prices. The resultsshow that ranking a stock in a more salient place can increase its return volatility,trading volume, liquidity, and cause higher short-term stock returns and an eventualreversal. Ranking only matters when it affects investor attention. The ranking effect isstronger when more stocks are on the list. Further, small investors are more affected byranking. Overall, the evidence shows that uninformed ranking can cause correlatedinvestor trading and have significant economic consequences.JEL Code: G12, G14, D03Keywords: ranking; investor attention; overreaction; volatility; volume*Ithank Nicholas Barberis, Utpal Bhattacharya, Justin Birru, Zhanhui Chen (discussant), James Choi,Zhi Da, Pengjie Gao, Samuel Hartzmark, Lin Peng, Armen Hovakimian, Danling Jiang, Simi Kedia,Dong Lou, Abhiroop Mukherjee, Mark Seasholes, Tao Shu, Yi Tang, Yangru Wu, Jianfeng Yu, HongZhang, Dexin Zhou, and seminar participants at Caltech Behavioral Finance Junior Faculty Conference,China International Conference in Finance, City University of New York (Baruch College), PekingUniversity (Guanghua), Rutgers University, State University of New York (Stony Brook), and TsinghuaUniversity (PBC School of Finance and School of Economics and Management) for valuable comments.An earlier version of this paper was circulated under the title of “The Causal Effects of Investor Attention.”All errors are my own.†Gabelli School of Business, Fordham University, 45 Columbus Avenue, New York City, NY 10023.Email: bwang46@fordham.edu.
1. IntroductionRanking is everywhere: dishes on restaurant menus, candidates on ballots, job marketcandidates in recruiting systems, business schools on U.S. News and Financial Times, stocks onstock exchange websites, and investment products available in our retirement plans. Somerankings are informative but others are random. Ranking is clearly important if ranking containsinformation. However, prior research finds that even random ranking can have important economicconsequences.1To distinguish the information effect and the pure ranking effect, we exploit a novel naturalexperiment in which ranking is due to the rounding of prices: the price limit events on the ShanghaiStock Exchange (SSE) and the Shenzhen Stock Exchange (SZSE). These two exchanges restrictthe daily absolute movement of a stock price to 10% of the previous trading day’s closing pricefor most of their listed stocks. The minimum tick size for stocks is RMB one cent. Therefore, incases where a 10% price change is not an integral number of cents, the daily price limit is roundedto the nearest cent. This rounding leads to differences in the maximum and minimum movementsof the daily returns. For example, the maximum daily price change for stocks priced at 9.99RMB,10.00RMB, and 10.01RMB is 1.00RMB. But they translate into different maximum and minimumreturn limits of 10.01%, 10.00%, and 9.99%, respectively.2 Very often stocks are ranked basedon their daily returns. In the example, 10.01% will be ranked the first in a best-performing stocklist and -10.01% will be ranked the first in a worst-performing stock list.These rankings are available to many investors. In our sample period, many Chineseinvestors trade using computer software packages. All of the widely used software packages allowSee Einav and Yariv (2006) and Koppell and Steen (2004) for two examples: one on coauthor ranking in academicpublications and one on candidate ranking on ballots.2See the Institutional Background and Empirical Design section for more details.11
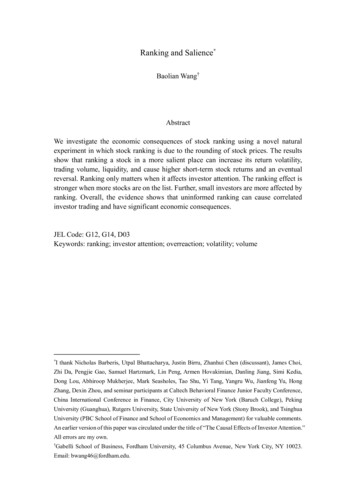
investors to rank stocks by their daily returns. Ranking is the easiest way to get the list of dailybest (and worst) performing stocks. Figure 1 is a screenshot from a widely used trading softwareplatform.3 This platform shows the first page of the summary information on all of the Chineselisted stocks ranked in descending order by their daily returns. The first 29 stocks hit the 10% limitand the last two do not.4 The worst-performing stocks are on the last page but investors can rankstocks in ascending order and list them on the first page. Second, a stock that has hit its daily pricelimit is very often featured on social media such as investment-related television programs, financewebsites, and investor forums. Investors pay attention to these media channels to get information.In many cases, the social media ranks stocks in the same way as Figure 1. Third, in the earlier partof the sample period when computers were not widely used, many investors would visit theirbrokerage houses to submit orders. The brokerage houses often displayed return-ranked stock listson their electronic boards. If ranking affects investor trading and stock prices, we expect that stocksranked differently might perform differently beyond what can be explained by rounding per se.Given a day, we compare stocks that are ranked higher on the list (denoted as the Highgroup) to stocks ranked lower on the list (denoted as the Low group), for each type of price limitevents separately. Empirically, we do not see any significant difference between the High and Lowgroups before they hit the limit.For stocks that hit the 10% upper price limit, the High and Low groups start to showsignificant differences after they hit the limit. Relative to the Low group, stocks in the High grouphave significantly higher trading volume, better liquidity, and higher return volatility. We also findIn China, winning stocks are indicated in red and losing stocks are indicated in green. This is different from mostother countries where the opposite convention is typically used.4On the screenshot, returns are also rounded with only two digits after the decimal point. However, the ranking isbased on un-rounded raw returns. For example, the first two stocks’ raw returns are 10.0186% and 10.0178%,respectively. In case of ties of raw returns (almost always when returns are exactly 10%), stocks are ranked by theirstock code (in descending order for the 10% stocks and in ascending order for the -10% stocks).32
that the High groups’ returns on t 1 (the first day after they hit the price limit) are significantlyhigher than the Low group, and the difference reverses in two weeks. The economic magnitudesare large. On t 1, relative to the Low group, the trading volume of the High group increases bymore than 19.3% of its normal time level, return volatility increases by more than 23.0% of itsnormal time level, and the abnormal return of the High group is around 38.1 basis points higher.However, we do not find any significant ranking effect among the -10% lower limit stocks.These findings are consistent with an investor attention-based interpretation. Stocks rankedhigher in the upper price limit list attract more attention that leads to crowded buying (Barber andOdean, 2008). The asymmetry between the two types of limit events can be explained by theasymmetry between buying and selling. Consider a stock which receives positive (negative) publicnews, and the news increases (decreases) its equity value by 12%. In a world without any frictionor ranking, under the price limit rule, the price of this stock should increase (decrease) by 10%today and open tomorrow up (down) by another 2%. After that, prices should be flat if there is noadditional news. Therefore, stocks that hit the upper (lower) price limit are more likely to attractbuyers (sellers). While investors can buy any stock they want, due to short-sales constraints, theygenerally only sell the stocks that they own. We expect that ranking is less important for selling:sellers are more likely to pay attention to their holdings than to the ranking of all stocks, and thenumber of stocks they hold is typically small. Limited attention has a smaller effect on sellingdecisions than buying decisions.5We conduct four more tests to provide support for the attention-based interpretation. First,The finding that ranking does not matter for the -10% limit stocks is seemingly inconsistent with Barber and Odean(2008) who document that individual investors are net buyers after both extreme positive and extreme negative returns.The difference in our settings explains the difference in our results. The price of stocks hitting the 10% limit typicallycontinues in the same direction. Therefore, the -10% limit stocks mainly attract sellers. In Barber and Odean (2008),returns do not persist as in the price limit cases, and therefore stocks experienced extremely negative returns can alsoattract potential buyers.53
we expect that ranking only matters if it affects investor attention. Number one on a list mightattract more attention than number ten, but it is unlikely that number 101 attracts more attentionthan number 110. There are a group of “special treatment” stocks (typically called ST stocks) thathave daily limits of 5%. The 5% returns are not extreme enough and are typically ranked in themiddle of return-based rankings. We find no ranking effect for these stocks. Second, using a directmeasure of attention, we find that ranking affects attention only for the 10% upper limit events,not for the -10% lower limit events or the 5% events. Third, the effects of ranking are strongerwhen more stocks hit the 10% limit in a day. Fourth, we find that the ranking of the 10% upperlimit stocks has larger effects on small investors who are more likely to have limited attention.We also find that stocks ranked higher on the 10% upper limit list have lower priceefficiency than stocks ranked lower. On the one hand, investors try to allocate their limitedattention optimally. On the other hand, they are affected by the salient attributes of options andattention allocation can lead to suboptimal choices. The attention difference across stocks that hitthe price limit is unlikely to be a deliberate decision by investors. This is consistent with theargument by Barber and Odean (2008) and our finding that the attention grabbing events mainlyattract less sophisticated investors. This suggests that distinguishing how investors allocate theirattention might help reconcile why the literature finds that greater attention is associated withworse price efficiency in some situations (Barber and Odean, 2008) and is associated with betterprice efficiency in others (DellaVigna and Pollet, 2009; Hirshleifer, Lim, and Teoh, 2009).Overall, our results show that uninformed ranking can work as a coordination mechanismto generate correlated trading. Ranking only matters when it affects investor attention. Thecorrelated investor trading might lead to lower market quality.4
The findings of this paper have implications beyond the price limit setting.6 Stocks andfunds are often ranked by their ticker or name. Many rating systems in finance and out of financeassign discrete grades, and within-grade rankings might not be related to the quality we are lookingfor. Some examples are credit ratings, mutual fund ratings (e.g., Morningstar rating), studentgrades, and restaurant ratings. Very often, within-grade ranking is alphabetical that can lead tounfairness as in the academic publication setting that Einav and Yariv (2006) describe.2. Relation to the Literature2.1 RankingThis paper contributes to the literature on the effect of ranking. Psychology has a longhistory of examining ranking. As an example, the rank-dependent utility (Quiggin, 1982) and thecumulative prospect theory (Tversky and Kahneman, 1992) predict that the ranking of payoffsimpacts salience and people’s decision weights. Scholars have studies the effect of alphabeticalranking. For example, Einav and Yariv (2006) document that authors with surnames early in thealphabet are more likely to receive tenure at top-economics departments. Feenberg, Ganguli, Gaule,and Gruber (2017) study weekly email announcement of NBER working papers and theydocument that papers listed first each week are more likely to be viewed, downloaded andsubsequently cited. Jacobs and Hillert (2016) find that stocks that appear near the top of analphabetical listing have higher trading volume and liquidity. Koppell and Steen (2004) find thatcandidates whose names are at the top of ballots receive more votes. Hartzmark (2015) shows thatinvestors are more likely to sell the best-performing and worst-performing positions in theirportfolios. In Hartzmark (2015), stock ranking is investor-specific, while in our setting, stockPrice limit rules are widely used by financial markets around the world. Deb, Kaley and Marisetty (2010) documentthat 41 out of 58 major countries have applied certain types of price limit rules in their exchanges. The US futuresmarket also has daily price limits (Brennan, 1986).65
rankings are shared by many investors.The effect of ranking can come from a pure order effect (Tversky and Kahneman, 1992) ora relative magnitude effect (Bordalo, Gennaioli and Shleifer, 2012). The pure order effect predictsthat investors’ attention allocation is only related to the order but not to the relative magnitudes,but Bordalo, Gennaioli and Shleifer (2012) predict that the relative magnitude is the key driver forattention allocation. In the current paper, ranking is purely due to rounding, and the ranked stocksdiffer very little in terms of their ranked variable. This setting allows for a clean test and providessupport for the existence of the pure order effect.2.2 Investor AttentionThis paper is also related to the growing literature on investor attention. Attention isnecessary for learning and trading. On the one hand, investors try to allocate their limited attentionoptimally. On the other hand, they are affected by the salient attributes of options and attentionallocation can lead to suboptimal choices because these might attract undo attention. Thetheoretical studies have examined how agents should rationally allocate attention (Sims, 2003) andhow attention constraints affect investors’ trading behavior and portfolio choice (Abel, Eberly, andPanageas, 2007; Huang and Liu, 2007; Van Niewerburgh and Veldkamp, 2010; Hendershott, Li,Menkveld, and Seasholes, 2014; Andrei and Hasler, 2016), price informativeness (Peng, 2005),return comovement (Peng and Xiong, 2006; Mondria, 2010), return volatility (Andrei and Hasler,2015), asset price levels (Merton, 1987; Barber and Odean, 2008; Andrei and Hasler, 2015), andcorporate policy (Hirshleifer and Teoh, 2003).The empirical literature on attention has proposed various proxies, such as extreme returns(Barber and Odean, 2008; Seasholes and Wu, 2007), trading volume (Gervais, Kaniel, andMingelgrin, 2001; Barber and Odean, 2008; and Hou, Peng, and Xiong, 2009), news and headlines6
(Huberman and Regev, 2001; Barber and Odean, 2008; Tetlock, 2011; Yuan, 2015; Kaniel andParham, 2016), advertising spending (Chemmanur and Yan, 2009; Grullon, Kanatas, and Weston,2004; Lou, 2014; Madsen and Niessner, 2016), Google Search Volume Index (Da, Engelberg, andGao, 2011), searching on Bloomberg terminals (Ben-Rephael, Da, and Israelsen, 2016), retweetedTwitter news (Chawla, Da, Xu, and Ye, 2015), release of stale information (Huberman and Regev,2001; Tetlock, 2011; Gilbert, Kogan, Lochstoer, and Ozyildirim, 2012), and distraction byweekends or contemporaneous events (DellaVigna and Pollet, 2009; Hirshleifer, Lim, and Teoh,2009; Louis and Sun, 2010; Huang, Huang and Lin, 2016; Kempf, Manconi, and Spalt, 2016;Peress and Schmidt, 2016). Limited attention can explain many financial market phenomena suchas overreaction and underreaction (Hirshleifer, Lim, and Teoh, 2009; Da, Engelberg, and Gao,2011; Li and Yu, 2012). Seasholes and Wu (2007) is an important precedent for using price limitevents to measure investor attention. However, they compare upper price limit stocks with otherstocks, while we compare across the stocks that hit the limit.In this paper, we investigate the salience effect due to ranking. Relative to most studies,our empirical strategy can deal with the endogeneity concern for investor attention.7 The attentiondifference across price limit stocks with small differences in returns is unlikely to be a deliberatedecision by investors. In addition, most studies almost exclusively focus on how attention affectsstock returns. There are a limited number of studies on how attention affects other importantaspects of the financial markets such as trading volume, liquidity, volatility, and price efficiency.The novel design of this paper allows for the investigation of all of these aspects and in a systematicLiu and Peng (2016) document compelling evidence that investors take attention allocation into account whenmaking decisions. Firms are also active in managing investor attention. Madsen and Niessner (2016) find that part ofthe previous findings on the financial market effect of advertisement might be due to the endogeneity of advertisement.Michaely, Rubin and Vedrashko (2016) highlight that firms that choose to make important announcements on Fridayrather than other weekdays might be inherently different from other firms. Boulland and Dessaint (2014) show thatfirms strategically reduce investor attention when they plan to disclose bad news.77
way.2.3 Price LimitThe stock markets institute price limit rules as a stabilization mechanism to provide timefor rational assessment during large price fluctuations. Critics point out that the price limit rulescan cause higher volatility, impede price discovery, and interfere with trading (Kim and Rhee,1997). Chen, Gao, He, Jiang, and Xiong (2016) show evidence that price manipulators takeadvantage of other investors during the price limit events. None of these studies examine the effectof price limits from the perspective of ranking. The findings in this paper provide one mechanismon why price limits might lead to higher volatility and lower price efficiency.3. Institutional BackgroundThe two Chinese stock exchanges, the Shanghai Stock Exchange (SSE) and the ShenzhenStock Exchange (SZSE) established the current price limit rule on December 16, 1996.8 For mostof the stocks (“normal” stocks), the daily absolute movement of a stock price is restricted to 10%of the previous trading day’s closing price. On April 22, 1998, the SSE and SZSE started to labela group of stocks as “special treatment” stocks (or ST stocks). These stocks have a narrower dailyprice limit of 5%. A stock is labelled as a ST stock if its accounting profits are negative for twoconsecutive years or if the net asset value per share is lower than the par value of the stock. Forboth normal and ST stocks, trading can continue to take place after its stock price hits the upperThere were also price limit rules when the two exchanges were established. The daily limits varied in different timeperiods from 0.5% to 5%, were frequently adjusted, and could also be different for different stocks even though theywere listed on the same exchange. In the early period, there were only dozens of listed stocks. The demand for stockswas very high. The price limits were so frequently hit that trading volume was extremely low. On May 21, 1992, theprice limit rule was completely lifted. There was no price limit rule until December 16, 1996, when the current rulewas reestablished.88
(lower) price limit, but the trading price cannot be out of the range of the daily price limit.9 As aresult, a stock can hit the limit during a trading day but close the day within the limits.10In both the SSE and SZSE, the minimum tick size for stocks is RMB 1 cent. Therefore, incases where a 10% (or 5% in case of ST stocks) price change is not an integral number of cents,the exchanges round the daily price limit to the nearest cent. Consider the following example.Suppose there are three stocks: A, B, and C. Their closing prices at the previous trading day are9.99RMB, 10.00RMB, and 10.01RMB, respectively. Rounded to the nearest cent, their 10% pricemovement is 1.00RMB for all. Although they all have the same dollar value for the daily pricemovement, their return limits are different. Returns at the upper (lower) limits are 10.01% (10.01%), 10.00% (-10.00%), and 9.99% (-9.99%), for A, B, and C, respectively.As discussed in the Introduction, investors can easily access all the stocks that are rankedby their daily returns. In a descending rank, the 10.01% will be ranked first, 10.00% second, and9.99% third. In the ascending rank, the -10.01% will be ranked the first, -10.00% second, and 9.99% third.Stocks ranked at the beginning of a list are more salient than stocks ranked later in the list.In the example in Figure 1, if one could separate stocks at the 10% upper limit from other stocks,it would be easy to reverse the order and rank the 9.97% stocks first. However, none of the mostwidely used trading software packages provides such separate lists. The number of stocks on eachpage depends on the size and resolution of your computer screen. On a 20-inch screen with1600x900 resolution, the first page shows around 30 stocks (like Figure 1). With a smaller screenThis is different from trading halts. In a trading halt, trading of a security is suspended. Even though trading continuesunder the price limit rule, trading volume is typically very low because investors concentrate only on one side of themarket.10Price limits are lifted on the first trading day of IPO stocks or when a stock is emerging from long suspension intrading. Those stocks are not in our sample.99
or lower resolution, the stocks with lower limit returns display on the second page. Ranking on thesecond page further reduces those stocks’ salience.Unlike other settings where rankings can be manipulated, we argue that firms are unlikelyto manipulate the ranking we study. Corporate opportunistic activity might affect whether a stockhits its daily price limit or not, but this activity is unlikely to differ across the stocks at the limitbut with different daily returns. To do this, a firm needs to manage its stock price deliberately toclose at some specific number and make sure that the stock will hit the price limit the next tradingday, which is a small probability event to begin with.11 In addition, as we document later, the priceeffect is temporary, it is unclear how firms can benefit from it. Overall, we argue that the pricelimit events provide a quasi-random ranking.4. Data and Summary StatisticsWe restrict the sample to China’s A-shares (i.e., shares that are quoted and traded inChinese yuan). 12 The data on daily stock returns, prices, volumes, and number of sharesoutstanding and the annual firm-level accounting data are from the China Stock Market &Accounting Research (CSMAR) Database. Both the SSE and SZSE adopt a computerized centralorder-matching system without market makers. The CSMAR also contains data for intradaytransactions, such as stock code, trade size, price, and trade time, and the prevailing bid price andask price. Further, the database indicates whether the trade is buyer-initiated or seller-initiated.Thus we do not need to infer the trade direction. The sample period of price limit events starts onThe probability for a stock hitting the 10% upper price limit is 0.8%: on average twice a year.There are two types of shares in China: A-shares and B-shares. A-shares are restricted to domestic investors, and Bshares were restricted to foreign investors until February 2001 when domestic individual investors were allowed toparticipate in the B-share market. A-shares are quoted and traded in Chinese local currency (Chinese yuan), ShanghaiB-shares are quoted and traded in US dollars, and Shenzhen B-shares are quoted and traded in Hong Kong dollars. Atthe end of our sample period, there are around 2,500 A-share companies, but only around 100 B-share companies. TheB-share market liquidity is also much worse than the A-share market.111210
December 16, 1996, as that was when SSE and SZSE established the current price limit rule. Thesample stops on March 31, 2015, which is the latest date that data are available at the time of thisstudy. The sample for the intraday data is from January 2000, to October 2014. The CSMAR doesnot cover intraday data before 2000, and October 2014 is the latest date that intraday data areavailable at the time of this study.We compare across stocks that hit the same type of limit on the same day. We focus onstocks that hit the limit at market close and discard stocks that hit the limit during a day but not atthe market close. We follow this procedure to ensure that investors have time to pay attention tothe ranking. There is 18.5 hours from market close to the next day’s market open. The intradayranking might matter less because the list of stocks that hit the limit changes from time to time,and investors might pay attention to different intraday lists.We denote stocks ranked in the first half of a list as the High group and stocks ranked inthe second half as the Low group. Both the High and the Low group contain only stocks that hitone type of limit. We do this separately for each type of price limit events. For days with an oddnumber of stocks that hit the limit, the median stock is put into the High group. The results aresimilar if we put the median stocks into the Low group or we simply discard them. 13 To include aday into the analysis, we require that there are at least five such stocks in a day. In the sampleperiod, there are 4,910 trading days. For the 10% upper limit stock analysis, the final samplecontains 2,505 days and 54,706 stocks, with an average 21.8 stocks per day. For the -10% lowerlimit stock analysis, the final sample contains 522 days and 25,846 stocks, with an average of 49.5stocks. The lower limit events are more concentrated than the upper limit events.The effect of rounding mainly depends on the digit in the hundredth place of the stock price and the price level.Stocks with lower price level are more likely to be ranked either very high or very low than stocks with higher pricelevel. However, this is symmetric. As we will show in Table 1, the High stocks and the Low stocks do not differ inaverage price.1311
There are days with a very large number of stocks that hit the limit. The day with the largestnumber of 10% upper limit events is September 19, 2008, with 1,234 stocks that hit the limit. Onthat day, the market index increased by 9.45%. The day with the largest number of -10% upperlimit events is June 10, 2008, with 852 stocks that hit the limit. On that day, the market indexdecreased by 7.73%. Days like these are unusual. In total, 27 (55) days have more than 100 stocksthat hit the 10% (-10%) limit. In the empirical analysis, we weight each event day equally ratherthan weight each event stock equally. Therefore, the results are not affected by these unusual days.Table 1 reports the summary statistics. Panel A reports the 10% upper limit stocks andPanel B the -10% lower limit stocks. For each variable, we first calculate the daily average forHigh, Low, and High minus Low, and then calculate the averages across different event days. Tomitigate the effect of outliers, we winsorize all continuous variables at the 1% level for both tailsexcept for returns that do not seem to have extreme values. For High-Low, we report its mean andt-value.On average, for 10% upper (-10% lower) limit events, there are 11.17 (25.03) stocks in theHigh group and 10.67 (24.48) stocks in the Low group. The High group has more stocks becausewe classify the median stocks into the High group for days with an odd number of stocks. Day t isthe day of the price limit day. The means of Returnt are 10.032% (-10.016%) and 9.974% (-9.964%)for High and Low, respectively. By construction, the high statistical significance is not surprising.The differences for both the upper and the lower limit cases are only around five basis points thatare economically small. We also report firm size (log market capitalization), log price, and rawprice at t-1. None of the three variables shows any statistically or economically significantdifference.We also test whether the two groups differ in a few other characteristics. Turnover is the12
daily trading volume scaled by the number of tradable shares.14 We use relative bid-ask spread tomeasure liquidity and realized variance to measure return variation. We calculate both measureswith intraday data.15 Relative spread is defined as the bid-ask spread divided by the average of thebid and ask. The daily relative spread is averaged across all of the prevailing quotes for all of thetrades within a day. Realized variance for stock i is defined in a “model-free” fashion as:𝑖RV𝑖𝑡 𝑛𝑖 1[𝑝𝑗𝑖 𝑝𝑗 1]2 ,(1)where 𝑝𝑗𝑖 denotes the logarithmic price (midpoint of bid and ask) of stock i at the end of the jth 10minute interval in day t. This model-free realized volatility based on high-frequency intraday datais more accurate than the realized volatility based on daily returns (Andersen, Bollerslev, Diebold,and Labys, 2001a, 2001b). It also provides a daily measure of volatility that can be used to comparereturn variations day by day around the price limit events.We calculate all three variables for two periods: t-125 to t-21 and t-20 to t-1. We do thecalculations for these two periods separately because t-20 to t-1 is shortly before the price limitevents and might be different from t-125 to t-21. We want to make sure that the High and Lowgroups are not different in any of these two periods. For each variable, we first calculate its dailyvalue and then calculate its time series mean. The results in Table 1 show that for both the Highand Low groups, turnover and volatility in the t-20 to t-1 period are higher than in the t-125 to t21 period, and relative spread keeps constant. The increase in turnover and volatility suggests thatOriginally because the gover
University (Guanghua), Rutgers University, State University of New York (Stony Brook), and Tsinghua . †Gabelli School of Business, Fordham University, 45 Columbus Avenue, New York City, NY 10023. Email: bwang46@fordham.edu. 1 1. Introduction . rankings are informative but others are random. Ranking is clearly important if ranking contains