Transcription
OPEN ACCESSEURASIA Journal of Mathematics Science and Technology EducationISSN: 1305-8223 (online) 1305-8215 (print)2017 13(8):5675-5684DOI: 10.12973/eurasia.2017.01021aResearch on Online Learning Behavior Analysis Model in Big DataEnvironmentWang PengChina Business Executives Academy, Dalian (CBEAD), CHINAReceived 5 February 2017 Revised 6 July 2017 Accepted 25 July 2017ABSTRACTIn this study, on the basis of summarizing the current situation of online learning behaviorand related theoretical research. Based on the analysis of related research results,considering the existing problems, the main contents of this paper include the followingaspects: (1) Define the connotation of online learning behavior, and introduce the theory ofartificial intelligence into the classification of online learning behavior from structuraldimension, functional dimension and mode dimension; (2) According to the overallarchitecture of the analysis model, the analysis model is constructed from left to right andtop to down under the big data environment. The online learning behavior data model isconstructed from the multi-dimensional and multi-level perspective to determine thesource, method and process of data collection. After that, designs the horizontal andlongitudinal processes of the online learning behavior analysis model. On this basis, usingthe big data processing technology on the online learning behavior analysis model in allaspects of the specific algorithms involved in the implementation. (4) We chose the onlinelearning platform of China Business Executives Academy, Dalian to do empirical analysis.In-depth study from the following three aspects: the learning behavior clustering analysisbased on K-means algorithm, the individualized course recommendation analysis basedon Page Rank algorithm and the correlation analysis of learning effects.Keywords: big data, online learning platform, online learning behavior, data miningINTRODUCTIONThe rapid development of Internet technology and education information technology has speeded up people’slearning and changed the way of thinking and cognitive. Online learning model quickly rise and has been widelyrecognized. This new way of learning and education model, will drive the education of information technologyreform and innovation. The rapid development of online learning also faces some challenges, lower coursecompletion rate and the user’s loss of the phenomenon is occurred frequently in the online learning platform. Inorder to find out the reasons for the formation of this situation, in the context of big data, analyzing the largenumber of users’ learning behavior data recorded in the online learning platform. Through tracking the learningbehaviors generated by the users in the learning process and get the analysis results, we can provide some guidancefor teachers and platform managers to monitor and interpose learners to learn. Therefore, on the basis of Authors. Terms and conditions of Creative Commons Attribution 4.0 International (CC BY 4.0) apply.Correspondence: Wang Peng, Lecturer, Department of Executive Education, China Business Executives Academy,Dalian, China. Address to: No.777, HongLing Rd., High-tech Zone, Dalian City 116086, China. Tel: 8618941119125.wangp@cbead.cn
W. Peng / Research on Online Learning Behavior Analysis Model in Big Data EnvironmentState of the literature Research on online learning platforms has been relatively perfect, but the analysis of online learningbehavior in large data environments is still in its infancy. In theory and practice research also has certain achievements, but there are still some shortcomings, such asthe data acquisition platform users online learning behavior lack of pertinence, mostly collect data directlyfrom the database, how to extract the valuable data item is an important basic work of learning behavioranalysis. At the same time, the analysis method of online learning behavior analysis model is limited.Contribution of this paper to the literature The concept and connotation of online learning behavior are defined. The categories of online learningbehavior are classified according to the theory of artificial intelligence. Research under the environment ofbig data associated factors of online learning behavior and behavior analysis of driving force, the buildingprinciples of behavior analysis model and theoretical basis, on the basis of the analysis model for onlinelearning behavior to carry on the overall architecture. According to the general architecture of analysis model, from two aspects of multi-dimensional and multilevel first constructs the data model of online learning behavior, realize the online learning behavior fromthe viewpoint of multiple data storage and record, data acquisition and analysis provides the guidance forthe next step work, secondly analyses the model of vertical and horizontal process design process design. According to the analysis model of the behavior, the corresponding method is analyzed. For the clusteringanalysis of online learning behavior, first identify the classifications and make a cluster operation. Forpersonalized course recommended analysis, to determine the target users are learning cluster, and learn tofind a representative users, will give the user the highest course recommend to target learners; To analysisthe correlation of learning behavior and learning effect, first of all, clear learning behavior index attributesand attribute reduction, the use of the improved Apriori algorithm for extraction of decision rules. In online learning platform of China Business Executives Academy, Dalian (CBEAD) (E class) as theresearch object, using the learning behavior analysis model to analyze the corresponding framework,analysis result feedback to learners, teachers, education researchers and managers platform and applicationeffect is given and the enlightenment.summarizing the current situation of online learning behavior and related theoretical research, this paper hasfollowing aspects:Firstly, defines the connotation of online learning behavior, and introduce the theory of artificialintelligence into the classification of online learning behavior from structural dimension, functional dimension andmode dimension. On the basis of associated factors and driving force, this paper provides the overall architectureof online learning behavior analysis model under big data environment.Secondly, according to the overall architecture of the analysis model, the analysis model is constructedfrom left to right and top to down under the big data environment. The online learning behavior data model isconstructed from the multi-dimensional and multi-level perspective to determine the source, method and processof data collection. After that, designs the horizontal and longitudinal processes of the online learning behavioranalysis model. On this basis, using the big data processing technology on the online learning behavior analysismodel in all aspects of the specific algorithms involved in the implementation.Thirdly, we chose the online learning platform of China Business Executives Academy, Dalian (CBEAD)to do empirical analysis. In-depth study from the following three aspects: The learning behavior clustering analysisbased on K-means algorithm, the individualized course recommendation analysis based on Page Rank algorithmand the correlation analysis of learning effects. And according to the analysis results provide the application effectand revelation.5676
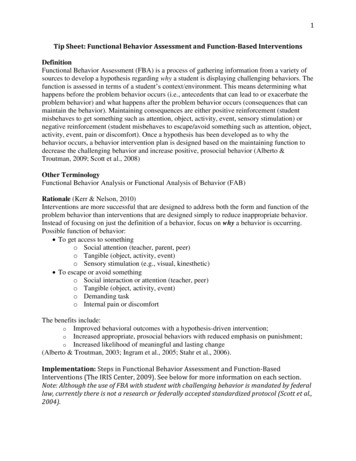
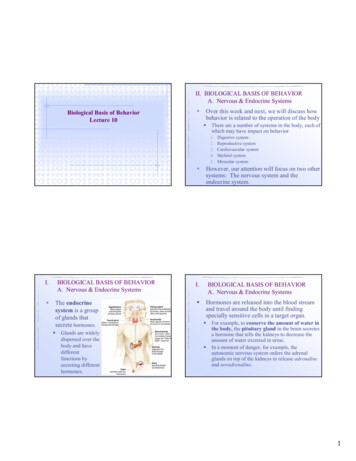
EURASIA J Math Sci and Tech EdFigure 1. Research statusLITERATURES REVIEWINGConsidering the characteristics of online learning behavior within big data environment, therefore, manyscholars have explored big data development, online learning platform, online learning behavior, and haveobtained rich theoretical and practical results. At present, the study of online learning behavior in big dataenvironment is mainly focused on three aspects, as Figure 1 shows.(1) Research on big data. Although the concept of big data was developed early, the development of itstechnology was in its infancy. So far, the main areas of big data technology include visual analysis, data miningalgorithms, semantic engine, data quality and data management. Google’s Mapreduce model, for example, focuseson large data sets. In the education area, the University of Purdue uses big data technology to build learning earlywarning mechanisms by collecting data from students in the course. The main focus of current scholars on big dataresearch is the extraction of value from data sets. To discover knowledge from the data and use it to guide people’sdecisions, the data must be analyzed deeply. Social media big data is a hot area of analysis of big data.(2) Research on online learning platform. Online Learning platform or network Learning platform,network teaching platform, it’s by providing an open, Shared teaching environment, to support the student to carryon the online course Learning, foreign called e - Learning platform. According to the platform for the user object isdifferent, the online learning platform can be divided into two categories, namely for a profit of customizationplatform and provide free course counseling non-profit platform. Such as Moodle is the world’s most widely usedfree online learning platform, not only collected from worldwide well-known excellent courses in university, alsooffers a variety of online communication tools, all kinds of learners for learning. In recent years, the typicalrepresentative on the online learning platform is the massive open online course, also known as MOOC.(3) Research on online learning behavior. A lot of research is involved in the behavior, the research objectand the selection of sample has certain limitation, while some studies concerning online learning behavior wasconducted under the intervention of the researchers. Kenneth studied the influence of learning behavior andreflective learning in online business courses, Prior has analyzed the impact of online learning behaviors from threeaspects: learning attitude, information literacy and self-efficacy, Butcher had studied the different levels of priorknowledge and the relationship between online learning behavior, the results show that a higher level of priorknowledge can lead to learners at a deeper level of learning behavior.5677
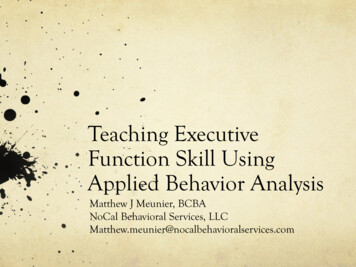
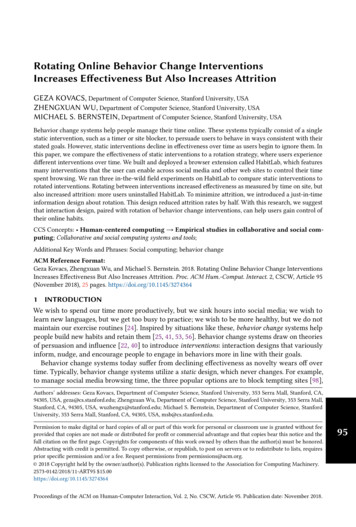
W. Peng / Research on Online Learning Behavior Analysis Model in Big Data EnvironmentOnline learningserverOnline learningplatform databaseOnline learningclientsTheDatacollectionCollect data according to the onlinelearning behavior data modelOnline learningbehavior clusteranalysisLearning resourcesbased on learningbehaviorThe correlation analysisof learning behavior andlearning effectData selection andpretreatmentData selection andpretreatmentData selection andpretreatmentCluster methodselectionSelection of courserecommendationsSelect theassociation rulemethodCluster analysisprocessThe course recommendsthe analysis processCorrelation analysisprocessThe online learning behavioranalysis results are visualized andappliedOnlinelearnersTeachersThe sisResultsoutputEducationresearchersFigure 2. The overall architecture of the online learning behavior analysis modelRESEARCH DESIGNIn determining online learning behavior on the basis of analyzing the goal, on the basis of behavioralscience, system when it comes to learning theory as the theoretical basis, build a data model and data collectiononline learning behavior, from left to right, since the downward after analysis and modeling for online learningbehavior; Following the analysis model and the model of online learning process, the analysis model is dividedinto three parts: cluster analysis, recommendation analysis and correlation analysis. According to the process ofproblem solving, the online learning behavior analysis model longitudinal process is divided into data processing,method selection and analysis process, result output and so on, as Figure 2 shows.(1) Correlation factor analysis of online learning behavior. Online learning behavior as a multidimensional complex system, provide for the elements that influence the detailed analysis, to identify thecharacteristics of learning, learning motivation, and style, to help teachers and managers to design a reasonableteaching structure and teaching strategies, and later to clustering learning behavior, learning resources to5678
EURASIA J Math Sci and Tech EdTable 1. Online learning behavior RFL classificationsBehavioral classification index Classification index meaningRThe time interval for the distance analysis points when logging on the platformFWatch video, electronic notes, interactive communication, etc.LWatch the course video in the platformrecommend and to investigate the effect and study the correlation between provides guidance to help. Whenanalyzing the influence factors, not only the internal factors of the learner, but also external factors includinglearning environment, supporting system and teaching mode are also considered. The internal factors include thelearner’s information literacy, the learning motivation, the learner’s original subject knowledge, the learning styleand the learner’s self-efficacy. External factors include online teaching patterns, online learning resources, onlinelearning support systems, and teacher education skills.(2) Research online learning behavior motivation. This includes requirements and interest motivation,technical motivation, and data motivation. Requirements and interest motivation include online learners, courseorganizers, platform managers, and the education researchers. Technical motivation includes education datamining, learning analysis, and so on. Data motivation includes data volumes, data collection, and data storage.(3) Online learning behavior related analysis. The learning behavior is mainly divided into external andimplicit. Among them, most of the things that can be recorded by the platform are explicit learning behaviors, suchas browsing, searching, saving, etc. With learners’ learning motivation, learning, reflection and mental activitiessuch as learning and memory behavior related to belong to implicit learning behavior, this article mainly analysisthe is under the environment of big data can be recorded online learning platform of explicit learning behavior.Online learning behavior as a complex system, we can classify from multiple dimensions, then formed a completeand comprehensive online learning behavior classification system.EVALUATED MEASUREMENTS(1) Online learning behavior cluster analysis based on k-means method. Firstly, we identified the categoryindicators for online learning behavior RFL. This paper distinguishes clients from three behavioral variables:Recency, Frequency, and Monetary. For research study of the classification of the users’ online learning platformbased on RFM analysis method on the basis of the classification index system was proposed based on RFL onlinelearners. By analyzing the online learning process and the support service environment provided by the platform,the various index variables in the RFM analysis method were redesigned. The RFL classification index system builtin this article is shown in Table 1.On the basis of design classification index system, using the K - means algorithm to cluster analysis ofbehavior, the analysis process includes the following steps: data normalization process, determine the learnerbehavior feature weights and K - means clustering algorithm. In the platform, in order to analyze which categoriesof learners of course good loyalty, which categories of learners are lower course loyalty is the trend of the currentonline education research. Online courses according to the learners’ learning can be intuitive and clearunderstanding of the learners’ learning attitude, therefore in building online learning behavior based onclassification index, through calculating the weight of each index in each category, and according to the formula tocalculate the online course loyalty given learners of loyalty points of the course, to help teachers and platformmanagers take timely teaching strategies and teaching modes, increase the heat of the online learning. The formulafor loyalty based on online learning behavior is: ���𝑠𝑠𝑠) 𝛽𝛽𝐹𝐹 ′ 𝛾𝛾𝐿𝐿′ 𝛼𝛼𝑅𝑅′ . Here, 𝛼𝛼 stands for R weights,𝛽𝛽 stands for F weights, 𝛾𝛾 stands for L weights, 𝑅𝑅 ′ stands for mean value of R, 𝐹𝐹 ′ stands for mean value of F, 𝐿𝐿′ standsfor mean value of L.(2) The analysis of personalized curriculum recommendations based on online learning behaviors. Onlinelearning platform, recommend personalized courses need according to the result of clustering online learningbehavior, could be divided into different cluster behavior characteristics, learners to identify the target learners ofclusters; Second, the Page Rank algorithm is used to identify one or more representative learners. Finally, the target5679
W. Peng / Research on Online Learning Behavior Analysis Model in Big Data EnvironmentTable 2. Curriculum evaluationCourse/LearnerData miningLearner 15Learner 23Learner 315Learner 42Learner 55Learner 68Learner 728Learner 84Learner 911Learner 101Probability and statistics540151035120C programming122101012076Android development73030379039user is recommended to be the most highly rated course resource. When a user is learning in a platform, there is alot of interaction with the course. Through learning behavior of learners’ scores of set, to clear the learners to learnabout the course, specific learning behavior of the scores for: 0 - browse, 1 -collecting, 2 - registration, 3 – watching,4- evaluation, 5 -testing , 6 - take an examination, 7 - sharing, 8 - download, Table 2 presents is part of the learnerto the grade evaluation of the courses. According to online learning behavior, when a learner scores a maximumnumber of points on a course, it is the subject that learners are most likely to study.Page Rank algorithm is presented and Map Reduce framework for the extraction of typical learners, everynode in the Page Rank algorithm in the initial first before they were given a Page Rank value, representation for𝑃𝑃(𝑖𝑖). If there is a border between any two nodes, there is a vote between the two nodes, then we use 𝐶𝐶(𝑖𝑖) to standsfor the number of edge which send from 𝑣𝑣𝑖𝑖 . To calculate the number of votes between any two nodes, the numberof points that exist is the number of points that can be reached between the nodes, the expression for thecontribution of node 𝑣𝑣𝑖𝑖 to node 𝑣𝑣𝑗𝑗 is 𝑃𝑃(𝑖𝑖)/𝐶𝐶(𝑖𝑖). Similarity calculation can through user behavior characteristic valuebetween cosine similarity is concluded, the platform user behavior characteristics of variables with a set of vectors,as 𝐷𝐷𝑖𝑖 (𝑅𝑅𝑖𝑖 , 𝐹𝐹𝑖𝑖 , 𝐿𝐿𝑖𝑖 ). Through the goal the learner’s behavior characteristic vector and some students in groupbehavior characteristic vector comparison, namely the target learners 𝐷𝐷𝑗𝑗 𝑅𝑅𝑗𝑗 , 𝐹𝐹𝑗𝑗 , 𝐿𝐿𝑗𝑗 with some students in thegroup 𝐷𝐷𝑖𝑖 (𝑅𝑅𝑖𝑖 , 𝐹𝐹𝑖𝑖 , 𝐿𝐿𝑖𝑖 ) line 𝑠𝑠𝑠𝑠𝑠𝑠 𝐷𝐷𝑖𝑖 , 𝐷𝐷𝑗𝑗 into the cosine similarity calculation. The formula is 𝑠𝑠𝑠𝑠𝑠𝑠 𝐷𝐷𝑖𝑖 , 𝐷𝐷𝑗𝑗 𝑛𝑛𝑗𝑗 1 𝑑𝑑𝑖𝑖 𝑑𝑑𝑗𝑗2𝑛𝑛2 𝑛𝑛𝑗𝑗 1 𝑑𝑑𝑖𝑖 𝑗𝑗 1 𝑑𝑑𝑗𝑗. If 𝑠𝑠𝑠𝑠𝑠𝑠 𝐷𝐷𝑖𝑖 , 𝐷𝐷𝑗𝑗 is larger, it means that the match is both high and representative. The similarity matrixM is obtained by the above analysis. On the basis of drawing the similarity between the learner and the target, findthe representative set that can represent the target. If 𝑠𝑠𝑠𝑠𝑠𝑠 𝐷𝐷𝑖𝑖 , 𝐷𝐷𝑗𝑗 𝜆𝜆 is in 𝜆𝜆, the learner 𝑑𝑑𝑖𝑖 can represent the learner𝑑𝑑𝑗𝑗 and call it 𝑟𝑟𝑟𝑟𝑝𝑝𝜆𝜆 𝑑𝑑𝑖𝑖 , 𝑑𝑑𝑗𝑗 1; If 𝑠𝑠𝑠𝑠𝑠𝑠 𝐷𝐷𝑖𝑖 , 𝐷𝐷𝑗𝑗 𝜆𝜆, there is no representation between learner 𝑑𝑑𝑖𝑖 and learner 𝑑𝑑𝑗𝑗 . Thenwe called it as 𝑟𝑟𝑟𝑟𝑝𝑝𝜆𝜆 𝑑𝑑𝑖𝑖 , 𝑑𝑑𝑗𝑗 0. This is based on the learner similarity matrix 𝑀𝑀 to represent the matrix 𝑀𝑀𝜆𝜆 . Thenumber of representative learners calculated by 𝑑𝑑𝑖𝑖 and 𝜆𝜆 is 𝐷𝐷𝑖𝑖𝜆𝜆 {𝑑𝑑𝑘𝑘 𝑠𝑠𝑠𝑠𝑠𝑠(𝑑𝑑𝑖𝑖 , 𝑑𝑑𝑘𝑘 ) 𝜆𝜆, 𝑑𝑑𝑘𝑘 𝐷𝐷}. The initial set of thelearner’s data set, the Page Rank of each subset of D, is 1. If one of the learner 𝑑𝑑𝑗𝑗 is in the representative set 𝐷𝐷𝑖𝑖𝜆𝜆 thatcorresponds to the target learner, the learner can vote on 𝐷𝐷𝑖𝑖𝜆𝜆 and figure out how many times he appears that is 𝑛𝑛𝑗𝑗 .Then 𝑑𝑑𝑗𝑗 has 𝑣𝑣𝑣𝑣𝑣𝑣𝑒𝑒𝑗𝑗𝑖𝑖 votes for𝐷𝐷𝑖𝑖𝜆𝜆1𝑛𝑛𝑗𝑗for each of the delegates. The sum of all the votes cast by the votes for each round of theis obtained as 𝑣𝑣𝑣𝑣𝑣𝑣𝑒𝑒𝑖𝑖 𝑑𝑑𝑗𝑗 𝐷𝐷 𝑣𝑣𝑣𝑣𝑣𝑣𝑒𝑒𝑗𝑗𝑖𝑖 𝑟𝑟𝑟𝑟𝑝𝑝𝜆𝜆 𝑑𝑑𝑖𝑖 , 𝑑𝑑𝑗𝑗 𝑑𝑑𝑖𝑖 𝐷𝐷 𝑟𝑟𝑟𝑟𝑝𝑝𝜆𝜆 (𝑑𝑑𝑖𝑖 , 𝑑𝑑𝑗𝑗 )/𝑛𝑛𝑗𝑗 . The sum of the total votes isthe representative learner that the target person recommends the course resources. The pseudo-code is extractedbased on the representative information of Page Rank as following shows: the input item is Learner data set is 𝐷𝐷 (𝑑𝑑1 , 𝑑𝑑2 , , 𝑑𝑑𝑛𝑛 ), representative coefficient is 𝜆𝜆, parameter is 𝑎𝑎 [0, 1]. The output item is 𝑅𝑅𝑠𝑠𝑠𝑠𝑠𝑠𝑠𝑠𝑠𝑠 () 𝑅𝑅 , it meansmake a statement on the representative set of learners, 𝑀𝑀[] compute Similarity (𝐷𝐷), it means Calculate thesimilarity to get the matrix M. 𝑀𝑀𝜆𝜆 [][] Compute represent(M), it means the matrix 𝑀𝑀𝜆𝜆 is represented by a givenrepresentation coefficient. 𝐷𝐷 𝜆𝜆 [] Compute represent sets(𝑀𝑀𝜆𝜆 ), it comes up with a collection of representativelearners. 𝑉𝑉𝑉𝑉𝑉𝑉𝑉𝑉[] Compute vote value(𝑀𝑀𝜆𝜆 , 𝐷𝐷𝜆𝜆 ), it means to calculate the number of votes per representative set.5680
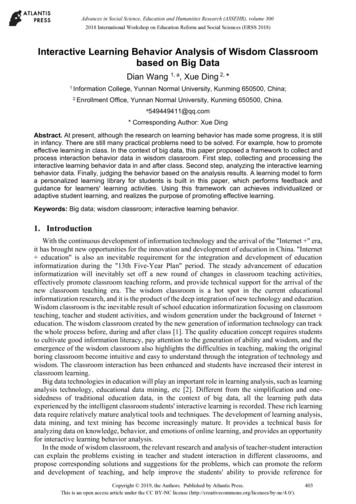
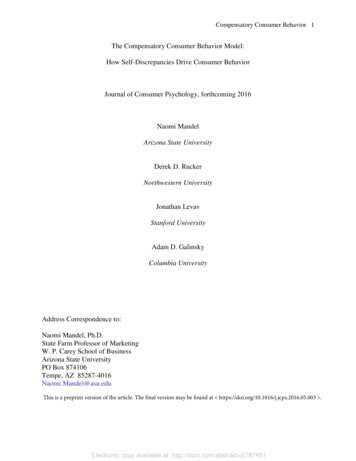
EURASIA J Math Sci and Tech EdOnline learningusersOnline Collect and processinformationRelease informationand communicationCollect and dateAssimilationCollect and processinformationTo solve sk questionsFigure 3. The process of online learning behaviorMax vote value Find max(𝑣𝑣𝑣𝑣𝑣𝑣𝑣𝑣), it means to find the maximum number of votes. With online learning behaviordata have big data characteristics, the behavior of large amount of data and variety, use only pure Page Rank typicallearner information extraction algorithm can cause algorithm is slow, take great response processing time.Therefore, in the context of big data, the core Map Reduce framework in cloud computing is introduced to improvethe efficiency of the representative learners. The map function in the map reduce framework, by constructing〈𝑘𝑘𝑘𝑘𝑘𝑘, 𝑣𝑣𝑣𝑣𝑣𝑣𝑣𝑣𝑣𝑣〉, breaks the data into separate chunks of data, and calculates the number of of each index set and thenumber of votes. The Reduced function is then combined by the same key value to calculate the number of votes.The existing Map Reduce parallel processing technology is developed by using open source source code on Hadoopto enable the implementation of the Page Rank algorithm.(3) The association rule analysis of online learning behavior and learning effects. Online learners’ learningeffect is affected by many learning behavior factors, in order to in-depth to explore the influence factors of learningeffect, need to reflect the whole learning process of a large number of data mining and analysis. In order to analyzethe relationship between behavior and effect, the learning process needs to be resolved. In the current study,learning behavior mostly based on the “registration, along with the test, homework, listening to lectures, classdiscussion, examination, certificate” of the basic flow, specific online learning process is shown in Figure 3. In thecourse of online learning, the learning behavior itself is ambiguous, and the behavior object does not exist. Arelationship is only a general or special relationship. For the properties of such objects, the need for a fuzzy bold isrequired. The rough set is processed, but it is similar to the classic rough set model, which is susceptible to noisedata. Therefore, scholars have established the VPFRS model to solve the above problems. The improved model candeal with the data object of the fuzzy system and greatly improve the anti-interference ability, but it is affected bythe change of the parameter value. In this paper, with the aid of fuzzy implication operator classic set contains5681
W. Peng / Research on Online Learning Behavior Analysis Model in Big Data EnvironmentTable 3. Study the sample information collectionSerial numberMember ID11509****0821503****1031409****1441507****21 6991503****097001409****31R5401 226F12210 5293L73030 287609promotion for fuzzy contains degrees, based on the fuzzy contains degrees, the priori probability, Bayesian fuzzyrough set model is set up. Definition 1: The classic set contains the degree which is 𝐶𝐶(𝐴𝐴 𝐵𝐵) 𝐴𝐴 𝐵𝐵 𝐴𝐴 , 𝐴𝐴 . Thisformula describes the proportion of the elements in set A that are contained in the set B. Definition 2: If U is alimited non-empty set, 𝐼𝐼 [0, 1], 𝜃𝜃 is arbitrary function, then we called mapping 𝐷𝐷: 𝐹𝐹(𝑈𝑈) 𝐹𝐹(𝑈𝑈) 𝐼𝐼 is the Fuzzy 𝑥𝑥 𝑆𝑆(𝐴𝐴) 𝜃𝜃 𝐴𝐴(𝑥𝑥),𝐵𝐵(𝑥𝑥) contains, we can conclude the following formula 𝐷𝐷(𝐴𝐴, 𝐵𝐵) 𝑆𝑆(𝐴𝐴) 1, 𝐴𝐴 , 𝐴𝐴 We called 𝐷𝐷(𝐴𝐴, 𝐵𝐵) is the A is the B blur of 𝜃𝜃. 𝜃𝜃 is the intersection between 𝜃𝜃 𝐴𝐴(𝑥𝑥), 𝐵𝐵(𝑥𝑥) 1 (1 𝐴𝐴(𝑥𝑥) 𝐵𝐵(𝑥𝑥)) and 𝑆𝑆(𝐴𝐴) {𝑥𝑥 𝑈𝑈 𝐴𝐴(𝑥𝑥) 0 }. Definition 3: If U is a finite non-empty domain, 𝜃𝜃 {𝐶𝐶1 , 𝐶𝐶2 , , 𝐶𝐶𝑘𝑘 } is the fuzzycovering of U, then we called 𝐸𝐸 (𝐹𝐹(𝑈𝑈), 𝜙𝜙, 𝐷𝐷)is the Fuzzy contains approximate space. If (𝑋𝑋 𝐹𝐹(𝑈𝑈)), 𝑃𝑃(𝜃𝜃1 ) 𝜃𝜃1 / 𝑈𝑈 , then we have 𝑃𝑃(𝑋𝑋) max(𝑃𝑃(𝜃𝜃1 )), and 𝑃𝑃(𝑋𝑋) (0.5, 1). Then we can conclude the following conclusions:𝑖𝑖𝐸𝐸𝑃𝑃(𝑋𝑋) (𝑋𝑋) 𝑈𝑈{𝐶𝐶𝑖𝑖 𝜃𝜃 𝐷𝐷(𝐶𝐶𝑖𝑖 , 𝑋𝑋) 𝑃𝑃(𝑋𝑋)} and 𝐸𝐸1 (𝑋𝑋) 𝑈𝑈{𝐶𝐶𝑖𝑖 𝜃𝜃 𝐷𝐷(𝐶𝐶𝑖𝑖 , 𝑋𝑋) 1 𝑃𝑃(𝑋𝑋)} is the above model positivedomain. Based on the above caculations, this paper using IDB - BRS model in this paper, attribute reduction,reduction of the theory and algorithm, and by using the experimental data validated the reduction algorithm isreasonable and effectiveness. Before caculate we shoule make following definations. Definition 1: if 𝑆𝑆 (𝑈𝑈, 𝐴𝐴, 𝑉𝑉, 𝐹𝐹) is the fuzzy decision information system, and the fuzzy set of properties is 𝐵𝐵 {𝑏𝑏1 , 𝑏𝑏2 , , 𝑏𝑏𝑚𝑚 }, then the2 1/21𝑥𝑥𝑖𝑖 and 𝑥𝑥𝑗𝑗 similarity is 𝑅𝑅𝐵𝐵 𝑥𝑥𝑖𝑖 , 𝑥𝑥𝑗𝑗 1 𝑚𝑚𝑘𝑘 1 𝑥𝑥𝑖𝑖𝑖𝑖 𝑥𝑥𝑗𝑗𝑗𝑗 𝑚𝑚. Definition 2: if 𝑆𝑆 (𝑈𝑈, 𝐴𝐴, 𝑉𝑉, 𝐹𝐹) is the fuzzy decisioninformation system, we mark the 𝑈𝑈/𝐵𝐵 (𝐵𝐵1 , 𝐵𝐵2 , , 𝐵𝐵𝑁𝑁 ) and 𝑈𝑈/𝐷𝐷 (𝐷𝐷1 , 𝐷𝐷2 , , 𝐷𝐷𝑁𝑁 ) is the fuzzy similar relationshipbetween B and D. The 𝐵𝐵𝑖𝑖 [𝑥𝑥𝑖𝑖 ]𝐵𝐵 and 𝐷𝐷𝑗𝑗 [𝑥𝑥𝑖𝑖 ]𝐷𝐷 is the similarity covering of 𝜙𝜙 {𝐶𝐶1 , 𝐶𝐶2 , , 𝐶𝐶𝑘𝑘 }. If 𝐷𝐷𝐹𝐹 is the fuzzy setcontains degrees of 𝑈𝑈, then we called 𝐸𝐸 (𝐹𝐹(𝑈𝑈), 𝜙𝜙, 𝐷𝐷)is the fuzzy contains approximate space. Definition 3: if U isthe theoretical domain, 𝑈𝑈 {𝑥𝑥1 , 𝑥𝑥2 , , 𝑥𝑥𝑛𝑛 } and 𝐸𝐸 (𝐹𝐹(𝑈𝑈), 𝜙𝜙, 𝐷𝐷) is the fuzzy contains approximate space. Then we12 1/2can conclude that 𝜌𝜌(𝐴𝐴, 𝐵𝐵) 𝑛𝑛𝑖𝑖 1 𝐴𝐴(𝑥𝑥𝑖𝑖 ) 𝐵𝐵 𝑥𝑥𝑗𝑗 𝑛𝑛is the degree of separation between A and B.(4) Empirical research on online learning platform of China Business Executives Academy, Dalian(CBEAD). The results extracted from the data collected from the previous text were collected from the leadershipcourse. This includes the beginning of the course. Study data for the period of May 9, 2017. In order to ensure theobjective and effective results of the experiment, 700 learners were randomly selected. Each learner’s learning ismeasured in terms of learning frequency, learning frequency and length of study. The data corresponding to theindex. Partial statistics are shown in Table 3.Former the K means clustering algorithm based on the steps, the indicators for access to study data werenormalized processing, objective method of entropy value method to determine index weight. By calculation, theweight of learning index was 0.225, the learning frequency weight was 0.564, and the learning length weight was0.211. Learners in determining the next category on the basis of the number is 8, with the aid of mathematicalstatistics software SPSS to K - means the operation of the clustering process, finally it is concluded that belongs tothe eight types of learners of the course, divided into categories as shown in Table 4.5682
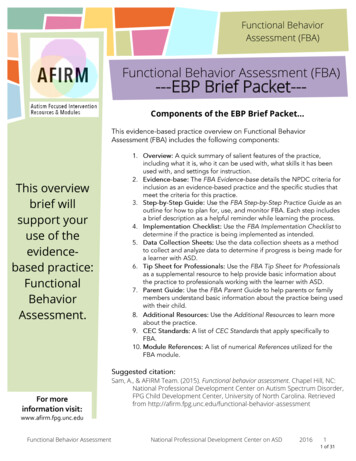
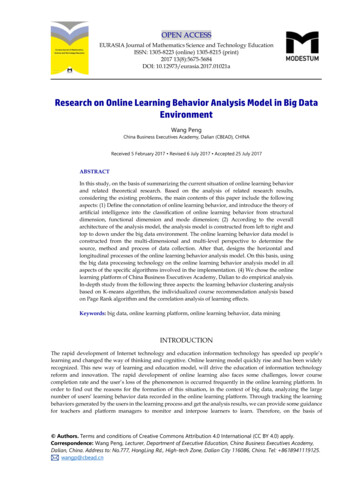
EURASIA J Math Sci and Tech EdTable 4. The class of learners generated by clustering analysisCategoryNumberRFLCompare the results12330.4140.0740.496R F L 2391.0000.5260.281R F L 3260.8690.9310.817R F L 4810.0880.0250.119R F L 5580.4310.9690.293R F L 6750.0510.1030.955R F L 7360.7430.1890.881R F L 81520.8310.0930.22R F L The overall7000.510.1940.29118.11%User levelimportant developmentgeneral importantImportant to retainwatchersImportant to keepimportant developmentGeneral learnersworthlessA:important development70.84%35.22%B:General importantC:General learnersD:Important to keep5.63%E:Important to gure 4. The proportion of learners at all levelsIt can be seen from the above analysis results of each learner categories index average difference is verybig, in order to get accurate classification of learners will all kinds of don’t comparing with overall average index.Final experiment seven levels of online learners, respectively defined as important development, Generalimportant, General learners, Important to keep, Important to retain, worthless, watchers. Use the pie chart in Excelto visualize a number of other people, as shown in Figure 4.CONCLUSION AND RECOMMENDATIONBased on the analysis of big data environment based on the main problems of online learning, on the basisof behavioral science and artificial intelligence theory of the concept and classification of online learning behavioris defined, the analysis of the large data online learning behavior under the environment of associated factors, buildonline learning behavior analysis model, design from behavioral clustering, personalized recommendation andassociation rule mining process of longitudinal analysis of online learning behavior. Finally chose China BusinessExecutives Academy, Dalian (CBEAD) online learning pl
analysis of online learning behavior, first identify the classifications and make a cluster operation. For personalized course recommended analysis, to determine the target users are learning cluster, and learn toAuthor: Wang Peng