Transcription
THE INTERNET OF THINGSTrends, Technologies, and OpportunitiesSteve KoenigSr. Director, Market Research
Internet of Things is more than a trend.It’s a connected revolution fostering a globalshift in the way we live, work and play.Industrial RevolutionIoT Revolution
Technology’s Magnificent Seven2017 Global Tech Spending 81%754 Billion USD
2017 Global Connected Device Spending 88%827 Billion USD
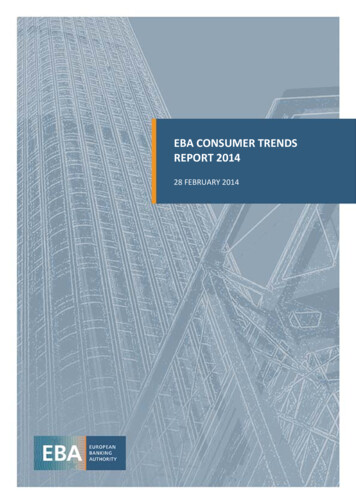
How many IoT devices worldwide?2020 - Gartner: 20.4 billion2020 - Cisco: 26.3 billion2020 - IHS Markit: 30.7 billion2021 - Juniper: 46 billionDEVICESFUTURETECH2022 - Ericsson: 29 billion2025 - IHS Markit: 75.4 billionSources:Ericsson: Nov 2016 Mobility Report ; Gartner: 2017 Press Release; IHS Markit: Whitepaper, March 2016; Juniper: 2016 Press Release; Cisco: VNI Forecast
Devices represent the visible part of the IoT ‘spectrum’.
APAC Region: Top Five Tech per #4Digital 91%#5Headphones83%#1Digital camera Feature phone Feature phone80%88%85%Source: CTA Asia-Pacific Tech Adoption Study, May 2016Tablet87%* Among Online adults
Smartphones: The Heart of IoTGlobal Mobile Spending (USD 03794013%3%4316%4320%6120125%0%100Standard50Phones 16fcst2017fcst-5%-10%
Spartan Boxer BriefGear S3 smartwatchVPS 16 eye-tracking glasses
Global Wearables Market In High Gear(Units in Millions)3OthersWrist Sport ComputerSmartwatchHealth & Fitness Trackery/y 0152016fcst2017fcst
Digital Assistants: Personification of IoTTodayTomorrow
Assistance EmbeddedC Lamp by GESamsungPowerbot VR7000Lenovo Smart AssistantC-WayMemooNvidiaSpotSomfyOne
Alexa: Rapidly Moving Beyond DevicesFord Motors ties up with Amazon’s AlexaLG Smart InstaView Refrigerator
Home Theater: Then & Now
AVR Feature Importance: %Smartphone or tablet connectivityWireless components (such as a wireless sub-woofer or surroundsound speakers)62%59%USB connections55%Number of HDMI inputs45%Multi-room system capability42%Built-in streaming services39%Support for other audio/video inputs (e.g., optical audio or S-video)Airplay-enabledSource: CTA, State of the Home Audio Theater, October 201615%
The Next Decade Now
5G Connectivity: Coming Soon Higher speed, greater capacity, lower latency Potentially 40 times faster; some say 25-30 Gb/second Several wireless companies investing in development Ingredient technology:Smart CitiesSelf-Driving CarsWireless VR
5G:How fast is it?
5G Deployment: Trend Impact Key ‘ingredient’ technology Much deeper impact than personal mobile device pursuits Connected workforce Smart Cities New business models
Japan Targets 2020 for 5G Deployment 2020 launch targeted by Ministry of Internal Affairs andCommunication. Opportunity for Japan to market its 5G standards workglobal community. R&D tests proceeding in Japan.to
Two Approaches to AutonomyDriver Assist Technologies Evolution of singular ADAS featuresSAE Levels 1 and 2Automated DrivingStep-by-Step approachExisting automotive strategySelf-Driving Vehicles Future of MobilitySAE Levels 3, 4 and 5Self-Driving - No operator requiredRequires advanced robotics and AIPursued by tech industry
The Evolution of Self-Driving CarsSAE LevelsLevel 5Fully Autonomous VehicleDriverless door-to-doorLevel of AutonomySelf-DrivingCarsLevel 4Highly Autonomous VehicleDriverless in certain areasDriverAssistTechLevel 3Conditional AutonomyFull automation on a highway –driver required to resume controlLevel 2Partial AutonomyFull automation within a laneLevel 1Active (control-based) ADAS SolutionsActive lane keeping, adaptive cruise control, automatic emergency braking, etc.2010201520202025203020352040
Japan Wants Self-Driving Cars for 2020 Olympics Government to soon release guidelines. Road tests of driverless trucks, taxis and buses planned forthis year. Seen as key technology in Japan’s ‘graying’ economy.
Drones: Flying HighA drone test conductedin Hyogo Prefecturelast October.
Drones: What’s all the Buzz? Commercial / Industrial Uses explored in Japan. 2017 CES Trend: Object detection and avoidance Drones and privacy: citizen concerns Japan: TEPCO, Zenrin to develop drone ‘highways’ alongpowerlines.
Artificial IntelligenceSmarter than you think! Beyond IoT – Adding Intelligence Deep Learning Software learns from data (i.e., experience) Neural Networks Processing devices from algorithms to hardware Japan’s Abe: No Fear!
Terminator image
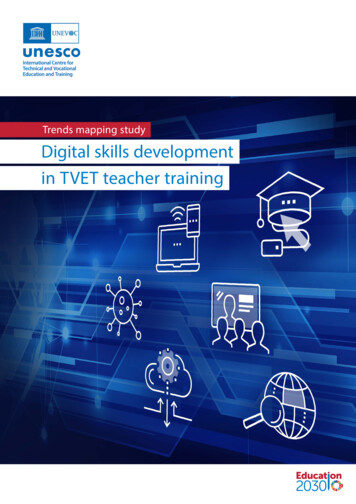
What can AI do?The machine learningdesigned version on the rightaccomplishes the samearchitectural goal but weighs75% less.This is a cable harness used for suspension bridges.All of three versions can carry the same structural loads and forces.
Artificial Intelligence: Trend Impact AI will take on all kinds of tasks, such as those we:Don’t care to do Can’t do Need all the help we can get Data as (artificial) brain food Greater AI integration will generate societal impacts
Robotics in the Consumer MarketMayfield RoboticsKuriUbtech LynxLekaLG Robots at CESHub RobotBlack and DeckerSmartech Robot VacAirbotLawn Mowing Robot
Witness the ‘Robotic Revolution’From Honda’s Asimo To Toshiba’s Aiko
Robotics: Trend ImpactQuickly Moving Beyond Simple Tasks THEN: Task oriented: mowing, cleaning windows/floors, foldingclothes etc. NOW: Service Oriented: Companion/Service Robots Voice activated: Mobile and conversant with ability to take videos,pictures, monitor home and in some cases make a purchase online. Kid Friendly: Features to engage kids to learn and play. Robotics personify automation.
Smart Cities: The Next Big Thing70% of the world's populationGlobal Spending on Smart Cities (Billions USD) 34.35forecast to live in cities by 2050Global Smart City Programs 14.852013170201623520152020e
The Case for Smart Cities Urban centers increasingly difficult to monitor/manage Better, more-timely information better choices Optimization of public safety and services Reducing traffic congestion Less pollution Competitive economic advantagesMassive Challenges exist: Market-based, Organizational, Political leadership
Smart Cities: The Greatest Expression of IoT IHS predicts there will be 88 Smart Cities worldwide by 2025,with 32 of them in Asia. In the U.S. cities must cope with legacy infrastructure andother systems. Integrating digitally connected systems into city infrastructurecreates new pathways for adversaries to exploit. Privacy and ethics issues on a massive scale
Biometrics: Evolution of Human–Machine Interaction
THE INTERNET OF THINGSTrends, Technologies, and OpportunitiesSteve KoenigSr. Director, Market Research@KoenigSteve
Smartphone OwnershipInstalled Base GrowthHHPenetration80%238 Million 6ptsfrom 2016(2017)104 Million(2012)2.5Avg. Units/Owner HH238MInstalled Unit BaseSource: CTA, 19th Annual CT Ownership and Market Potential Study33%HH Purchase Intent
Connected Consumer Devices ForecastU.S. Shipment Volumes (millions)Sources: CTA Market Research, March 2017 Estimate. Connected products includes, in order of 2020 sales volume: Smartphones, Tablets, Fitness Trackers, Notebook PCs, Portable Wireless Speakers, Internetenabled TVs, Bluetooth Headsets and hands-free car kits, Wireless Headphones, Home Gaming Consoles, Smart home systems, Streaming Media Players, Desktops, Digital assistants, Printers, IP/Wi-Fi cameras,Connected thermostats, Standard Cellphones, Smartwatches, Soundbars, Connected switches, dimmers and outlets, Smart locks and doorbells, Other Health and Fitness Devices, Pet Technology, e-readers,Connected e-toys, Smart smoke/CO detectors, Hearables, Blu-ray players, Aftermarket head units with Bluetooth audio, Action Camcorders, Portable Gaming Consoles, Wireless MRAV, Portable Media Players,VOIP equipment, 360 Cameras, Digital cameras, A/V Receivers with network/Internet connectivity, Home Radios with Internet connectivity.
Digital AssistantsU.S. Volume Shipment Forecast13,2589,5822017 U.S. HH 92020
Smart Home Technology DevicesIncludes lighting controls, door locks, motion sensors, etc.Excludes cameras and thermostats2017 HH Penetration 4pts from 20162.7Avg. Units/Owner HH51MInstalled Unit Base14%HH Purchase Intent
Home Technology Products: OwnershipHome Technology Products% of U.S. Households2014 2015Other smarthome device, such as lightingcontrols, door lock controls, motionsensors, etc.Smart home security cameraSmart thermostatNumberInstalledOwner HHs Unit Base*Avg. UnitsPer Owner 512.72.0-3%-5%-6%14%8%1732--10121.91.42017 U.S. HH ownership1.4
Home Technology Products: Purchase IntentHome Technology ProductsHouseholds Planning toPurchase in 2017% of HH BuyersFirst-Time20171%# (Millions)Repeat2017Other smarthome device, such aslighting controls, door lockcontrols, motion sensors, etc.14%16.6642%58%64%Smart home security camera13%15.4728%Smart thermostat7%8.3311%72%89%-83%First-Time20161
2017 IoT Product Ownership / Purchasing Stats:Multiple Consumer Technology CategoriesChange in penetrationbetween 2016 to 20171U.S. household Installed base: In millions1Smartphone238140Portable wireless speakers105Internet enabled TV77Digital media streaming device43Fitness tracker32Smart home security cameraSmartwatch21Other smart home devices194KUHD TV212Smart thermostatDigital assistant1CTA1929 Audio technologyVideo technologyWearable technologyHome technologyU.S. household intentto purchase in 20171 6%pts33% 6%pts16% 4%pts16% 2%pts16% 4%pts14%N/A13% 4%pts10% 4%pts14% 9%pts11% 2%pts7%N/A9%Consumer Technology Ownership and Market Potential Report, 20172 CTA estimate of Installed Base for 4KUHD TV and Digital assistant Cumulative Unit Sales to date from CTA Consumer Technology Sales and Forecast Report, January 2017Ownership and purchase intent of digital assistant and smart home security camera were asked for the first time in 2017 Ownership and Market Potential study
Wearable Technology Product OwnershipWearable TechnologyProduct% of U.S. Households2014Wearable activity fitness trackerSmartwatch5%--NumberInstalledOwner HHs Unit BaseAvg. UnitsPer Owner HH2015 443211.51.51.41.420%8%2017 U.S. HH ownershipSource: CTA, 19th Annual CT Ownership and Market Potential Study
In-Vehicle Communication and Safety System2017 HHPenetration1.5Avg. Units/Owner HH80MInstalled Unit BaseSource: CTA, 19th Annual CT Ownership and Market Potential Study9%HH Purchase Intent
Smart CityInvestmentsIn the U.S.Indicates the seven finalists for theU.S. Department of Transportation’sSmart City Challenge (Dec 2015)
Smaller Screens Bigger Viewing ProfileAverage Share of Video Viewing on Each 21%62%Tablet12%16%5%Source: The Evolving Video Landscape (2012)Source: 2016 Video Study Q3. What percent of your video watching is done on the following devices? Base: Online U.S. Adults (n 1,000)8%14%Other7%2%3% 1%
Top 10 Connected Devices ForecastU.S. Shipment Volumes (000s)Excludes ‘hub’ devices213,088193,554171,482147,249Smart Switches & OutletsSmart ThermostatsMedia Streaming DevicesSmart Home KitsHome Gaming ConsoleWireless HeadphonesInternet-enabled TVPortable Wireless SpeakersDigital AssistantsFitness Trackers122,86695,210201520162017Source: CTA Consumer Technology Extended Forecasts 2015-2020 (January 2017)201820192020
Global Consumer Tech Unit Sales Leveling Off(in st 2017fcst
Today’s Battle for the Living Room?U.S. HH Penetration 201715%20132014Connected TV2015Media PlayersSource: CTA, 19th Annual CT Ownership and Market Potential Study
Connected Video Products Ownership Connected TVMedia Streaming Device54% HH penetration( 4pts from 2016)36% HH penetration( 2pts from 2016)Avg. Units/Owner HH1.71.8Installed UnitBase105M77MHH PurchaseIntent16%16%Source: CTA, 19th Annual CT Ownership and Market Potential Study57
Nvidia’sAI CoPilot
Global Consumer Tech Spending(Billions of USD)1,005Values 015ConnectedDevice Share89%-10%2016fcst 2017fcst 827Billion USD
2020 - Gartner: 20.4 billion 2020 - Cisco: 26.3 billion 2020 - IHS Markit: 30.7 billion 2021 - Juniper: 46 billion 2022 - Ericsson: 29 billion 2025 - IHS Markit: 75.4 billion Sources: Ericsson: Nov 2016 Mobility Report ; Gartner: 2017 Press Release; IHS Markit: Whitepaper, March 2016; Juniper: 2016 Press Release; Cisco: VNI Forecast