Transcription
Tanzania: 2020 Supply Chain ModelingForecasting Demand from 2020–2024SEPTEMBER 2011This publication was produced for review by the U.S. Agency for International Development. It was prepared by theUSAID DELIVER PROJECT, Task Order 1.
Tanzania: 2020 Supply ChainModelingForecasting Demand from 2020–2024The authors' views expressed in this publication do not necessarily reflect the views of the U.S. Agency forInternational Development or the United States Government.
USAID DELIVER PROJECT, Task Order 1The USAID DELIVER PROJECT, Task Order 1, is funded by the U.S. Agency for InternationalDevelopment under contract no. GPO-I-01-06-00007-00,beginning September 29, 2006. Task Order 1 isimplemented by John Snow, Inc., in collaboration with PATH; Crown Agents Consultancy, Inc.; AbtAssociates; Fuel Logistics Group (Pty) Ltd.; UPS Supply Chain Solutions; The Manoff Group, Inc.; and 3iInfotech. The project improves essential health commodity supply chains by strengthening logisticsmanagement information systems, streamlining distribution systems, identifying financial resources forprocurement and supply chain operations, and enhancing forecasting and procurement planning. The projectalso encourages policymakers and donors to support logistics as a critical factor in the overall success of theirhealth care mandates.Recommended CitationUSAID DELIVER PROJECT, Task Order 1. 2011. Tanzania: 2020 Supply Chain Modeling—ForecastingDemand from 2020–2024. Arlington, Va.: USAID DELIVER PROJECT, Task Order 1.AbstractIn 2010, LLamasoft, Inc., with technical assistance from the USAID DELIVER PROJECT, Task Order 1,developed a modeling framework that could be used to forecast public health supply chain needs and toenable policymakers to strengthen the logistics infrastructure when they are planning future needs.To understand and analyze the current and future state (2020–2024) of supply chain requirements forprocuring and distributing essential medical commodities in Tanzania, after the pilot was applied in Kenya,the model was applied for the second time in Tanzania. Any country, at any future time, can use thedeveloped methodology in this report.Cover photo: Clients wait outside a health dispensary in Tanzania. 2009. USAID DELIVER PROJECT.USAID DELIVER PROJECTJohn Snow, Inc.1616 Fort Myer Drive, 11th FloorArlington, VA 22209 USAPhone: 703-528-7474Fax: 703-528-7480Email: askdeliver@jsi.comInternet: deliver.jsi.com
ContentsAcronyms. vAcknowledgments . viiExecutive Summary . ixBackground. 1Project Objectives . 1Modeling Framework. 1Future State Scenario . 3Methodology . 5Data Collection . 5Tanzania Supply Chain Structure Background . 6Baseline and Future Projection Assumptions. 8Quantification Analysis . 8Key Findings . 11Current State Analysis.11Future State Analysis.14Health Model Scenarios .19Conclusion. 23AppendicesA. Resources Used for Material Requirements Model. 25B. Prevalence and Treatment Rates . 29C. Composition of Medical Zones . 49D. Sources of Health Model Changes . 53Figures1. Visual Overview of the Interdependent Model Framework. 32. Map of Tanzanian Medical Zones . 73. Current Network Structure in Tanzania .114. 2011 Optimized Direct Delivery .135. 2011 Transportation Cost Comparison.146. Breakdown of Costs .157. Comparison of Transportation Costs .168. 2020 Optimized Costs with Direct Delivery .179. Locations of Additional Hubs. 28iii
Tables1. Change in Cost Elements per Baseline .152. 2005-2050 Assumed Tanzania CPR Rates .203. Number of HIV Cases Averted .21iv
Acronyms3PLthird party logistics providerCWHCentral WarehouseDCDistribution CenterGPSglobal positioning systemQALYquality-adjusted life yearRWHRegional WarehouseSSASub-Saharan AfricaTSHTanzanian shillingUSDUnited States dollarAIDSacquired immunodeficiency syndromeARVantiretroviral (drug)CPRcontraceptive prevalence rateDALYdisability-adjusted life yearDMODistrict Medical OfficerHIVhuman immunodeficiency virusITinformation technologyJSIJohn Snow, Inc.MDGMillennium Development GoalsMOHMinistry of HealthMSDMedical Stores Department (of Tanzania)MSHManagement Sciences for HealthORSoral rehydration solutionPEPFARU.S. President’s Emergency Plan for AIDS ReliefSDPservice delivery pointSTIsexually transmitted infectionTBtuberculosisUNUnited NationsUSAIDU.S. Agency for International DevelopmentWHOWorld Health Organizationv
vi
AcknowledgmentsThe project team would like to thank the staff at John Snow, Inc. (JSI), for their guidance andsupport, including the staff in the U.S. offices, as well as the JSI staff members working in thecountry office in Tanzania. Without their help, this study would not have been possible. The teamwould also like to thank the staff of the Medical Stores Department (MSD) of Tanzania forproviding us with most of the data used in this project. The U.S. Agency for InternationalDevelopment (USAID) contracts funded the technical assistance, in-country projects, and researchthat enabled the authors to produce this report.vii
viii
Executive SummaryIn the developing world, logistical shortcomings can seriously impact the quality of humanhealthcare. Because of this, the USAID DELIVER PROJECT partnered with LLamasoft, Inc., todevelop a reusable modeling framework that could be used to forecast developing countries’ futurepublic health supply chain needs. The model was designed to be robust and general; this ensuredthat it could be applied to any country, for any future timeframe, and could give policymakers keydata to guide the effective design of their supply chain networks. In 2010, the framework was pilotedin Kenya for 2020–2024; the goal was to show how the modeling approach could help policymakersaccurately visualize and understand the most likely and possible situations they might face in 10years. This report covers a similar application of the framework in Tanzania.To accomplish the project objectives, the relationships between key public health variables weremodeled; including population, disease prevalence, and economic conditions; and the resultingrequirements for health supply material. The modeling framework included three separate, butinterlinked, models: (1) a Health Model for predicting the future location and quantity of treatablehealth conditions of interest, (2) a Material Requirements Model for translating the project healthconditions into delivery needs for the supply system, and (3) a Supply Chain Model to generatemetrics of interest by modeling the pull and flow of generated material requirements through adefined supply chain network.During the time of the study, the medical delivery system in Tanzania was going through severalstructural changes. Therefore, the timing of the analysis was crucial for Tanzania’s Medical StoresDepartment (MSD)—they had to assess the supply chain network changes that needed to be made ifthe changes were to be successfully implemented. At the request of the executive management teamat the MSD, several near-term (six months to one year) changes to the system were also analyzed.This study focuses on the transportation challenges that the MSD will face, both in the near termand long term, as a result of the implementation of the new system, Direct Delivery. The newdelivery system changes added the responsibility for last mile distribution to the MSDs list ofactivities; previously, the health facilities completed this task.From the study, the authors determined that the current delivery structure, based on administrativeboundaries, provided an ineffective customer-to-warehouse assignment. Health facilities were beingserved by their assigned warehouses, or the warehouse that had the necessary capacity, instead of thewarehouse that was closer. When Direct Delivery was implemented, it was expected that asignificant portion of the costs would shift from the health facilities to the MSD; the results showthat by optimizing the customer-to-warehouse assignments, the MSD could reduce thetransportation costs 14–17 percent. The study also shows that even if supplies for various verticalprograms are still donated, they cannot be effectively delivered without significant investments inwarehousing and transportation assets. If the delivery of these products is mandated, other essentialhealth supplies will be rationed and this will negatively impact the general health of the population.The main conclusion is that if the increased demand is not addressed, most of the public sector willnot be serviced, resulting in a loss of life. It is essential that stakeholders understand the importanceof investing in the supply chain network.ix
x
BackgroundPublic health supply chains deliver essential medical commodities to underserved communities inthe developing world. Therefore, logistical weaknesses can seriously impact the quality of humanhealthcare. In some cases, it can mean the difference between life and death. By strengthening theexisting supply chain systems, essential commodities are more availability to health care providersand consumers, which results in improved health for communities in underserved areas. Today,health needs have increased because of the world’s growing population and the changing diseaseburden; it is imperative that public health systems ensure cost effective and reliable supply chains tomeet those demands.The USAID DELIVER PROJECT, in collaboration with LLamasoft, Inc., has undertaken the2020 Supply Chain Modeling project as a way to develop a reusable framework to forecastdeveloping countries’ public health supply chain needs for the future. The 2020 model can beapplied quickly to any country, for any future timeframe. This will help policymakers accuratelyvisualize and understand the most likely and possible situations that they may face, and how to makeinformed decisions about designing effective supply chains to meet those demands. In 2010, theframework was piloted in Kenya for 2020–2024, with the goal of showing how the modelingapproach can be used to help policymakers accurately visualize and understand the most likely andpossible situations that may face them in 10 years. In 2011, the framework was applied for thesecond time in Tanzania. This report explains the findings and results.Project ObjectivesThe goal of this project was to predict future supply chain needs and performance metrics over fiveyears (2020–2024) in order to inform Tanzanian policymakers and to improve their long-termstrategic planning processes.The three main objectives were—1. To develop the three interlinked models by applying the previously created framework: a healthmodel, a material requirements model, and a supply chain model.2. To understand and analyze the current and future (2020–2024) supply chain requirements forprocuring and distributing essential medical commodities in Tanzania by applying the health,material requirements, and supply chain models.3. To determine the most pressing needs for revamping the supply chain network in Tanzania byapplying multiple future state scenarios to the modeling framework.Modeling FrameworkThe approach for this study used a modeling framework that comprised three separate, butinterlinked, models: (1) a Health Model for predicting the location and quantity of treatable healthconditions of interest in the future, (2) a Material Requirements Model for translating the healthconditions into delivery needs for the supply system, and (3) a Supply Chain Model that generates1
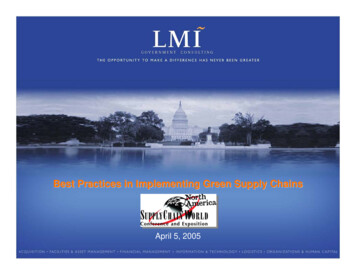
metrics of interest by modeling the pull and flow of generated material requirements through adefined supply chain network. To forecast the essential health commodities, we analyzed therelationships between the three interdependent models.Health ModelIn response to the United Nation’s Millennium Development Goals (MDGs) 4, 5, and 6 (childhealth, maternal health, and combat HIV and AIDS, respectively), the conditions emphasized thehealth model that included reducing child mortality; improving maternal health; and combating HIVand AIDS, malaria, and other serious diseases, with the longest-term detrimental effects on humanlifetime potential. Conditions modeled for reducing child mortality included measles, vitamin Adeficiency, diarrhea, worms, and respiratory infections. Sexually transmitted infection (STI)prevalence, maternal mortality, pregnancy, and birth rates were modeled for the MDG 5: to improvematernal health. HIV and AIDS, malaria, tuberculosis, and leprosy were included for MDG 6because these very serious diseases can result in severe illness or death. In addition to conditionswithin the MDGs, selected lifestyle diseases—cardiovascular diseases, hypertension, diabetes, andasthma—were included in the health model. Health professionals anticipate higher prevalence ratesof these lifestyle diseases in developing countries during the coming years. The World HealthOrganization (WHO) Global Burden of Disease work was also reviewed; the Pareto principle, or 8020 rule, was applied to this data. Most of the emphasis was placed on keeping diseases that representthe 20 percent of diseases in the model because they cause 80 percent of disability-adjusted life years(DALY) and mortalities for the MDG region of sub-Saharan Africa.Prevalence rates were obtained for each of the conditions described above and, when possible, weregrouped by age and administrative region. Additionally, geocoded population data for Tanzania wascollected at the district level. As the main components of the health model, the prevalence rates andpopulation data were used to determine the number of people who need treatment for theseconditions and diseases and how to distribute the treatment across Tanzania.Material Requirements ModelThe materials for the material requirements model focus on key pharmaceuticals needed to treat aperson with one of the in-scope conditions. In addition to medicines required to treat conditions—diagnostic and preventive commodities like HIV and malaria test kits, bed nets, vaccine packages,family planning commodities, and mother-child health related items—were also included. Anothercomponent of the material requirements model is treatment rates for each disease; not everyonewho suffers from a disease receives treatment; this must be considered when determining the overallmaterial needs for a country. An additional bundle of essential medicines would be required to coverother disease and conditions not specifically identified. For each of the health commodities included,the price, quantity, weight, and volume were used as characteristic definitions.Supply Chain ModelThe Supply Chain Model was defined by the following parameters: supply chain financials(warehouse operating, administrative, labor, and transportation); and supply chain configuration(warehouse location, available warehouse space, and capacity). The network was modeled at anaggregated district level based on demand-driven flows of the material needs; they used the materialrequirements model explained above.2
Using this approach, the observed trends for any of the three models of the framework can easily beincorporated to create different scenarios and to compare the overall effects on the supply chainmodel outputs. The framework, illustrated in figure 1, shows that considering observed or expectedtrends of a country’s health state. can be used to determine supply chain recommendations.Figure 1. Visual Overview of the Interdependent Model FrameworkFuture State ScenarioIn this study, two main questions were considered for future state analyses. First, the added strain onthe supply chain network from increased volume is considered. The increased volume is determinedusing population growth, and disease prevalence and treatment rate trends. Another majorcomponent is the effect that the newly mandated system of direct delivery will have on the system’saccess and financials. Finally, several health model scenarios that aim to observe the effect ofchanging health interventions on the supply chain were also analyzed.3
4
MethodologyThe project team first collected the required data during a two-week in-country trip; including asinputs the Health, Material Requirements, and Supply Chain Models that, together, make up themodeling framework. The team then determined the necessary assumptions for both the baselineand future state scenarios. Next, Supply Chain Guru, LLamasoft’s flagship network optimizationand analysis tool, was used to determine the key supply chain, service, and financial metrics for thebaseline and for future state supply chain scenarios. Finally, the results were analyzed andsummarized.Data CollectionThe following data was collected on-site in Tanzania; it was used for the Health Model, MaterialRequirements Model, and Supply Chain Model.Health ModelCensus data for 2002 and projections for 2010–2030, available from the Tanzania National Bureauof Statistics, were used to predict the expected Tanzanian population for 2020–2024. The censusdata is available down to the district level (for 126 districts); it is divided by gender and age.The prevalence rates for the in-scope conditions came from the Tanzania Ministry of Health, WHO,and the President’s Emergency Plan for AIDS Relief (PEPFAR) reports; peer-reviewed publications;and conference abstracts. See appendix B for the prevalence and treatment rates, by disease.Material Requirements ModelTo determine a country’s health supply needs, the Material Requirements Model compiles all theinformation needed from its health model. This entails gathering data on what treatment a personwith an in-scope condition should receive, as required by age and gender. See appendix A for someof the main resources used in this model.The total material needs of a country were then calculated based on the Health Model and thetreatments from the material requirements model. The treatment rates were applied to predict thetotal forecasted demand.Supply Chain ModelThe Medical Stores Department (MSD) operates the Tanzanian public health supply chain, anautonomous department of the Ministry of Health (MOH), which was formed by an act ofParliament in 1993. The MSD is headquartered in Dar es Salaam with the central warehouse, whichis as the main storage and primary entry point for public health commodities. The country is furtherdivided into nine medical zones, each with its own warehouse, and referred to as the zonalwarehouse. The following section, Tanzania Supply Chain Background explains the structure of thenetwork and distribution system.5
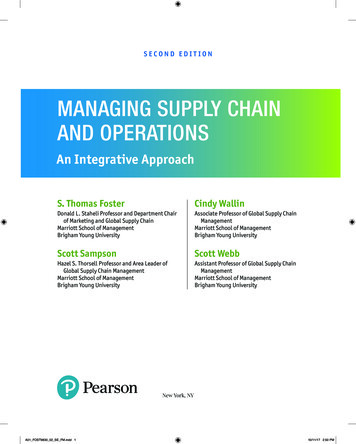
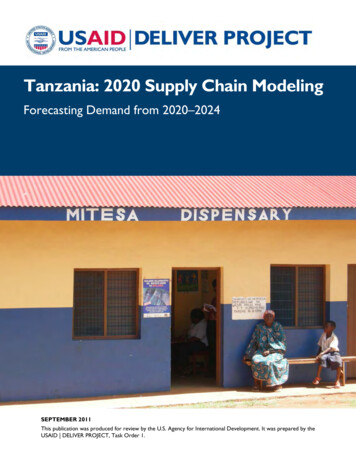
To build the Tanzania supply chain model, the team gathered the following data elements. First, theteam obtained latitude and longitude values for the district capitals and used this information tocalculate distance for the distribution of medical supplies, based on population (using the populationdata gathered in the health model). Next, we determined the volume and weight for one package ofeach commodity in the material requirements model, and the commodity cost. This informationcame mainly from the International Drug Price Indicator Guide (Management Sciences for Health [MSH]2008), the Logistics Fact Sheet: Antiretrovirals [ARVs] (from John Snow, Inc. [JSI]), or the Logistics FactSheet: HIV Test Kits (from JSI).The MSD provided the historical shipment data for 2010–2011, which detailed the amount andvalue of commodities shipped out of the central warehouse, by date. This data was used to (1) createan additional commodity in the supply chain model, which represents the other essential medicinesthat are not yet specifically modeled as part of the disease and program specific commoditiesidentified in the material requirements model; and (2) validate the requirements model against theanecdotal 2011 average fill-rate of orders (approximately 60).Additionally, the MSD provided an itemized budget for the overall operations in 2010–2011,including administrative, transportation, and operational costs. The MSD annualized budget wasused to (1) determine transportation costs from the central warehouse to the zonal warehouses, percubic meter, per kilometer; (2) calculate the cost to operate a square foot of warehouse space; and(3) determine the average handling cost for each unit of product flowing through a warehouse. Inaddition to the overall budget, MSD provided an estimated budget for the anticipated transportationcosts under the new delivery plan. This was used to estimate the last mile delivery costs, per unit, perkilometer, within each of the nine medical zones. The historical shipment and itemized budget wereused to calibrate and validate the model that was built for 2011; it is the baseline used to comparethe results for the 2020–2024 future state models.Tanzania Supply Chain Structure BackgroundBefore we can discuss the results from the supply chain models, it is important to understand thecurrent structure of the supply chain network, as well as the proposed changes. Tanzania has 26regions and 126 districts. As mentioned earlier, the country is divided into nine medical zones, witheach zone having one to five regions. See appendix C for a list of the medical zones and thecorresponding regions and districts in those zones. Figure 2 displays the breakdown of the ninemedical zones and also shows the locations of the zonal warehouses (marked as msd).6
Figure 2. Tanzanian Medical ZonesHistorically, the MSD has been responsible for delivering products from the central warehouse inDar es Salaam to the nine zones; and, subsequently, from the zones to all the districts. Each districthas a District Medical Officer (DMO) who is responsible for storing the goods. Larger hospitals andsmaller health facilities then arrange to pick up the commodities from the DMO. Over the years, itwas noted that many of the lower-level health facilities, including the health centers and dispensaries,did not have adequate supply of the needed products. Without the funding to transport the goodsfrom the DMO to their facilities, these health facilities faced a significant shortage of goods, andmany patients were denied crucial treatments.Because of these issues of access to care, the government mandated a new delivery system—DirectDelivery. Under this system, the MSD would be responsible for the final delivery of goods to thehealth centers and dispensaries. Hospitals would continue to transport their goods from the zonalwarehouse, but lower-level health facilities would no longer pay the transportation costs. Although itis expensive to implement, the primary goal of this program is to ensure patient care through thepublic health system—that patients receive the health commodities they need, in a reasonableamount of time.At the time this analysis was done, the MSD was implementing the direct delivery system. Becausethe MSD was drastically changing the way it normally operates, this became the focal point of theanalysis.7
Baseline and Future Projection AssumptionsGeneral AssumptionsThe following assumptions were made across the modeling framework: The exchange rate for the Tanzanian shilling to the U.S. dollar was 1,500: 1; which was anapproximated average exchange rate during FY2010–2011. There is no inflation, so the monetary values reported in the model reflect constant prices.Health Model AssumptionsThe following assumptions were made across the Health Model framework: Population growth rate is equal for all districts. The breakdown of population by gender and age group is constant across districts.Material Requirements Model AssumptionsThe following assumptions were made across the Requirements Model framework: The treatments by condition are summarized in appendix B. The treatments (number of tablets/vials of medicine per person, per year) are the same betweenthe baseline and 2020–2024, except that a new vaccine package, which is bulkier and moreexpensive, will be used for 2020–2024. Without a quantitative analysis, the current fill rate is set at 60 percent, based on interviews withMSD personnel. Based on interviews with members of the MOH, approximately 60 percent of the healthfacilities (including lower level and hospitals) are public.Supply Chain Model AssumptionsThe following assumptions were made across the Supply Chain Model framework: The operating costs for the warehouses relate directly to the volume of the warehouse, whichwas calculated on area and number of pallet positions. The operating cost per square foot, determined using the calculation above, is applied to thewarehouses in the future, from 2020–2024. The derived transportation cost from the central warehouse to the zonal warehouse is the sameper unit, per distance, cost for all zones. The currently estimated last mile costs are also used in the future state scenarios; economies ofscale were not considered.Quantification AnalysisFirst, with LLamasoft’s Supply Chain Guru, the modeling framework was used to generate a baselineset of metrics, given current conditions and the most likely expected trends based on current8
trajectories. The baseline was used to analyze how the system is currently operating. As a first step, itis important to confirm that the model can reproduce current conditions; the future state scenarioscan then be run with confidence.Next, a range of possible future state supply chain metrics were forecasted using a variety of possibleconditions, with key variables adjusted and relationships tested. In Tanzania, because the mainquestion was the move from the current state to the direct delivery system, total transportation costsare the highlighted metric in all the scenarios. The transportation cost included items such as fuel,repair and
2. To understand and analyze the current and future (2020-2024) supply chain requirements for procuring and distributing essential medical commodities in Tanzania by applying the health, material requirements, and supply chain models. 3. To determine the most pressing needs for revamping the supply chain network in Tanzania by