Transcription
ALUMNI SURVEYCORNELL UNIVERSITY CLASS OF '89INTER-INSTITUTIONAL ANALYSISEXECUTIVE SUMMARY REPORTSURVEY DESCRIPTIONThe survey, designed by a consortium of institutional researchers from highly selective private researchuniversities and liberal arts colleges, was sent to select alumni classes of 28 educational institutions duringJanuary-February 2000. A detailed analysis of Cornell University alumni responses, including analyses bygender, racial/ethnic background, and college, is presented in “Alumni Survey, Cornell University Classesof ‘89 and ’94 Intra-Institutional Analysis, Executive Summary Report” and may be found in "pdf" formatonline by following the links for the Alumni Survey at the following URL:http://www.ipr.cornell.edu/Reports/report menu.htm.This report compares Cornell University results for the Class of ’89 (10 years post-graduation) with those ofalumni from groups of other universities comparable to Cornell on the basis of competition forundergraduate students. For purposes of comparison, three “norm” groups, each including four or moreuniversities, were established, based on the following characteristics: Norm Group 1 includes universities that most often “win” when in direct competition withCornell for admitted undergraduates.Norm Group 2 includes universities with which Cornell competes on a relatively even basis foradmitted undergraduates.Norm Group 3 includes universities that most often “lose” when in direct competition withCornell for admitted undergraduates.Unless otherwise indicated, reported differences between groups are statistically significant.ALUMNI CHARACTERISTICS The proportion of male and female respondents was equal among Cornell alumni (Chart 1, Table 1).Norm Group 1 and Norm Group 3 had more male respondents (52.6% and 53.6%, respectively), whileNorm Group 2 had more female respondents (54.0%). Cornell and Norm Group 2 had larger proportions of White alumni respondents (84.5% and 84.1%respectively), while Norm Group 1 had a larger proportion of Asian American (11.1%), other (4.6%),and international (1.5%) alumni respondents (Chart 1, Table 1). Norm Group 1 alumni were most likely to have earned an advanced degree (92.9%), followed by NormGroup 3 (85.6%), Norm Group 2 (80.3%), and Cornell (77.9%) (Chart 2, Table 2). Nearly half of allalumni reported having earned a Master’s degree. The Master’s degree in business was the mostfrequently reported earned Master’s degree for all groups. The current primary activity of most alumni is employment for pay in a management-related field(Charts 3a, 3b, 3c; Table 3). Most work for a private for-profit corporation. Cornell alumni were moreInstitutional Research and Planning3/6/02
Alumni SurveyCornell University Classes of '89Inter-Institutional AnalysisExecutive Summary Reportlikely than other alumni to be raising a family (14.4%) or to be in military service (1.4%). They weremore likely than other alumni to be working in a management (25.2%), engineering (7.2%), ormarketing/sales (4.9%) position.Cornell alumni were more likely to have majored inbusiness/management (12.5%) than were alumni from Norm Groups 1, 2 and 3 (3.2%, 10.8%, and 4.4%respectively). They were also more likely to have majored in engineering (17.6%) than alumni fromNorm Groups 2 and 3 (10.0%, 15.9% respectively). Norm Group 1 had the highest percentage ofengineering majors (19.7%), compared with Cornell, Norm Group 2, and Norm Group 3 (17.6%, 10.0%,and 15.9%, respectively). The median individual income of Cornell alumni was about 67,500 (Chart 4a, Table 4a). Norm Group1 respondents were more likely than other groups to have individual incomes over 175,000, whileCornell alumni were less likely to have individual incomes in the over 175,000 range. The medianhousehold income of Cornell alumni was about 102,500 (Chart 4b, Table 4b).Norm Group 1respondents were more likely to have household incomes over 175, 000. Most alumni reported being either "somewhat satisfied" or "very satisfied" with their lives. There wereno significant differences among groups in regard to current satisfaction with life (Chart 5, Table 5). The goal rated most important by all responding alumni was “raising a family,” followed by “helpingothers in difficulty,” “being very well off financially,” “recognition from colleagues for contributionsto my special field,” and “keeping up with science and technology.” (Charts 6a, Table 6). Cornellalumni gave higher importance ratings to “being involved in environmental protection” (2.58, scale 1 “not at all” to 5 “essential”). Norm Group 2 alumni gave higher importance ratings to “keeping upwith developments in the arts” (3.30). Achievement of alumni goals was greatest for the goal of “recognition from colleagues forcontributions to my special field,” followed by “being very well off financially,” “keeping up withscience and technology,” “helping others in difficulty,” and “keeping up with developments inpolitics” (Chart 6b, Table 6). “Raising a family” was the goal rated highest in importance, but relativelyfew alumni have achieved this goal. Cornell alumni were more likely than others to haveaccomplished “being involved in environmental protection” (2.05) (scale 1 “not at all” to 5 “verymuch”). Norm Group 2 alumni were more likely than other groups to have achieved “keeping up withdevelopments in the arts” (2.96), “keeping up with developments in sports” (2.64), and “influencingsocial values” (2.49).GENERAL VIEW OF THE UNIVERSITY Most alumni were "generally satisfied" or "very satisfied" with their undergraduate education (Chart 7,Table 7). Among Cornell alumni, 50.9% were “very satisfied.” Norm Group 1 alumni were more likelythan other alumni to be “very satisfied” (58.6%) with their undergraduate education. Alumni from Cornell (72.0%) and from Norm Group 1 (72.6%) were more likely to considerrecommending their university to a high school senior with similar background, ability, interests, andtemperament (Chart 8, Table 8). Norm Group 3 alumni were more likely to indicate that they would“probably not” (6.6%) or “definitely not” (2.3%) recommend their university. When asked to indicate how much emphasis their university currently places on certain areas, alumnifrom all groups agreed that “faculty research” is the area that receives the most emphasis (Chart 9a,Table 9). Cornell alumni were less likely than other norm groups to report current university emphasison the following (scale 1 “very little/none” to 5 “a great deal”):Institutional Research and Planning3/6/02 - Page 2
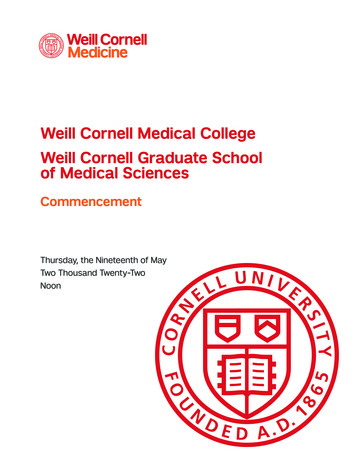
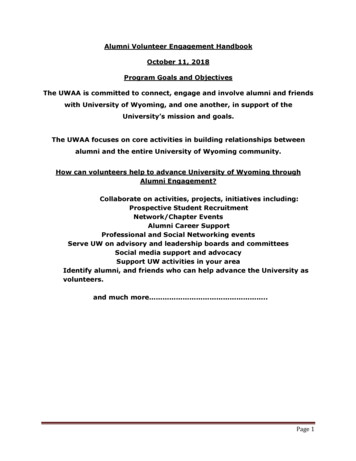
Alumni SurveyCornell University Classes of '89 Inter-Institutional AnalysisExecutive Summary Report“teaching undergrads” (3.64)“broad liberal arts education” (3.63)“moral/ethical development” (2.75)Norm Group 1 alumni were more likely than other groups to report university emphasis on: “intellectual freedom” (4.34)“teaching undergrads” (4.13)“need-based financial aid” (3.85)Norm Group 2 alumni were more likely than other groups to report university emphasis on: “intercollegiate athletics” (3.36)“moral/ethical development” (3.06)Norm Group 3 alumni gave higher ratings of their university’s emphasis on “merit aid” (3.06) than didthe other groups. In regard to their desired university emphasis on certain areas, alumni from all groups identified“teaching undergrads” as the area of greatest desired university emphasis (Chart 9b, Table 9). Ingeneral, alumni desired more university emphasis on “broad liberal arts education” than on“workforce skills.” However, as shown in Figure 1, Cornell alumni desired more university emphasisthan did other alumni on “workforce skills” (4.13) and less university emphasis on “broad liberal artseducation” (3.91).CornellWorkforceskillsNorm Group 1Norm Group 2Broadliberal artseducationNorm Group 31.01.52.02.53.03.54.04.55.01 very little/none to 5 a great dealFigure 1. Desired University Emphasis: “Workforce Skills” and “Broad Liberal Arts Education”Norm Group 1 alumni were more likely than other groups to report desired university emphasis on: “teaching undergrads” (4.79)“intellectual freedom” (4.56)“need-based financial aid” (4.31)Institutional Research and Planning3/6/02 - Page 3
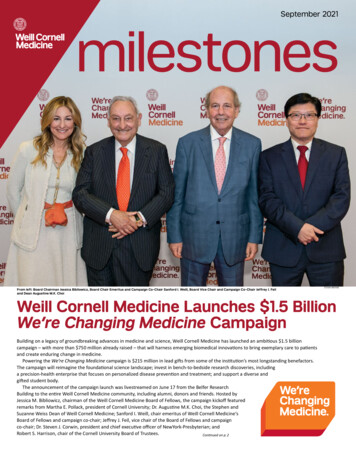
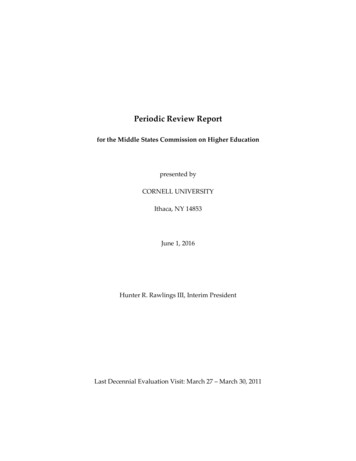
Alumni SurveyCornell University Classes of '89Inter-Institutional AnalysisExecutive Summary ReportNorm Group 2 alumni were less likely to report desired university emphasis on “faculty research”(3.81). Norm Group 3 alumni were more likely to report desired university emphasis on “merit aid”(3.85).The following comparison (Figure 2) of current and desired university emphasis ratings for the mosthighly rated areas shows that alumni at Cornell and at norm group institutions believe thatcomparatively insufficient emphasis is being placed on “teaching undergrads” while more emphasisthan necessary is being placed on “faculty research.”Teaching undergrads currentFaculty research currentTeaching undergrads desiredFaculty research .00Figure 2. Current vs. Desired Emphasis of the UniversityAmong Cornell alumni, large (greater than 1.0 on a 1-5 scale) differences between ratings of currentuniversity emphasis and ratings of desired university emphasis were present for “teaching undergrads”(current 3.64, desired 4.70), “workforce skills” (current 3.09, desired 4.13), and “moral/ethicaldevelopment” (current 2.75, desired 3.72). A similar substantive difference was present for Norm Group3 for “workforce skills” (current 2.74, desired 3.81).THE UNIVERSITY EXPERIENCE During their college years, alumni from all groups had the greatest interaction with White students,followed in decreasing frequency by students of different religions, Asian Americans, students fromoutside the U.S., Blacks, Hispanics, and Native Americans (Chart 10a, Table 10). Norm Group 1alumni reported more contact with students of different religions (3.96), Asian Americans (3.43), Blacks(3.02), and Hispanics (2.49) (scale 1 “none” to 5 “the most”). Cornell alumni reported more contactwith Native Americans than did other alumni (1.46). Norm Group 2 alumni reported less contact withAsian Americans than did other groups (2.99).Institutional Research and Planning3/6/02 - Page 4
Alumni SurveyCornell University Classes of '89Inter-Institutional AnalysisExecutive Summary Report The pattern of current alumni interaction with people from various groups is similar to the patternduring college, with the exception of slightly more current contact with people from outside the U. S.and less current contact with Asian Americans (Chart 10b, Table 10). Norm Group 1 alumni reportedmore current interaction with Asian Americans (3.17). “Beliefs about the nature of humans or society” was the area where undergraduate questioning mostoften produced the most valuable insights (Chart 11, Table 11). Cornell alumni were more likely thanother groups to report that questioning about “own political beliefs” produced the most valuableinsights (16.6%). Norm Group 1 alumni were more likely to identify “beliefs about people with othersexual orientation” (11.8%), Norm Group 2 alumni were more likely to identify “own religious beliefs”(12.5%), and Norm Group 3 alumni were more likely to identify “beliefs about the nature of humans orsociety” (37.4%) than were other groups. “Lectures and course-related readings” was the campus contact identified by alumni as having thegreatest contribution to their questioning of beliefs and values (Chart 12, Table 12). Cornell alumni,however, were least likely (45.6%) to report this activity has having a great contribution to theirquestioning of beliefs and values. Norm Group 1 alumni were more likely than other groups to reportthe greatest effect from “contact with student from different race” (35.9%) and from “contact withstudent from similar background” (31.8%). Norm Group 2 alumni were more likely than other groupsto identify “lectures, course-related readings” (51.5%), “employment during college” (15.4%),“community service” (17.4%), and “off-campus internships” (5.5%) as having the greatest contributionto their questioning of beliefs and values. All alumni groups reported more involvement in “coursework in major” than in other listedundergraduate activities (Chart 13, Table 13). Cornell alumni reported more involvement than othergroups in “fraternity/sorority” (2.46) and less involvement than other groups in “residential hall life”(2.58), “performing arts/music” (1.57), “student publications” (1.33), and “student or campusgovernment” (1.26) (scale 1 “none” to 5 “very high). Norm Group 1 alumni reported moreinvolvement than others in “independent study/research” (2.89), “interaction with major advisor”(2.65), and “intercollegiate athletics” (2.17), and less involvement in “off-campus employment” (1.86).Norm Group 2 alumni reported more involvement than others in “study abroad” (1.87) and lessinvolvement in “participation in faculty research” (1.41). Norm Group 3 alumni reported moreinvolvement than others in “student or campus government” (1.62) and less involvement than others in“community service” (1.96) and “fraternity/sorority” (1.67). For all alumni groups, “coursework in major,” “coursework outside major,” and “residential hall life”were identified as the activities contributing most to their personal development (Chart 14, Table 14).In comparison with other alumni groups, Cornell alumni reported higher university contributions topersonal development from “fraternity/sorority” (2.54) and “off-campus study in the U.S.” (1.41) andlower contributions from “residential hall life” (2.68), “performing arts/music” (1.77), “studentpublications” (1.43), and “student or campus government” (1.30) (scale 1 “none” to 5 “very high”).Norm Group 1 alumni were more likely than other groups to report higher university contributions topersonal development from “coursework outside major” (3.99), “independent study/research” (3.07),and “intercollegiate athletics” (2.36) and lower contributions from “off-campus employment” (1.98).Norm Group 2 alumni were more likely than other groups to report higher contributions to personaldevelopment from “community service” (2.71), “study abroad” (2.11), and “religiousgroups/organizations” (2.04) and less contribution from “intramural sports” (2.00), “interaction withmajor advisor” (1.97), and “participation in faculty research” (1.49). Norm Group 3 alumni were morelikely than other groups to report higher contributions to personal development from “intramuralInstitutional Research and Planning3/6/02 - Page 5
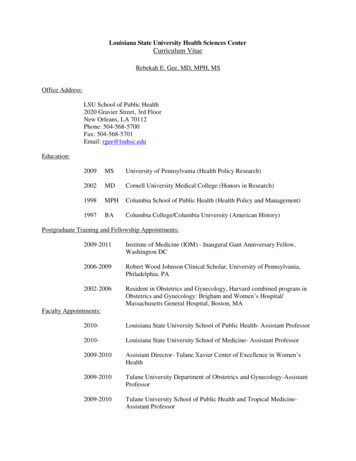
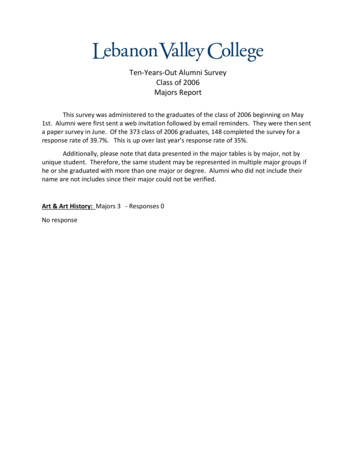
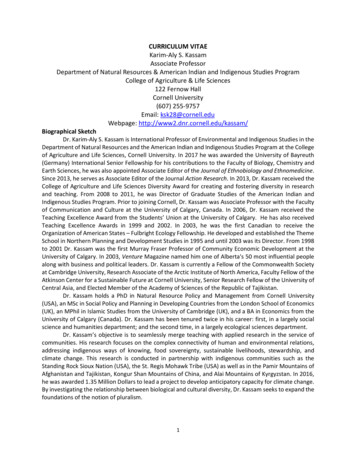
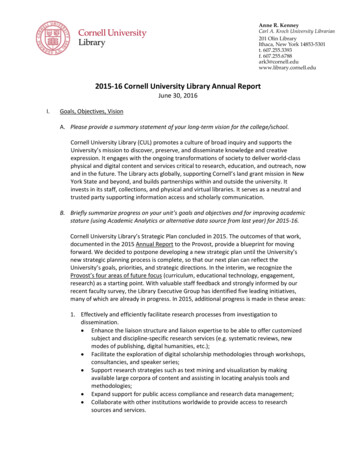
Alumni SurveyCornell University Classes of '89Inter-Institutional AnalysisExecutive Summary Reportsports” (2.42) and “ student or campus government” (1.67) and lower contributions from“fraternity/sorority” (1.75). In general, alumni rated “residential hall life” as contributing more to their personal development than“fraternity/sorority.” However, as shown in Figure 3, Cornell alumni reported relatively highercontributions to personal development from “fraternity/sorority,” while Norm Groups 1, 2, and 3 eachreported comparatively higher contributions from “residential hall life.”CornellNorm Group 1Fraternity/sororityNorm Group 2Residential hall lifeNorm Group 31.01.52.02.53.03.54.04.55.01 none to 5 very highFigure 3. Contribution to Personal Development: “Fraternity/Sorority” and “Residential Hall Life”As shown in Figure 4, Norm Group 1 alumni indicated that “independent study/research” contributedmore to their personal development than did “contact with faculty outside class.” Conversely, alumnifrom Cornell, Norm Group 2 and Norm Group 3 indicated that “contact with faculty outside class”contributed more to their personal development than did “independent study/research.”CornellNorm Group 1Independentstudy/researchNorm Group 2Contact with facultyoutside classNorm Group 31.01.52.02.53.03.54.04.55.01 none to 5 very highFigure 4. Contribution to Personal Development: “Independent Study/Research” and“Contact With Faculty Outside Class”Institutional Research and Planning3/6/02 - Page 6
Alumni SurveyCornell University Classes of '89Inter-Institutional AnalysisExecutive Summary ReportFor all activities, level of involvement in an activity correlated highly with the perceived level of thatactivity’s contribution to personal development. Considering various skills, types of knowledge, and personal qualities important in their lives sincecollege, alumni from all groups rated the following as the most important (Chart 15, Table 15): “Communicate well orally”“Acquire new skills and knowledge on my own”“Write effectively”“Synthesize and integrate ideas and information”“Formulate creative/original ideas and solutions”Cornell alumni gave lower importance ratings than did other groups to “appreciate art, literature,music, and drama” (3.45), “broad knowledge of arts and sciences” (3.16), and “historical perspective oncurrent problems” (3.06) (scale 1 "not at all important" to 5 "very important"). Norm Group 1 alumnigave higher importance ratings than did other groups to “synthesize and integrate ideas andinformation” (4.61). Norm Group 2 alumni gave higher importance ratings than did others to “identifyethical/moral issues” (3.18). Norm Group 3 alumni gave higher importance ratings than did others to“quantitative abilities” (3.59). Considering the university’s contribution to the skills, types of knowledge, and personal qualitiesimportant in their lives since college, alumni from all groups gave the highest ratings to the following(Chart 16, Table 16): “Synthesize and integrate ideas and information”“Acquire new skills/knowledge on my own”Figure 5 shows a comparison of university contributions to the skills, types of knowledge, and personalqualities that were rated by all alumni as being most important. Cornell alumni gave higher (notstatistically significant) university contribution scores to “communicate well orally” (3.42) and “writeeffectively” (3.80). Norm Group 1 alumni gave higher university contribution scores to “acquire newskills and knowledge on my own” (4.20), “synthesize and integrate ideas and information” (4.21), and“formulate creative/original ideas and solutions” (3.95).Institutional Research and Planning3/6/02 - Page 7
Alumni SurveyCornell University Classes of '89Inter-Institutional AnalysisExecutive Summary ReportCommunicate well orallyAcquire new skills/knowledgeindependentlyCornellWrite effectivelyNormGroup 1S ynthesize and integrate informationNormGroup 2NormGroup 3Formulate creative/original ideas1.0 1.5 2.0 2.53.0 3.5 4.0 4.5 5.01 none to 5 gre at de alFigure 5. University Contributions to Selected Skills, Types of Knowledge, and Personal QualitiesAs shown in Figure 6, Cornell alumni gave higher ratings than did other alumni groups to theuniversity’s contribution to “use computers” (3.39) and lower ratings than did other alumni groups tothe following: “Broad knowledge of arts and sciences” (3.46)“Historical perspective on current problems” (3.18)“Appreciate art, literature, music, and drama” (3.11)“Identify ethical/moral issues” (2.85)“Read or speak foreign language” (2.19)Use computersBroad knowledge of arts and sciencesHistorical perspective on current problemsCornellAppreciate art, literature, music, dramaNormGroup 1NormGroup 2NormGroup 3Identify ethical/moral issuesRead or speak foreign language1.01.52.02.53.03.54.04.55.01 none to 5 ve ry highFigure 6. Significantly Different Cornell Ratings of University Contributions to Selected Skills,Types of Knowledge, and Personal QualitiesInstitutional Research and Planning3/6/02 - Page 8
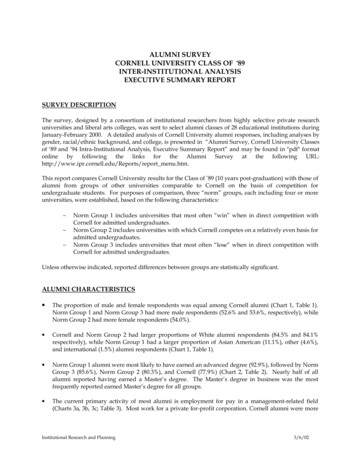
Alumni SurveyCornell University Classes of '89 Inter-Institutional AnalysisExecutive Summary ReportAs shown in Figure 7, alumni ratings of attribute importance generally exceeded ratings of theuniversity’s contribution to that attribute, with the largest discrepancies between importance anduniversity contribution being present for the following: “Communicate well orally”“Use computers”“Develop self-esteem/self-confidence”“Function effectively as a member of a team”“Lead and supervise tasks and groups of people”“Healthy lifestyle”Ratings of university contribution to the development of attributes exceeded ratings of attributeimportance for the following: “Broad knowledge of arts and sciences”“Historical perspective on current problems”“Read or speak foreign .002.502.001.50AcquiSyrenewskCills om/kmnountw nicheledg atesiweFo zeeinrm ande ll oWdulpri e ralat inte eg te e nd lyecr raea te ffec ntltiv in tiv ySee/ foeor rm lylfig aesite Us na tionem e l iRdela com eaatFeun Se nd c pu swLel ea ctio lf-u on terltfo d/s n a nde ide spe up sncrsteoprv ea tan elmieGot se t m dingaihe as enirrk mnAp-dac s/p berepres eopteIH /re e pleU cia den h knd tetif now alth ligioeryst art, et led y lif nsa n lihesd ter ica getro at l/m of ylele u raoefrofa ie,Bsc mu l is ldH roa Aiesi suiswdnctoaeric kn ren Qua ce/ , d sal ow es n tec ramtlipe ed st hars ge of ativ nolR pec of soc e a ogyea tibid ve arts al p ilitior oan rob esnsp cea ur d sc lemk ren ie sfo t p ncre ro esig bn lela mng suage1.00Figure 7. Skills, Types of Knowledge, and Personal Qualities: Importance vs. University’s ContributionCompared with the norm groups, Cornell alumni indicated greater discrepancies between theimportance of an attribute and the university’s contribution to personal development of thatattribute for the following: “Formulate creative/original ideas” (importance 4.50, contribution 3.66)“Identify ethical/moral issues” (importance 3.63, contribution 2.85)Institutional Research and Planning3/6/02 - Page 9
Alumni SurveyCornell University Classes of '89 Inter-Institutional AnalysisExecutive Summary Report“Appreciate art, literature, music, drama” (importance 3.4, contribution 3.11)These differences suggest that, in comparison with the norm group institutions, Cornell faredworse in contributing to the personal development of those attributes to a level comparable toattribute importance.However, suggesting that Cornell did better than the comparison institutions in contributing tothe personal development of other attributes, importance and contribution ratings were closerthan for other groups for the following: “Communicate well orally” (importance 4.77, contribution 3.42)“Historical perspective on current problems” (importance 3.0, contribution 3.18)“Read or speak foreign language” (importance 2.37, contribution 2.1)FINANCIAL AID Parental resources were the major source of undergraduate education financing for all groups, morefor Norm Group 1 alumni (80.5%) than for other groups (Chart 17, Table 17). Norm Group 3 alumniwere more likely than other groups to have identified “institutional financial aid” (50.6%) and “otherpersonal resources” (23.0%) as major sources of financial aid. The median undergraduate student loan amount was about 11,250 for each of the alumni groups(Chart 18, Table 18). Cornell alumni were more likely to have borrowed less than 7,500. Norm Group1 alumni were more likely to have borrowed more than 15,000. Norm Group 2 alumni were lesslikely than other alumni (48.9%) to have taken out undergraduate loans. Norm Group 3 alumni weremore likely to have borrowed in the range of 7,500 to 14,999. Cornell alumni were less likely than other alumni to have pursued a post-graduate education (Chart19, Table 19). Among all alumni who did attend graduate school, Norm Group 1 alumni were lesslikely to have borrowed money to finance their studies. Of those who borrowed money for theirgraduate school education, Norm Group 1 alumni were more likely to have borrowed more than 60,000.ALUMNI ACTIVITIES AND CONTRIBUTIONS “Reading campus publications” was the most frequently reported alumni activity for all groups (Chart20, Table 20).Cornell alumni were more likely than other alumni to have attended functions offcampus (32.2%). Norm Group 1 alumni were more likely than other groups to have read campuspublications (86.6%), visited their institution's web site (63.7%), visited their campus (65.3%), attendeda function on campus (45.9%), participated in annual fundraising (22.3%), or served as a class agent orrepresentative (3.2%). Norm Group 2 alumni were more likely to have participated in anundergraduate career advisory program (5.6%).For all groups, alumni who were “generally satisfied” or “very satisfied” with their undergraduateeducation were more likely than others to participate in the following alumni activities: “Alumni admissions volunteer”“Annual fundraising”“Attend functions on campus”“Attend functions off campus”“Visit the campus”Institutional Research and Planning3/6/02 - Page 10
Alumni SurveyCornell University Classes of '89 Inter-Institutional AnalysisExecutive Summary Report“Read campus publications”For Norm Groups 1 and 2, alumni with individual annual incomes of 90,000 or more were more likelythan others to participate in the following alumni activities: “Annual fundraising”“Attend functions on campus”“Attend functions off campus”“Visit the campus”“Visit the institution’s web site”There were no alumni activity participation differences by income among Cornell or Norm Group 3alumni. Most alumni contributions were in the range of 1– 99 for all groups (Chart 21, Table 21). NormGroup 1 alumni were more likely than other groups to have contributed this lower amount, whileNorm Group 2 alumni were more likely to have made contributions in the 1,000 - 4,999 range.Cornell and Norm Group 3 alumni were less likely to have contributed any amount. Among allgroups, there were no associations between the level of satisfaction with undergraduate education andthe amount of alumni contribution.Institutional Research and Planning3/6/02 - Page 11Copyright 2002, Cornell University. All rights reserved. Last updated 10/10/2002
Cornell University Classes of '89 Executive Summary Report likely than other alumni to be raising a family (14.4%) or to be in military service (1.4%). They were more likely than other alumni to be working in a management (25.2%), engineering (7.2%), or marketing/sales (4.9%) position. Cornell alumni were more likely to have majored in