Transcription
WP/12/155Banks' Liability Structure and MortgageLending During the Financial CrisisJihad C. Dagher and Kazim Kazimov
2012 International Monetary FundWP/12/155IMF Working PaperWestern Hemisphere DepartmentBanks’ Liability Structure and Mortgage Lending During the Financial CrisisPrepared by Jihad C. Dagher and Kazim KazimovAuthorized for distribution by Roberto CardarelliJune 2012This Working Paper should not be reported as representing the views of the IMF.The views expressed in this Working Paper are those of the author(s) and do not necessarilyrepresent those of the IMF or IMF policy. Working Papers describe research in progress bythe author(s) and are published to elicit comments and to further debate.AbstractWe examine the impact of banks’ exposure to market liquidity shocks through wholesalefunding on their supply of credit during the financial crisis in the United States. We focus onmortgage lending to minimize the impact of confounding demand factors that couldpotentially be large when comparing banks’ overall lending across heterogeneous categoriesof credit. The disaggregated data on mortgage applications that we use allows us to study thetime variations in banks’ decisions to grant mortgage loans, while controlling for bank,borrower, and regional characteristics. The wealth of data also allows us to carry out matchingexercises that eliminate imbalances in observable applicant characteristics between wholesaleand retail banks, as well as various other robustness tests. We find that banks that were morereliant on wholesale funding curtailed their credit significantly more than retail-funded banksduring the crisis. The demand for mortgage credit, on the other hand, declined evenly acrosswholesale and retail banks. To understand the aggregate implications of our findings, weexploit the heterogeneity in mortgage funding across U.S. Metropolitan Statistical Areas(MSAs) and find that wholesale funding was a strong and significant predictor of a sharperdecline in overall mortgage credit at the MSA level.JEL Classification Numbers: G01, G21, E50Keywords: Retail funding, Wholesale funding, liquidity, credit supply, mortgages, matchingAuthor’s E-Mail Address: jdagher@imf.org; kkazimov@imf.org
2ContentsPageI.Introduction . 4II.Data and Summary Statistics . 8A. Data . 8B. Summary Statistics . 9III.Bank Lending During the Crisis .12A. Empirical Strategy .12B. Model Specification .13C. Definition of the Crisis Period .14D. Benchmark Results .15E. Matching .181. Balancing tests .192. Regressions on the matched sub-samples .20F. Demand for Credit .20IV.Aggregate Supply Effects .22A. Motivation and Empirical Strategy .22B. Results .23V.Conclusion .24References .37Data Appendix .40Tables1. Summary Statistics .292. Selecting the Crisis Year, 2007 vs. 2008 .303. LPM Baselines and Robustness .314. LPM and Logit for the Matched Sample .325. MSA Level Estimations .336. Balancing Tests for Two Way Matching .347. Demand for Mortgages 2005–2008 .358. Aggregate Supply 2005–2008.36Figures1. Volume of Originations .262. Rejection Rates .26
33.4.5.6.TED Spread .27Distribution of CD/A in 2005 Across Banks .27House Prices and Housing Supply Elasticity .28Distribution of Average CD/A in 2005 across MSAs .29
4I. I NTRODUCTIONThe years leading to the Global Financial Crisis have witnessed a rapidly changing financial landscape with continuously emerging novel financial practices and instruments. Whilefinancial innovations have the potential to improve the efficiency of capital allocation, theyalso pose challenges to economists, regulators, and market participants in assessing theirsoundness as well as their impact on overall financial stability.1 In that regard, the financialcrisis offers an opportunity to shed light on whether some of these new practices resulted inan added vulnerability of the financial system.One important trend that has been emerging in the banking sector is the increased reliance bybanks on non-core deposits as their main source of funding (See, e.g. Feldman and Schmidt,2001; Gatev and Strahan, 2006). These so called wholesale funds are typically raised on ashort-term rollover basis. While wholesale market funding offers more flexibility for banksin financing projects it increases their vulnerability to market-wide liquidity shocks.2 Thissimply is a result of wholesale financiers being uninsured creditors, and thus, more at risk ofrealizing losses.3 In comparison, retail deposits are a more stable source of funding as shownin Gatev and Strahan (2006).In this paper, we examine the impact of banks’ liability structure on their supply of credit following the drying-up of market-wide liquidity during the recent global financial crisis. Ouraim is to assess the contribution of wholesale funding to the sharp decline in credit supplyduring the crisis. Our question is also motivated by a long-standing empirical question regarding the impact of liquidity on credit supply. Evidence on this causality is often confounded bydemand factors, since episodes of liquidity shocks are also associated with economic downturns. The comprehensive loan-level disaggregated dataset on mortgage lending that we useallow us to design an empirical strategy that carefully controls for potentially confounding1 Forexample, an economics literature that has emerged prioir to the crisis has partly attributed the moderationin the volatility of the U.S. GDP (the so-called Great Moderation) to financial innovations.2 See, e.g. Allen, Babus, and Carletti (2010); Allen and Gale (2000); Bologna (2011); Brunnermeier (2009);Brunnermeier and Pedersen (2009); Gatev and Strahan (2006); Huang and Ratnovski (2011); IMF (2010);Ivashina and Scharfstein (2010); Raddatz (2010); Rochet and Vives (2004); Yorulmazer and Goldsmith-Pinkham(2010).3 For example, preceding its failure in 1984, Continental Illinois National Bank and Trust Company experienceda run from wholesale financiers but not from retail depositors. During the recent crisis, with the exception ofWachovia, runs from retail depositors in the U.S. were rare while wholesale runs became increasingly a threaton the major banks (see, e.g., Johnson, 2009). Even in the U.K, where deposit insurance was only partial, awholesale bank run on Northern Rock has preceded the infamous run by retail depositors, as documented inShin (2009).
5factors. Our results show a strong and conclusive evidence that the reliance on wholesalefunding negatively affected the supply of credit during the crisis.Our focus on mortgage lending has several motivations. First, a comparison of credit supplyby banks based on their overall lending across various credit products could be affected byuneven changes in demand across various sectors in the economy. Such confounding factorscould be hard to control for, as banks’ portfolios could differ across various dimensions notall of which are easily observable.4 Thus, by focusing on mortgage lending, specifically newmortgage originations for conventional 1-4 family units, we avoid a potential direct source ofbias in our results. Second, the availability of comprehensive data on mortgage applicationswith information on banks’ decisions, as well as loan, borrower, and regional characteristics,is a distinct advantage. They allow us to study the decision by banks to reject a loan whilecontrolling for these characteristics. The change in the rejection rate over time is a better indicator of changes in supply and, in comparison with credit volume, is less likely to be taintedby demand factors. Furthermore, by observing the demand for loan applications at each bankin our sample we are able to distinguish between supply and demand factors.Our empirical strategy proceeds as follows. Using comprehensive mortgage data from 2005to 2008 that we match with bank balance sheet data, we examine whether wholesale fundedbanks decreased their supply of mortgage credit more than retail funded banks. Two sourcesof identifying variations allow us to answer this question: the time variation in overall marketliquidity and the cross-sectional variation in the core deposit to assets ratio, a commonly usedmeasure of the extent to which a bank is funded through retail deposits. We use the data onbank mortgage lending decisions between 2005 and 2008 to fit a linear probability model ofrejection rates.We study bank lending decisions while controlling for loan, borrower, bank and regionalcharacteristics. We control for the characteristics of the borrowers and their loans using theinformation available from the mortgage data. We also merge the mortgage data with dataon bank financials to control for bank characteristics such as size, measures of liquidity, leverage, as well as other factors. We also include fixed-effects for banks, years, and for Metropolitan Statistical Areas (MSAs), as well as the interaction of MSA fixed effects with the crisis dummy to control for unobserved characteristics. We find that the marginal effect of aone standard deviation decrease in the ratio of core deposits to assets is an increase in therejection rate by around 3 percentage points during the crisis. This result holds both at the4 Forexample, even within mortgage lending one could differentiate between the origination and the refinancingbusinesses as demand can be heterogenous across this dimension.
6U.S. level, controlling for MSA effects interacted with the crisis dummy, as well as in largestMSAs. This result also continues to hold after excluding the largest banks from our sample.Further, we examine and find that this relation holds in a subsample of least risky applications, specifically, those made by higher income applicants for properties located in the MSAsleast affected by the collapse in house prices.While we do control for borrower characteristics in our benchmark estimations, we also address the possibility that these characteristics could be severely unbalanced between banks,which might not be fully addressed by merely including them on the right hand side of a linear regression (See, e.g. Dehejia and Wahba, 2002; Heckman, Ichimura, and Todd, 1998).As argued in Ho and others (2007) and Almeida and others (2009), when control variableshave poor distributional overlap, one can improve the estimation of group differences using non-parametric matching methods. We therefore reduce our sample to two subsamplesof applicants, at retail and wholesale banks, with almost identical distribution of observablecharacteristics. Specifically, we divide banks into wholesale and retail groups, and match applications from one group with the other based on applicants’ characteristics, namely: gender,race, income, loan to income ratio, and income of the census tract of the applicant. We onlymatch applicants from within the same MSA to control for regional effects. This matchingexercise reduces our sample from around 2.6 million to less than 150 thousands observationson characteristically identical pairs of applications. Nevertheless our results also hold in thisreduced sample with only trivial changes to the estimate of the marginal impact of bank funding on the rejection rate during the crisis.Overall our results strongly suggest that the reliance on wholesale funding has led to a sharpercontraction in the supply of credit during the crisis. While we argue that the change in rejection rates is a good measure of shifts in supply and is less likely to be affected by shifts in demand compared to overall volume of loans, we nevertheless examine changes in the demandfor loans across banks during the crisis. Specifically we check whether the number and volume of loan applications has declined unevenly across banks with various liability structures.We find that the core deposit to asset ratio is not a significant predictor of changes in demand,which we measure by the change in number and volume of mortgage applications. This resulthelps us further allay concerns of demand driven changes in rejection rates.We next exploit the variation in the funding of mortgage credit across MSAs, to gauge theaggregate consequences of our earlier findings. While our previous results point to a robustrelation between the liability structure of banks and the change in their supply of credit duringthe crisis, they do not provide a definitive evidence that the reliance on wholesale funding by
7banks has led to a decline in aggregate credit during the crisis. It is in fact possible that therelative decline in credit by wholesale funded banks was compensated by a relative increasein the supply of retail banks. In other words, one might argue that absent wholesale banks,retail funded banks would have originated less loans. Thus, one way to investigate the aggregate implications of our findings is to examine whether a higher concentration of wholesalefunded banks in an MSA was associated with a sharper decline in credit during the crisis. Tothis end we make use of a panel data of MSA-level observations constructed by collapsingour mortgage data at the MSA level and by merging this data with other MSA-level variables.Our results show a strong negative relation between the MSA’s average CD/A ratio and mortgage credit supply during the crisis.Our paper contributes to several strands of literature in financial economics. First, our paper contributes to a recent literature studying the role of wholesale funding in the credit contraction that occurred during the recent global financial crisis with the aim of understanding the risks from such funding schemes by banks. As pointed out in Huang and Ratnovski(2011), the “dark side” of wholesale funding, i.e. their vulnerability to liquidity shocks, became more visible during the recent crisis. Our paper complements the findings in Ivashinaand Scharfstein (2010) and Cornett and others (2011) which also find that bank lending hasfallen significantly more at wholesale banks. A salient feature of our approach is the use ofcomprehensive micro data on a specific credit product which allow us to design an empirical strategy that directly addresses potential confounding factors. In that respect, our paperalso adds to a growing literature on the implications of liquidity shocks for credit supply (See,e.g., Khwaja and Mian (2008); Peek and Rosengren (2000), Pravisini (2008) and Puri et al.(2011)). Investigating the link between liquidity shocks and credit (often refereed to as banklending channel) is challenging due to the fact that events that typically trigger changes in liquidity are also associated with shifts in the demand for loans. In our case, we overcome thesechallenges by exploiting both time and cross-sectional variation in liquidity using a comprehensive dataset that allows us to distinguish between demand and supply side effects. Finally,our paper contributes to a growing literature that aims to identify factors that have contributedto the severity of the boom-bust cycle with potential implications to macro-prudential policies (See, e.g. Dagher and Fu, 2011; Dell’Ariccia, Igan, and Leaven, 2008; Demyanyk, 2010;Mian and Sufi, 2009; Purnanandam, 2011).The rest of the paper is organized as follows. Section II describes the data and presents somedescriptive statistics and figures. Section III explains the empirical strategy as well as the proposed methodology, and provides the empirical results together with robustness checks. Section IV investigates aggregate supply effects. Section V concludes.
8II. DATA AND S UMMARY S TATISTICSA. DataWe construct our dataset by merging data on mortgage applications with data on bank financials. The data appendix provides a detailed description of the steps involved in the construction of the dataset.Our mortgage related data come from a comprehensive sample of mortgage applications between 2005 and 2008 that were collected by the Federal Reserve under the provision of theHome Mortgage Disclosure Act (HMDA). Under this provision, the vast majority of mortgage lenders are required to report.5 The HMDA data includes information on the year of theapplication (the data is available on an annual basis), the amount of the loan, the lender’s decision, characteristics of the applicant (income, race, gender, location), and the median income in the census tract of the property. The data also provides useful information on thelender, such as the name of the institution, its type, and its regulating agency. We thus candistinguish between banks and their affiliates and other depository (thrifts, credit unions) andnon-depository (independent mortgage lenders) institutions. We restrict our attention to mortgage applications made at depository institutions (banks) and their affiliates that are related toowner-occupied home purchases of conventional one-to-four-family properties.We also limit our study to mortgage originations in counties situated in a Metropolitan Statistical Area (MSA) leaving us with 295 MSAs, which account for around 80% of total HMDAmortgage originations in 2005.6 To further minimize the noise in the data we focus on banksthat were significantly involved in mortgage lending and restrict our attention to banks thatoriginated at least 50 mortgage loans in a given year. A large share of banks account for asmall share of originations as they provide mortgage loans occasionally and in small numbers. Lending by these banks is more likely to be affected by idiosyncratic factors that are unrelated to the liquidity crisis. Since our aim is to understand the impact of the crisis on banks’mortgage lending decisions, we are restricted to banks that survived the whole sample period.We therefore balance the sample given the short time span of our data. After imposing these5 SeeData Appendix for more information about these requirements and the coverage of HMDA.our sample to MSAs allows us to control for variables that are otherwise not available, such asmeasures of house price growth and the housing supply elasticity, and helps us to minimize any noise in the datathat could be brought by the inclusion of areas with a small population.6 Restricting
9restrictions and excluding loans below 25,000 and above a million, our 2005-2008 sampleconsists of around 4 million applications at 555 banks.7All regulated depository institutions in the United States are required to file their financial information periodically with their respective regulators. Reports of Condition and Income dataare a widely used source of timely and accurate financial data on banks’ balance sheets andthe results of their operations. Specifically, every national bank, state member bank, and insured non-member bank is required by the Federal Financial Institutions Examination Council (FFIEC) to file a Call Report as of the close of business on the last day of each calendarquarter. The specific reporting requirements depend upon the size of the bank and whether ornot it has any foreign offices. The availability of agency specific bank IDs in HMDA (FederalReserve RSSD-ID, FDIC Certificate Number, and OCC Charter Number) allows us to matchHMDA lenders that are depository institutions with their financials from the Call Report. Weuse the available balance sheet data to capture relevant financial information on banks, including our main variable of interest - the ratio of core deposits to assets. We follow the literature and define core deposits to be the sum of a bank’s deposits excluding time deposits over 100, 000 (See, e.g. Berlin and Mester, 1999).8B. Summary statisticsTable 1 provides summary statistics on loans in our sample. The first column shows the number of originations in millions of dollars. Over the four years, banks in our sample originated a total of around 898 billion dollars, or more than 19% of the 4.7 trillion of 1-4 family purchase originations reported over the same period by the Mortgage Banker Association(MBA).9 As expected, and consistent with the MBA numbers, 2005 saw the highest numberof originations related to purchases during this period. The volume of originations declinedsubstantially in 2007 with the start of the mortgage crisis and declined by around 46% by2008 compared to 2005. In the second column of the upper table we show the average rejection rate for banks, which shows an increase of 1.62% during 2008 from 2007. This increase7 Theoriginal sample includes 4746 banks from which only 555 banks consistently originated more than 50loans. This restriction on banks reduces the sample from around 5.2 to 4.3 million applications from whicharound 0.3 million are excluded for being very small or very large loans, to minimize noise from outliers (seee.g. Del’arricia et al. (2008) for similar treatment). Finally, when the data are balanced, the number of observations drops to 4 million applications. Note that these restrictions do not affect our main results in what follows.8 Although the limit for insured deposits has been increased to 250, 000 in 2008, this does not affect our analysis since we use the lag of the core deposits ratio in each year including in 2008, the last year in our sample.9 By focusing on banks we have already excluded from our analysis more than 50% of originations by independent mortgage lenders, saving institutions and credit unions. See Data Appendix for other exclusions.
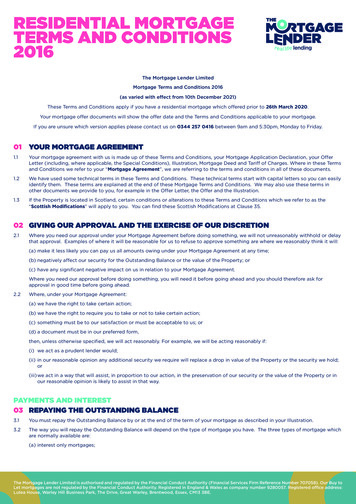
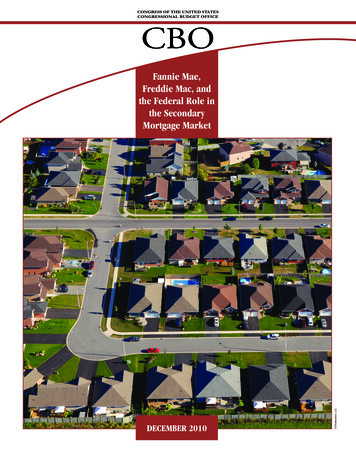
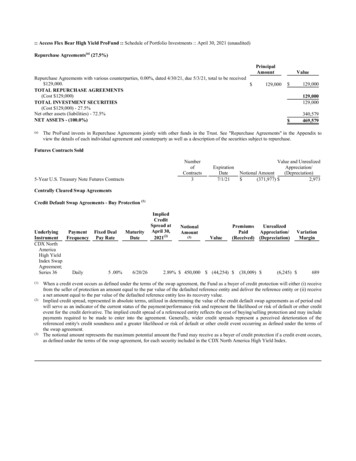
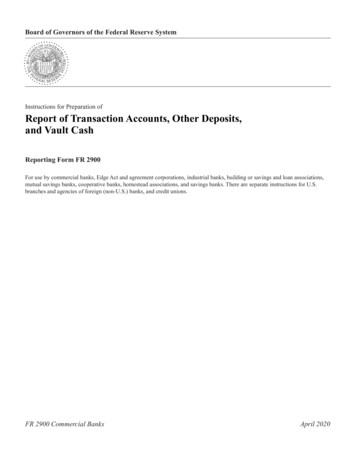
10is substantial compared to relatively stable average rejection rates during the prior years. Thelast three columns show averages of loan amount, applicant income, and census tract incomein thousands of dollars. The increase in all of these measures in 2008 suggest a shift in thecomposition of accepted applicants, specifically an increase in the share of applicants withhigher income. The lower table show a similar trend in the median of these values. Severalfactors could be at play behind these trends. First, one would expect lower income applicantsto be more likely to be affected by the crisis and thus their demand for mortgage loans couldhave decreased relatively more from previous year. Second, banks could have become moreselective during the crisis, due to the shortage in liquidity and the increased risk profile of applicants. The substantial increase in the rejection rate in 2008 suggests that the second factoris likely at play.We next motivate our empirical analysis by comparing the volume and the rejection rate ofbanks with different liability structure. We measure the extent of a bank’s reliance on insureddeposits by the ratio of deposits under 100,000 (core deposits) to total assets (henceforth,CD/A ratio). We divide banks into three categories of low, medium, and high CD/A as of2005. The category of low CD/A comprises banks with a CD/A below the 33th percentilein 2005, the medium CD/A category comprises banks with a CD/A above this limit but below the 67th percentile, and the higher CD/A comprises the rest of the banks. Figure 1 showsthe log of the volume of mortgage credit over the 2005-08 period. We find that, both in mean(upper panel) and in median (lower panel) low CD/A banks experienced a larger contractionin the volume of credit in 2008 compared to banks that relied more on core deposits.10 Sincethe bars represent changes in the log of volume we see that the percentage drop in volume oflending in 2008 compared to 2007 is three times larger for the low CD/A group compared tothe high CD/A group in means, and more than twice larger in medians.Figure 2 compares the evolution of the average and median rejection rates of banks in thesecategories. We also find that relative to 2005 and 2006, the rejection rate has increased substantially more for the low CD/A category than it did for the high CD/A both in mean and inmedian. Note that rejection rates are on average higher for the low CD/A group. One potentialexplanation is that mortgage operations could be carried differently between banks with different liability structure. For example, one would expect that banks that aggressively target alarge population of potential borrowers would have a higher rejection rates than banks that areless aggressive in their marketing strategy and are more transparent with their qualification10 TheCD/A ratio is relatively stable over that period, with a slight overall decrease between 2005 and 2007.Thus the choice of the year in which we define the CDA categories has no effect on these patterns. We keep thethree sub-samples balanced over the period to enhance comparability and avoid fluctuations due to entry and exitfrom the sub-samples.
11requirements. Investigating this difference is, however, beyond the scope of this paper. Ourmain interest is whether the patterns shown in Figure 1 and Figure 2 are indeed driven by thedifference in CD/A ratio across banks and not by the confounding factors, and the implications of this pattern on the supply of credit during the crisis. In the next section we lay out ourempirical strategy to estimate the impact of CD/A on the supply of mortgage credit by banks.III. BANK L ENDING D URINGTHEC RISISIn this section we study the impact of the crisis on lending by banks with a focus on the interaction of the crisis with their funding strategy. We discuss our estimation strategy, present thebenchmark empirical results, and then conduct a series of robustness tests.A. Empirical strategyOver the recent decades, banks have been increasingly relying on wholesale liabilities to fundand facilitate their operations (See, e.g. Feldman and Schmidt, 2001). The reliance by bankson wholesale funds, typically raised on a short-term rollover basis, has recently received anincreasing attention – following the severe liquidity shortages experienced prior and duringthe Great Recession. Unlike retail deposits, wholesale funds are uninsured liabilities for thebanks. This makes them more vulnerable to runs in times of financial stress (See, e.g. Huangand Ratnovski, 2011). This is particularly the case in countries with credible deposit insurance. In fact, absent the risk of devaluation, banks are likely to experience a net inflow of retail deposits during periods of stress in such countries, as suggested for example by evidencein Gatev and Strahan (2006).With this heterogeneity in mind, the immediate question we ask in this paper is the following:did the vulnerability of wholesale banks to liquidity shocks lead to a sharper decline in theircredit supply relative to other banks during the crisis? The overarching objective is to shedlight on the impact of liquidity on credit supply. Our empirical methodology allows us to answer this question and provide an insight on the bank lending channel using two sources ofidentifying variations: time variation in overall market liquidity and the cross-sectional variation in banks’ vulnerability to liquidity shortages.The time variation in market liquidity has been discussed in several recent papers such asAlmeida et
3For example, preceding its failure in 1984, Continental Illinois National Bank and Trust Company experienced a run from wholesale financiers but not from retail depositors. During the recent crisis, with the exception of Wachovia, runs from retail depositors in the U.S. were rare while wholesale runs became increasingly a threat