Transcription
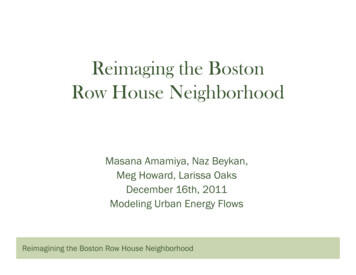
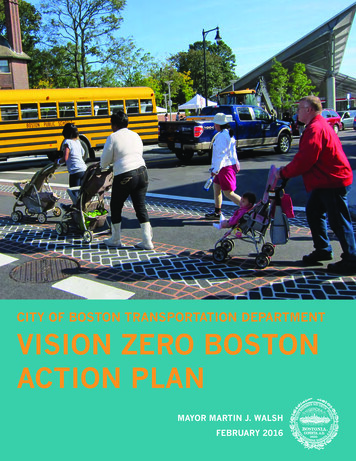
South EndThe South End is located to thesouthwest of Fort Point Channel,southeast of the Back Bayneighborhood, and north ofRoxbury and Dorchester.During the late nineteenth century and earlyWith the construction of the Prudential CenterToday, the South End remains a primarilytwentieth century, the South End received an influxtower in 1964 and the Copley Place retail, office,residential neighborhood. The housing stockof working-class immigrants. In the early 1900s,and hotel complex in 1983, market pressuresconsists of historic brick row houses, severalthe Washington Street Elevated rail line opened,started to bleed over into the South End. Thepublic housing developments, and some infill,running from Chinatown to Dudley Square andneighborhood experienced reinvestment from theincluding the recent Ink Block project, a reusethen ultimately to Forest Hills.1970s onward, intensifying over time. Reflectingof the Boston Herald site. The South End hasThe South End was built on fill starting in 1849.During the 1960s and 1970s, the area becamemarket pressures, the neighborhood has beenmain commercial corridors on Tremont Street,the site of several innovative projects to preserveColumbus Avenue, and Washington Street,affordable housing. The Villa Victoria project,the last of which is a Main Streets district. Theconsisting of 435 low-income housing units, wasneighborhood has major employment hubs at thecompleted during the 1970s, by the InquilinosBoston Medical Center and Boston UniversityBoricuas en Acción community developmentSchool of Medicine and has experienced ancorporation, using land provided by the Bostonexpansion of biotech light manufacturing. TheRedevelopment Authority. The Tent City project,area is primarily served by the Orange Line, asconsisting of 269 units of mixed-income housing,well as the Silver Line, which opened in 2002was completed in 1988, on land originally plannedand runs along Washington Street and connectsfor a parking garage.Downtown Crossing to Dudley Square.Washington Street, which extends through theSouth End, was the original street connectingBoston (the Shawmut Peninsula) to Roxbury,along the narrow “Great Neck.” The South Endwas designed to be a residential district for uppermiddle-class households, with brick row housesorganized around small parks, to relieve housingpressures in Downtown and Beacon Hill. Themajority of the construction occurred between1850 and 1880. With the development of the BackBay in the 1880s, the South End experienced newcompetition for upper-middle-class households.subject to urban renewal efforts. The state acquiredland along a 4.6-mile route in the South End,Roxbury, and Jamaica Plain, with the intent ofbuilding a new section of I-95 (the SouthwestExpressway) into Downtown Boston along theformer Penn Central/New Haven Railroad rightof-way. Community protests caused the projectto be halted. From 1979 to 1987, the land wasused to reroute the MBTA Orange Line, and theSouthwest Corridor Park was constructed on top.The Washington Street Elevated rail line, the lastremaining elevated section of the Orange Line, wassubsequently removed.CC Image courtesy of pacoseoaneperez on FlickrImage courtesy of Sasaki308 City of Boston: Climate Ready BostonFocus Areas 309
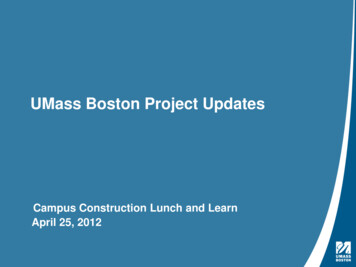
FLOOD PROGRESSIONThe South End is exposed to climate changeDEFINITIONSNear term: Beginning 2030s, assumes 9inches of sea level riseimpacts including heat, increased precipitationand stormwater flooding, and sea level rise andcoastal and riverine flooding. Exposure to heat andMidterm: Beginning 2050s, assumes 21inches of sea level risestormwater flooding are addressed in the CitywideLong term: Beginning 2070s or later,assumes 36 inches of sea level riseand consequences to coastal and riverine flood riskExposure: Can refer to people, buildings,infrastructure, and other resources withinareas likely to experience hazard impacts.Does not consider conditions that mayprevent or limit impacts.Vulnerability: Refers to how and whypeople or assets can be affected by ahazard. Requires site-specific information.Consequence: Illustrates to what extentpeople or assets can be expected tobe affected by a hazard, as a result ofvulnerability and exposure. Consequencescan often be communicated in terms ofeconomic losses.Annualized losses: The sum of theprobability-weighted losses for all fourflood frequencies analyzed for each sealevel rise scenario. Probability-weightedlosses are the losses for a single event timesthe probability of that event occurring in agiven year.*For a full list of definitions, refer to theGlossary in the Appendix.310 City of Boston: Climate Ready BostonVulnerability Assessment (see p.12), while exposureare further discussed in this section.The South End will havelimited exposure to coastalflooding until the second halfof the century, when very lowprobability coastal stormsoccur (0.1 percent annualchance event). Exposure tothese storms and the 1 percentannual chance event later inthe century is significant dueto a flood pathway throughFort Point Channel. Flooding isexpected to be severe enoughto flood portions of Roxbury.9 INCHES SEA LEVEL RISELEGEND21 INCHES SEA LEVEL RISE36 INCHES SEA LEVEL RISEFocus Areas 311
Until the middle of the century, the South EndThough not as significant of a flood pathwayis expected to have limited exposure to coastalas Fort Point Channel, there is some potentialflooding. Flooding originates from the coastfor flooding from Dorchester Bay throughthrough relatively narrow and few penetrationJoseph Moakley Park as soon as the 2070s. Thepoints. Nevertheless, a topographic thresholdtopography around Joseph Moakley Park and I-93is expected to be breached as a result of coastalis continuously low lying, potentially allowingstorms later in the century. In this case, thefloodwaters to propagate inland to the Southtopographic threshold refers to the point at whichEnd and Roxbury for coastal storm events withwater overtops grade and descends into lowerlower probability of occurrence (1 percent annualtopography to inundate a large area of typicallychance). This is particularly the case for long-dry land. This threshold exists at the railroadduration events, like nor’easters.crossing on the western side of Fort Point Channel1and will expose vast areas of the South End andsome northern reaches of Roxbury as soon as the2070s. Over 70 percent (450 acres) of the SouthEnd neighborhood alone will be exposed to lowprobability flood events during this time period.Resilience planning must consider that theprimary flood pathway for the South End isthrough Fort Point Channel. Opportunitiesmay exist for flood protections that defendthe South End and Roxbury, while alsobenefiting South Boston and Downtown.Of all Boston focus areas,the South End has thegreatest percentage of landarea per neighborhoodexposed to low-probabilitystorms expected by the endof the century.1MassDOT FHWA Report citation: Bosma, Kirk, et. al. “MassDOT-FHWA Pilot Project Report:Climate Change and Extreme Weather Vulnerability Assessments and Adaptation Optionsfor the Central Artery.” Jun. 2015, ironmental/SustainabilityEMS/Pilot Project Report MassDOT FHWA.pdf.312 City of Boston: Climate Ready BostonFocus Areas 313
EXPOSUREPOPULATION & INFRASTRUCTURESOUTH END POPULATION EXPOSUREPOPULATION AND SOCIAL VULNERABILITYINFRASTRUCTUREThe South End is home to 38,600 people. While theEnd are mostly concentrated in its more than 3,300 unitsLate in the century, the South End’s majorroads and evacuation routes, in additionto the Orange and Silver Line routesin the neighborhood, will be exposedto flooding, potentially compromisingconnectivity between Downtown andinland neighborhoods.of subsidized and public housing developments. TheAs soon as the 2050s, portions of the Orange Linefollowing public housing developments in the South Endroutes through the South End will be exposed tohave at least some portion exposed to low-probabilityflooding from low-probability events (1 percentflood impacts later in the century: Cathedral, Torreannual chance); high-probability events expectedUnidad, West Newton, Rutland, Frederick Douglas,later in the century (10 percent annual chance) willWashington Manor, Hampton House, Camden, andexpose large sections of the Silver Line that runLenox. Together, they make up almost half of the Souththrough the South End. The MBTA’s Albany StreetEnd’s public housing stock.Garage is also exposed to flood impacts from low-South End boasts high residential real estate values andis generally considered an affluent area, it is home tomore than 11,600 low-to no-income residents, 30 percentof the neighborhood population (higher than Boston’s28 percent average). Vulnerable populations in the SouthAs soon as the 2070s, almost 70 percent of theSouth End’s population, 27,000 residents, willbe exposed to flooding under low-probabilityevents (1 percent annual chance).Over 4,700 South End residents are expected to requireshelter for this scenario. Current shelter capacity inthe South End is 250 people. The South End’s sheltercapacity is likely to be further reduced in the caseof a flood event. In the late century, the Blackstone23Source: Boston University. “The Menino Pavilion – Boston MedicalCenter.” Website. Accessed August 2016. no-pavilion/A site-specific review of the Boston Medical Center is necessary.314 City of Boston: Climate Ready Bostonprobability events expected later in the century,which may affect the bus fleet that serves localimpacts later in the century (10 percent annualchance event). The pump station is a combinedsewer facility and has redundant pumps andgenerators in place to cover both mechanical andelectrical failures, should they occur.The South End may experience reducedemergency response capacity later inthe century.Throughout the South End, the EMS Headquarters,one Boston Police station, and two of three firestations will be exposed to high-probability floodevents as soon as the 2070s (10 percent annualchance). Widespread exposure in the area will alsoimpact roads and complicate traveling for responsevehicles, as described above.operations in not only the South End but also inDowntown and South Boston. In the longer term,In the late century, the entire Boston Medicalextended repairs to these systems could disruptCenter and Boston University Medical campuscommutes back into these two economic centers.could be exposed to flood impacts, including theroutes. These potential transportation impactscould hinder evacuation and disaster responseFurthermore, important transportation corridorsSchool, which serve as emergency shelters for thein the South End, including Tremont Street,neighborhood, will be exposed to flooding fromMassachusetts Avenue, Albany Street, I-93 South,high-probability events, potentially reducing theand Melnea Cass Boulevard at the border withneighborhood’s current shelter capacity by more thanRoxbury, all will have some portion exposed to60 percent. There are two emergency shelters in theflood impacts from high-probability flood eventsnorthern portion of Roxbury, which are not expected to(10 percent annual chance) later in the century.residents from South End and South Boston, as needed.also may be exposed to high-probability floodSome of the area’s top economicindustries, the Boston Medical Center andBoston University Medical Campus, will beexposed to late-century flooding.routes, Mass Pike Express routes, and crosstownCommunity Center and McKinley Elementarybe exposed to flood impacts and may be able to shelterIn the South End, the Union Park pump stationBoston Water and Sewer Commissionoperations depend upon uninterruptedpower service in the South End andnorthern Roxbury areas.Menino Pavilion. The emergency room at theMenino Pavilion has the greatest volume of anytrauma program in the Northeast, with more than100,000 patients treated each year.2 Full or partialservice interruption at Boston Medical Center willlikely have an effect on the nearest emergencymedical facilities, including New England BaptistHospital (which has announced that it is planningto relocate) or the VA Hospital, both in MissionHill, as they endure the surge of relocated andredirected patients.3Focus Areas 315
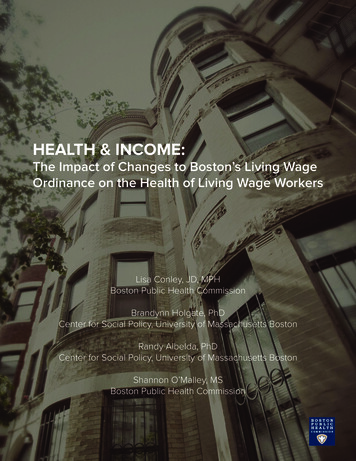
EXPOSURE AND CONSEQUENCESBUILDINGS AND ECONOMYRISK TO BUILDINGSSOUTH END BUILDING EXPOSUREResidential buildings located alongChandler Street are mostly split-level,three-story row houses and couldexperience significant flooding oncewaters are high enough to reachabove grade.In the near term, approximately 50 buildings inthe South End are at risk to very low-probability,yet severe, coastal storms (0.1 percent annualchance event). The first structures expected tobe impacted are located along Chandler Street,east of Clarendon, as well as just north of theMassachusetts Turnpike adjacent to Frieda GarciaPark. As soon as the 2050s, broad swaths of theSouth End neighborhood can be expected to beexposed to coastal flooding for the same eventscenario.The South End is in the top three exposedfocus areas in Boston toward the end ofthe century, with close to 200 million inannualized structure damage and relatedlosses possible.SOUTH END MARKET VALUE EXPOSUREAs soon as the 2070s, high-probability coastal floodevents (10 percent annual chance) may impactover 3,000 structures in the South End. The SouthEnd is also expected to experience the highestaverage flood depth inside structures citywide forthe 1 percent annual chance flood event in the latecentury. The scale of loss to coastal flood impactscould potentially be mitigated through relativelyinexpensive and focused projects to cut offflooding into the low-lying areas of the community.Image courtesy of Sasaki316 City of Boston: Climate Ready BostonFocus Areas 317
RISK TO ECONOMYThe South End alone currently contributes over20,000 jobs and 3.6 billion in output to the city’sannual economy. Healthcare is the top industry interms of both employment and output. Economicimpacts to the communities are expected to be lightuntil later in the century, when the topographicthreshold described above is breached. As soon asthe 2070s, unmitigated flood impacts could yieldannualized output loss in excess of 60 million andannualized job loss around 330. The top affectedindustries at that point are expected to be realestate (due to the large areas of residential propertyimpacted), hospitals, and restaurants. Restaurantsare expected to experience the largest job impactsas a result of flooding late in the century.Though flooding originates from thecoast through relatively narrow andfew penetration points, a topographicthreshold is expected to be breachedsometime mid- to late century as a resultof coastal storms. This would lead to over 200 million in annualized expected directphysical damage to structures and theircontents late in the century.318 City of Boston: Climate Ready BostonSOUTH END ECONOMIC LOSSESECONOMIC RISK ASSUMPTIONSJob and output loss includes direct, indirect,and induced consequences of floodimpacts. Direct results are impacts feltwithin a neighborhood, while indirect andinduced results are those expected to befelt throughout Suffolk County as a resultof changes in spending patterns. Resultsfor both job and output losses are the sumof annualized values for the four floodfrequencies analyzed for each sea levelrise scenario. This represents a lower-boundestimate for several reasons. First, not allprobabilistic events are considered. Second,the analysis assumes that all impactedbusinesses eventually reopen, though FEMAestimates that almost 40 percent of smallbusinesses—and up to 25 percent of allbusinesses—never reopen after experiencingflood impacts. Third, only building areasdirectly impacted by floodwater areassumed to experience business interruption.This does not consider interruptions ofbusinesses due to loss of power or utilityfunctions. Finally, the analysis only considersexisting populations, businesses, and buildingsand does not include projections for futuregrowth. Refer to the Appendix for a moredetailed explanation of the exposure andconsequence analysis.INDUSTRYSouth End could experiencethe deepest average flooddepth to flooded structureslate in the century if flood riskgoes unmitigated (1 percentannual chance flood event).SOUTH END ANNUALIZED LOSSESANNUALIZED LOSS OFECONOMIC OUTPUTReal estate 12,100,000Restaurants 5,800,000Hospitals and othermedical facilities 7,600,000Wholesale trade andretail 1,700,000All other industries 36,100,000Total 61,600,000Focus Areas 319
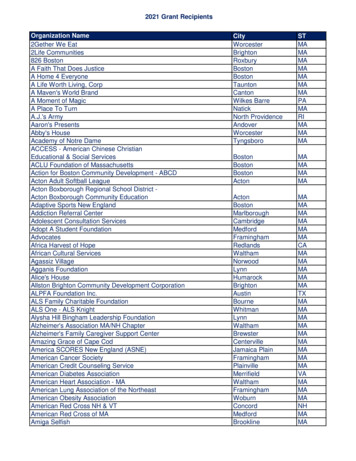
EXPECTED ANNUALIZED LOSSES TO STRUCTURES AND CONTENTS36 INCHES OF SEA LEVEL RISE AT 10%, 2%, 1%, 0.1% ANNUAL CHANCE COASTAL FLOOD EVENTS.Probable annualized losses are based on generalizedassumptions, as opposed to site-specific assessment ofstructures. Site-specific evaluations of vulnerability arebeyond the scope of this assessment and should bereserved for detailed evaluation of specific resilienceinitiatives or a next phase of this project.SOUTH END ANNUALIZED LOSSES36 INCH SEA LEVEL RISE CONDITIONEach circle represents annualized losses suffered by anindividual building. Larger circle size indicates higher contentsand structures losses. Annualized losses take into considerationthe annual probability of an event occurring, as well as theprojected impacts of such an event.320 City of Boston: Climate Ready BostonFocus Areas 321
SOUTH ENDAPPLICATION OF RESILIENCE INITIATIVESPROTECTED SHORESTo reduce the risk of coastal flooding at major inundationPRIORITIZE AND STUDY THEFEASIBILITY OF DISTRICTSCALE FLOOD PROTECTIONconstructing district-scale flood protection at the primarypoints, the City should study the feasibility offlood entry points for the South End (see PotentialFlood Protection Locations below for a preliminaryidentification of locations and potential benefits). Asdescribed below, flood protection systems that wouldbenefit the South End would likely be located outside ofthe South End, in South Boston, Dorchester, and by theNew Charles River Dam.These feasibility studies should feature engagementwith local community stakeholders, coordinationwith infrastructure adaptation, and considerations ofhow flood protection would impact or be impactedby neighborhood character and growth. Examples ofprioritization criteria include the timing of flood risk,consequences for people and economy, social equity,financial feasibility, and potential for additional benefitsbeyond flood risk reduction.In the near term, coastal flood risk in theSouth End is modest and likely does notrequire district-scale flood protection.Later in the century, the South Endwill be exposed to flooding from FortPoint Channel and other inland floodpathways, so combined flood protectionat multiple locations will be critical: At Dorchester Bay, addressing inlandflood pathways originating from theOld Harbor and Savin Hill Cove. At the South Boston Waterfront,SLR SCENARIODISTRICT SCALE FLOOD PROTECTIONFOR 1% ANNUAL CHANCE FLOOD59” SLR(2030s–2050s)None621” SLR(2050s–2100s)The South Boston Waterfront andDorchester Bay locations combined36” SLR(2070s or later)The New Charles River Dam, SouthBoston Waterfront, and DorchesterBay locations combinedAdditional flood protection may be required for flood events more severe than the1 percent annual chance flood. See Appendix for more detailed information onexpected effectiveness of flood protection systems, including analysis of additionalflood protection locations and flood frequencies.56Benefits of district-scale flood protection would be modest.addressing inland flood pathwaysoriginating from Fort Point Channel,Boston Harbor, and the ReserveChannel At the New Charles River Dam,addressing potential overtopping orflanking of the dam.New CharlesRiver DamSouth BostonWaterfrontPOTENTIAL DISTRICT-SCALE FLOOD PROTECTIONLOCATIONS 4See District-Scale Flood Protection Systems section for a citywideperspective on district-scale flood protection. District-scaleflood protection is only one piece of a multi-layered solutionthat includes prepared and connected communities, resilientDorchesterBayinfrastructure, and adapted buildings.These preliminary coastal flood protection concepts are based on a high-level analysis of existingtopography, rights-of-way, and urban and environmental conditions. Important additional factors, includingexisting drainage systems, underground transportation and utility structures, soil conditions, zoning, as wellas any potential external impacts as a result of the project have not been studied in detail. As described inInitiatives 5-2 and 5-3, detailed feasibility studies, including appropriate public and stakeholder engagement,are required in order to better understand the costs and benefits of flood protection in each location.4322 City of Boston: Climate Ready BostonFocus Areas 323
LOCATIONS The South Boston Waterfront location,DETAILED CONSIDERATIONS Multiple locations required to address floodPREPARED &CONNECTEDCOMMUNITIESIn the long term, the City should conduct outreachCONDUCT AN OUTREACHCAMPAIGN TO PRIVATEFACILITIES THAT SERVEVULNERABLE POPULATIONSTO ENSURE THAT THEYENGAGE IN EMERGENCYPREPAREDNESS ANDADAPTATION PLANNINGevacuation plans under current regulations. Targetedto managers of facilities in the South End that servesignificant concentrations of vulnerable populations andare not required to have operational preparedness andfacilities will include affordable housing complexes,described in the South Boston focus area (seerisk: For very low-probability events (0.1p.282), addresses flood entry points along thepercent annual chance) in the near termedge of the district. As an alternative to floodand into the second half of the century,protection for the entire South Boston Waterfront,flood exposure from both Fort Pointa flood protection system along the southwesternChannel and Dorchester Bay are expectedportion of the Fort Point Channel could provideto impact portions of the South End,flood protection benefits for parts of South Boston,requiring district-scale flood protectionin the century, meaning that the South End focus areaas well as other areas, from Fort Point Channelsolutions. Later in the century, floodhas a longer adaptation window. Illustrative examplesflooding. However, since protection for the entireprotection solutions at the South Bostonof the types of facilities to which the City might conductSouth Boston Waterfront would provide muchWaterfront and Dorchester Bay may not beoutreach include the Ellis Memorial Early Education andgreater benefit in both the near term and theindependently effective for the 1 percentCare Program, Eagle’s Nest Learning Center, and Pinelong term, this Fort Point Channel alternative isannual chance event and events withVillage Preschool. These facilities will be exposed to long-unlikely to be necessary. Flood entry points fromlower probability of occurrence, requiringterm damage from sea level rise and coastal flooding orthe southwestern portion of the Fort Point Channelinterventions at the New Charles River Damcan expect access issues related to stormwater flooding inshould still be considered among planning andto impede flooding from the Charles River.the same time frame.redevelopment projects in the area and potentiallyWhile investments at all three locations mayaddressed in order to provide multiple lines of floodbe significant, losses avoided are expectedprotection for inland areas.to be substantial because an integrated The Dorchester Bay location, described in theDorchester focus area (see p.194), addressesflood pathways from the Old Harbor andsubstance abuse treatment centers, daycare facilities,food pantries, small nonprofit offices, and others. TheCity should conduct outreach in the long term becausewidespread flooding in the neighborhood is not expectedfor the 1 percent annual chance flood event until later7The City did not review the extent of existing preparedness planning as part of this study.system could protect Downtown, SouthBoston, Dorchester, the South End, Roxbury,and neighborhoods along the Charles River.Savin Hill Cove. The New Charles River Dam location,described in the Charles River and Downtownfocus areas (see pp. 174, 216), addressespotential overtopping or flanking of the dam.324 City of Boston: Climate Ready BostonFocus Areas 325
PREPARED &CONNECTEDCOMMUNITIESThe City should reach out to small businesses in SouthEXPAND BOSTON’S SMALLBUSINESS PREPAREDNESSPROGRAMlow-cost physical adaptations. In the South End, there areBoston exposed to stormwater flooding risk in the nearterm to help them develop business continuity plans,evaluate additional insurance coverage needs, and identifyRESILIENTINFRASTRUCTUREThe Infrastructure Coordination Committee (ICC) shouldESTABLISH INFRASTRUCTURECOORDINATION COMMIT TEEwater and sewer, energy, telecommunications, andsupport coordinated adaptation planning for the SouthEnd’s key infrastructure systems, including transportation,environmental assets. In the near term, the City shouldapproximately 30 commercial buildings and 180 mixed-support the MBTA in conducting a full asset-leveluse buildings that could host small businesses exposed tovulnerability assessment of its system.stormwater flooding in the near term. It is important to notethat, in the near term, Tremont Street and MassachusettsAvenue, which are both key commercial corridors, will beexposed to stormwater flooding. The Washington GatewayMain Street District will also have portions exposed toPROVIDE GUIDANCE ONPRIORITY EVACUATIONAND SERVICE ROADINFRASTRUCTURE TO THE ICCThe Office of Emergency Management should work withthe Boston Transportation Department, Department ofPublic Works, and private utilities to provide guidanceon critical roads to prioritize for adaptation planning,stormwater flooding in the near term and will be exposedincluding evacuation routes and roads required to restoreto coastal storm and sea level rise impacts during high-or maintain critical services. With 21 inches of sea levelprobability storms later in the century.rise, under the 1 percent annual chance flood event,portions of I-93 near Tremont Street, Arlington Street, andBerkeley Street will be exposed to coastal and riverineflooding.CONDUCT FEASIBILITYSTUDIES FOR COMMUNITYENERGY SOLUTIONSThe 2016 Boston Community Energy Study identifiedthree potential locations for Energy Justice or emergencymicrogrids: along Massachusetts Avenue, along TremontStreet, and at Public Alley 706. The EnvironmentDepartment should work with local stakeholders andutility providers to explore these locations. All threelocations have significant exposure to flooding under the1 percent annual chance event with 36 inches of SLR.326 City of Boston: Climate Ready BostonFocus Areas 327
ADAPTED BUILDINGSUpon amending the zoning code to support climatePROMOTE CLIMATEREADINESS FOR PROJECTS INTHE DEVELOPMENT PIPELINEand Development Agency (BPDA) should immediatelyreadiness (see Initiative 9-2, p.135), the Boston PlanningPREPARE MUNICIPALFACILITIES FOR CLIMATECHANGEThe Office of Budget Management should work with Citydepartments to prioritize upgrades to municipal facilitiesin South End that demonstrate high levels of vulnerabilitynotify all developers with projects in the development(in terms of the timing and extent of exposure),pipeline in the future floodplain that they may alter theirconsequences of partial or full failure, and criticality (withplans in a manner consistent with the zoning amendmentshighest priority for impacts on life and safety) from coastal(e.g., elevating their first-floor ceilings without violatingflooding in the near term. Later in the century, there are abuilding height limits), without needing to restart thenumber of Boston Housing Authority developments thatBPDA permitting process.are expected to be exposed to coastal flooding, as well asaccess issues related to stormwater flooding. These sitesINCORPORATE FUTURECLIMATE CONDITIONS INTOAREA PLANS AND ZONINGAMENDMENTSESTABLISH A CLIMATE READYBUILDINGS EDUCATIONPROGRAM FOR PROPERTYOWNERS AND ESTABLISH ARESILIENCE AUDIT PROGRAMThe Boston Planning and Development Agency shouldinclude Camden, Cathedral, Frederick Douglas, Hamptonincorporate future climate considerations (long-termHouse, Lenox, Rutland/West Newton, Torre Unidad, andprojections for extreme heat, stormwater flooding, andWashington Manor. The City will also prioritize addingcoastal and riverine flooding) into major planning effortsbackup power to emergency shelters that do not yet havein the South End.power system redundancies. By later in the century, thereThe City should develop and run a Climate ReadyBuildings Education Program and a resilience auditprogram to inform property owners about their currentwill be a strong need for shelter capacity in the SouthEnd unless flood risk is mitigated, which will require allexisting shelters to be prepared.and future climate risks and actions they can undertaketo address these risks. A resilience audit should helpproperty owners identify cost-effective, building-specificimprovements to reduce flood risk, such as backflowpreventers, elevation of critical equipment, and deployableflood barriers; promote interventions that addressstormwater runoff or the urban heat island effect, such asgreen roofs or “cool roofs” that reflect heat; and encourageowners to develop operational preparedness plans andsecure appropriate insurance coverage. The resilience auditprogram should include a combination of mandatory andvoluntary, market-based and subsidized elements.328 City of Boston: Climate Ready BostonFocus Areas 329
308 City of Boston: Climate Ready Boston Focus Areas 309 South End The South End is located to the southwest of Fort Point Channel, southeast of the Back Bay neighborhood, and north of Roxbury and Dorchester. The South End was built on fi ll starting in 1849. Washington Street, which extends through the South End, was the original street .