Transcription
1Gordon Wolf et al.: Likert-Type Response OptionsGevirtz Graduate School of EducationInternational Center for School Based Youth DevelopmentJanuary 2019An Analytic Approach for Deciding Between 4- and 6-pointLikert-Type Response OptionsMelissa Gordon WolfKaren Nylund-GibsonErin DowdyMichael FurlongThe research reported in this paper was supported in part by the Institute of Education Sciences, U.S.Department of Education, through Grant # R305A160157 to the University of California, SantaBarbara. The opinions expressed are those of the authors and do not represent views of the Institute ofEducation Sciences or the U.S. Department of Education.www.project-covitality.infoUC Santa Barbara Project Covitality
2Gordon Wolf et al.: Likert-Type Response OptionsABSTRACTThis paper presents a framework for choosing between 4-and 6-point response options for use withonline surveys. Using data that have both 4- and 6-point Likert-type items, we compare correlations, fit offactor analytic models, and several different reliability estimates as a way of identifying if there is empiricalsupport for choosing a response option with more categories. Results indicate that the instrument hadslightly better psychometric properties with a 4-point response option, although the estimates for bothresponse options were acceptable. From a statistical perspective, there was no rationale to switch to a 6point response option when a 4-point response option was already in place.INTRODUCTIONSelecting the number of response options to include on a rating scale in a psychologicalmeasure is an under-scrutinized challenge of instrument development for researchers. One popularrating scale format, known as a Likert scale (1932), is often used to assess the magnitude of an attitudeor belief about a construct. A plethora of research over the last 80 years has examined how manyresponse options are optimal when using Likert scales. Typically, this research has focused on selectingthe number of response options that optimize the psychometric properties of the instrument, whilesimultaneously both reducing the cognitive burden on the respondent and preserving the richness ofinformation that can be gleaned from the data. Understanding the cognitive burden of a chosenmeasure involves a range of things including what is being measured and how many responses optionsare distinguishable by the respondent given the target population (e.g., age, knowledge level). Thesecharacteristics are often studied using interviews of respondents. In this paper, we focus on the statisticalattributes related to determining the number of response options.When concerned with optimizing the psychometric properties of an instrument, the focus isoften on the reliability and validity evidence in support of the instrument’s score inferences (Lietz, 2010).Reliability, often estimated by measures of internal consistency, assesses the degree to whichparticipants respond similarly to items designed to measure the same underlying construct. Thoughthere are many ways to estimate reliability coefficients, the most commonly used methods includecalculating Cronbach’s alpha, item-item correlations, item-total correlations, Coefficient Omega,Coefficient H, and factor loading strengths (Borgers, Hox, & Sikkel, 2004; Leung, 2011). To find evidenceof validity that support of the uses of the instrument, researchers often focus on establishing a consistentfactor structure for the set of items (i.e., construct validity) and correlating the instrument with similar anddissimilar constructs (i.e., convergent and divergent validity, respectfully). Descriptive statistics, such asskew and kurtosis, are generally evaluated as well (Dawes, 2002).To date, there is no commonly accepted standard for determining the number of responseoptions (Krosnick & Presser, 2010). When evaluating the ideal number of response options,recommendations from the literature are varied. For example, Rodgers, Andrews, and Herzog (1992)investigated the effect of using items with 2 to 10 response categories and concluded that expectedvalues of validity coefficients increased by approximately .04 with each additional response option. Incontrast, Bendig (1954) and Mattell and Jacoby (1971) studied the effect of using response categoriesranging from 2 to 9 and found negligible impact on reliability estimates when the number of responsecategories was increased. Bloom, Fischer, and Orme (2003) suggest that 9-point scale may be the idealnumber of response options as long as the respondent is able to make distinctions among the presentedresponse options. However, Borgers et al. (2004) suggested the use of a 4-point scale as an optimumwww.project-covitality.infoUC Santa Barbara Project Covitality
Gordon Wolf et al.: Likert-Type Response Options3after conducting studies varying the number of response options and including a neutral point on theresulting reliability. Meanwhile, Preston and Coleman (2000) found that predictive validity and item-itemcorrelations improved with a larger number of response options.Other studies have found no differences in terms of reliability and validity evidence whenaltering the number of response options. Chang (1994) used a model approach to evaluate 4- and 6point scales and concluded that the scale points had no effect on criterion-related validity. J. Lee andPaek (2014) and Lozano et al. (2008) also found virtually no difference in the psychometric propertiesfor an instrument when using a 4- and 6-point scale. Further, Dawes (2002) found that item skew andkurtosis were the same between a 5-point and 11-point scale. Additionally, research by J. Lee and Paek(2014) found that the psychometric properties of 2- and 3-point response options were less optimal thanthose with four or more, although they report no differences in the typical measures of validity andreliability for response options greater than four.Although it is important to establish strong psychometric properties of an instrument, statisticsshould not guide theory in terms of instrument development. Since many statistical approaches rely oncorrelations among variables, there needs to be variation among the items. If more response optionsare used with the intent of finding more variation, it may result in larger reliability coefficients, thoughthis is a statistical artifact and not a reflection of “good” items (J. Lee & Paek, 2014; Lozano, García-Cueto,& Muñiz, 2008; Muñiz, García-Cueto, & Lozano, 2005). Additionally, items that have a smaller number ofresponse options are sensitive to small sample sizes and violations of normality when they are used infactor analysis, which necessitate the use of alternative estimation methods for modeling categorical orordinal data (Rhemtulla et al., 2012). The creation of a psychological measure and the selection ofresponse options should be grounded primarily in theory rather than optimal psychometric propertiesor “convenience and tradition” (Lee & Paek, 2014, p. 664).Study PurposeIn this current study, we set out to explore if there was any empirical evidence in support of a 4or 6-point response option for the items on one measure designed to measure the psychologicalstrengths in students, the Social Emotional Health Survey-Secondary (SEHS-S; Furlong, You, Renshaw,Smith, & O’Malley, 2014). Since its inception, the SEHS-S has been administered using a 4-pointresponse option. However, considering alternative response formats are an important, yet oftoverlooked aspect of ongoing scale development and refinement; thus, an alternative 6-point responseformat was considered.The goal is to provide enough response options to capture the underlying variation in thepopulation, but not too many as to create too much distinction that artificially creates variation. Inaddition, we were curious if adding more response options would result in better model fit/predictivevalidity, more variability in responses, and finer discriminations between categories and persons. Inaddition to evaluating if a 4- or 6-point response option format would enhance the psychometricproperties of the SEHS-S, we also aimed to provide a more generalized methodological contribution.Our hope is that by presenting the rational and analyses used to determine the optimal number ofresponse options for the SEHS-S, we can provide an example of how the procedures can be used withother psychological measures.www.project-covitality.infoUC Santa Barbara Project Covitality
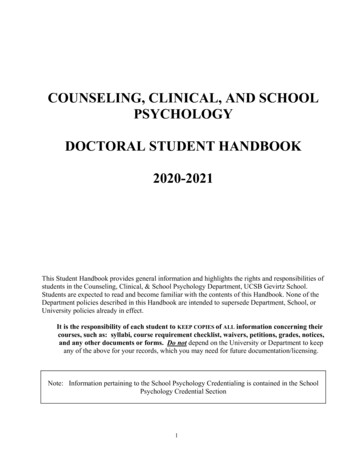
4Gordon Wolf et al.: Likert-Type Response OptionsMETHODParticipantsThe data used in this study come from students in two public secondary schools in the westernUnited States in Grades 9-12. All students in both schools were invited to participate in the survey if theyreceived parental permission. Slightly more than half (52.4%) of the sample identified as female.Participants identified predominantly as Latinx (62.1%) and White (22.1%). We used two independentdatasets: (a) a sample of n 1,866 where the SEHS-S was measured using a 4-point response option,and (b) a second, independent sample of n 1,889 where the SEHS-S was measured on a 6-pointresponse scale. Survey data were collected online using Qualtrics.The Social Emotional Health Survey-Secondary (SEHS-S)The Social Emotional Health Survey-Secondary (SEHS-S) is an instrument designed to assessstudent’s psychological strengths (Furlong etal., 2014). This scale is widely used with strong empiricalresults supporting its psychometric properties (Furlong et al., 2014; S. Y. Lee, You, & Furlong, 2016; Youet al., 2013; You, Furlong, Felix, & O’Malley, 2015). The SEHS-S has a hypothesized higher-orderstructure, depicted in Figure 1 (see Appendix), such that 36 survey items map onto 12 hypothesizedsub-factors (each with three items), which map onto four hypothesized overall factors (each with threesub-factors), and one hypothesized overall measure of covitality.To evaluate the differences between 4- and 6-point response options, the SEHS-S items wereadministered to two different populations with both 4-point and 6-point response options. The responseoptions for the 4-point scale were: not at all true of me, a little true of me, pretty much true of me, andvery much true of me. The response options for the 6-point scale were: mot at all like me, not like me,not much like me, somewhat like me, like me, and very much like me. Lower values correspond to lowerlevels of self-reported strengths.To evaluate the convergent and discriminant validity of the SEHS-S, we utilized a one-itemmeasure of life satisfaction (convergent) and the aggregate of a 10-item measure of social emotionaldistress (SEDS; discriminant). The SEDS is a complimentary instrument to the SEHS-S designed toevaluate a person’s strengths and weaknesses simultaneously; in other words, to evaluate the “wholestudent” (Dowdy, Furlong, Nylund-Gibson, Moore, & Moffa, 2018).Analytic ApproachWe used several approaches to see if there was psychometric evidence to guide our selectionof a 4- or 6-point response option. Our choice of methods for making comparisons was based on similarstudies which compared response options (Leung, 2011) and criterion found in the literature (Lietz,2010; Rodgers et al., 1992). Specifically, we used the following set of analyses to compare the responseoptions: descriptive statistics (skew and kurtosis), reliability indices, model fit using confirmatory factoranalysis (CFA), factor loadings, inter-item correlations, and predictive validity.We utilized three different measures of reliability: Cronbach’s alpha, omega, and coefficient H(Mcneish, 2017). Higher values indicate that there is more shared covariance between the items thanunique variance, giving us confidence that the items are reflective of the same underlying construct.Ideally, we expect to find an alpha of at least .70 (on a scale of 0 to 1) to indicate a sufficiently highreliability coefficient (Streiner, 2003). We also evaluated the average inter-item correlations for eachwww.project-covitality.infoUC Santa Barbara Project Covitality
5Gordon Wolf et al.: Likert-Type Response Optionsfactor; values between .20 and .50 are considered to be satisfactory (Clark & Watson, 1995). It is worthnoting that inter-item correlations have an upper bound to account for item redundancy; theseguidelines are contradictory to the recommendations for alpha, whereby the higher values, closer to 1,are considered best without bound. To evaluate the normality of the response option distributions, weestimated the skew and kurtosis of each item with the hope of finding values between /- 2 (Trochim &Donnelly, 2006).Given the ordinal nature of our response scales, some studies suggest that more responseoptions might elucidate more normally distributed responses (Bloom et al., 2003; Leung, 2011). As it isnot advisable to use maximum likelihood estimation for categorical response data with less than fivecategories (Rhemtulla et al., 2012), we utilized two estimation methods: maximum likelihood with robuststandard errors (MLR), which is typically utilized for continuous data, and robust unweighted categoricalleast squares (UWLS1) which is typically utilized for categorical data (J. Lee & Paek, 2014; Rhemtulla,Brosseau-Liard, & Savalei, 2012). Model fit was evaluated using the root mean square error ofapproximation (RMSEA) and the comparative fit index (CFI) (Brown, 2015). According to Brown (2015),good model fit for the RMSEA suggests a value less than .08, while good model fit for the CFI suggestsa minimum value of .90. All models were fit in Mplus, version 8 (Muthen & Muthen, 1998-2017). Anymissing data was imputed using multiple imputation.Table 1. Model fit indices of the confirmatory factor analyses for the 4-point and 6-point modelsestimated using maximum likelihood estimation with robust standard errors, and unweighted leastsquares estimation.EstimationResponseOptionc2dfCFIRMSEA (90% CI)SRMRMLR4-point1654.4544.958.034 [.032, .035].046MLR6-point1860.09578.936.034 [.033, .036].048UWLS4-point2861.49544.938.049 [.047, .050]n/a.058 [.056, .059]n/a6-point4213.93578UWLS.897Note. n/a SRMR is not available when using UWLS estimation.RESULTSThe skew and kurtosis for both the 4- and 6-point scale were within acceptable ranges ( /- 2). Inaddition, the model fit for all the CFA models (except the 6-point response option estimated usingUWLS) was good: the models had CFI’s greater than .90, RMSEA’s less than .05, and SRMR’s less than.05 (see Table 1). Upon evaluating the item and factor loadings across both estimation methods andboth response options, we determined that all factor loadings were similarly high. However, the loadingswere higher for the 4-point response option for more than 90% of the items across both estimationtechniques (see Tables 2 and 3 in Appendix).Factor reliabilities in Table 4, calculated using Omega total were similar although1Robust weighted least squares is typically considered for categorical response options (Lipsitz et al. 2017) butrecent research shows that robust unweighted least squares performs better (Rhemtulla et al., 2012).www.project-covitality.infoUC Santa Barbara Project Covitality
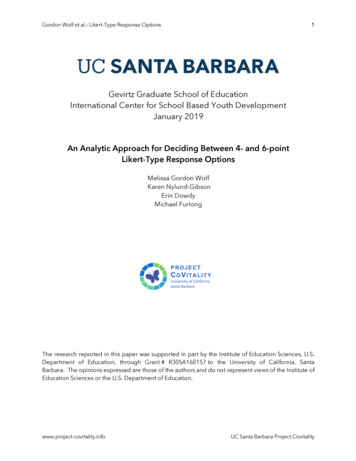
6Gordon Wolf et al.: Likert-Type Response Optionshigher for the 4-point response option. Given the popularity of Cronbach’s alpha in theliterature for the evaluation of reliability, and thus popular criteria for selecting the number ofresponse options, it is included in Table 4 as well (the results are similar although downwardbiased due to the lack of tau-equivalence). The inter-item correlations in Table 4 were largerthan the recommended upper bound value of .50 for both the 4- and 6-point response options(except for the Self Control factor). The 6-point response option had lower correlations,however, which were closer to the upper bound recommendation of .50 found in the literature(Clark & Watson, 1995). This is an expected finding since the alpha values for the 4-pointresponse option were higher, and it is impossible to have very high alphas without high interitem correlations when there are only three items per factor.Table 4. First-level factor reliabilities and inter-item correlations for 4- and 6-point response scalesusing MLR.OmegaCoefficient HCronbach's AlphaAverage InterItem Correlation4-point 6-point 4-point 6-point 4-point 6-point 4-point rsistence.710.638.714.644.708.633.447.366School Support.871.790.872.796.870.783.691.550Family Coherence.897.880.905.880.895.879.740.708Peer Support.885.839.902.847.879.834.712.631Emotional 9Gratitude.918.852.924.858.917.850.786.651Note. Bolded values indicate the higher reliability when comparing 4- and 6-point response optionsfor each coefficient.Upon evaluating the predictive validity via a structural equation modeling framework(estimated using UWLS; see Figure 2 in Appendix), we determined that the structural relationswere stronger for the 4-point response option, as was the model fit (the CFI for the 6-pointresponse option was under .90).DISCUSSIONUsing evaluative tools commonly found in the literature, we set out to see if there was anyempirical evidence to suggest that the 6-point response option for the SEHS-S provided better modelfit or discriminated better between response options than the previously used 4-point response option.Based on our results, we did not find any evidence suggesting that the use of a 6-point response optionwww.project-covitality.infoUC Santa Barbara Project Covitality
7Gordon Wolf et al.: Likert-Type Response Optionswould produce better model fit. Model fit, loadings, and reliabilities were similar across both responseoptions, with better fit and higher loadings for the 4-point scale, which was not that surprising given thatsome research suggests there are not significant differences between a 4- and 6-point response optionin terms of optimal psychometric properties (J. Lee & Paek, 2014). Considering the predictive validity ofthe SEHS-S, model fit statistics were subpar for the 6-point response option. Given the expected largesample sizes, the normally distributed response patterns, the limited number of response options, andconsidering that the 4-point response scale on the SEHS-S is widely adopted, we found no reason toswitch to a 6-point response option. Practical considerations, and the lack of empirical evidence insupport of the 6-point response option, suggest that it is advisable to continue to use the 4-pointresponse option.Beyond the pragmatic implications of this study’s findings for the optimal presentation of theSEHS-S items, this study also provided an example of an empirical approach for other researchersengaged in instrument development when they are evaluating the optimum number of responseoptions for use with adolescents when assessing psychological mindsets. The literature indicated thatwe could expect at best a modest improvement between a 4- and 6-point response option. However,we found that the psychometric properties were generally slightly better with a 4-point response option.With other considerations being similar, fewer response options place a lower cognitive demand onstudents when completing surveys. Researchers should therefore use theory, along with the statisticalmethods detailed herein, to guide the development of their measure and their selection of responseoptions.REFERENCESBloom, M., Fischer, J., & Orme, J. G. (2003). Evaluating practice: Guidelines for the accountable professional (4thed.). Boston, MA: Allyn & Bacon.Borgers, N., Hox, J., & Sikkel, D. (2004). Response effects in surveys on children and adolescents: The effect ofnumber of response options, negative wording, and neutral mid-point. Quality and Quantity, 38(1), 17–33. Brown, T. A. (2015). Confirmatory factor analysis for applied research (2nd ed.). New York, NY: Guilford.Chang, L. (1994). A psychometric evaluation of 4-point and 6-point Likert-type scales in relation to reliability andvalidity. Applied Psychological Measurement, 18(3), 2Clark, L. A., & Watson, D. (1995). Constructing validity: Basic issues in objective scale development. PsychologicalAssessment, 7(3), 309–319. https://doi.org/10.1037/1040-3590.7.3.309Bloom, M., Fischer, J., & Orme, J. G. (2003). Evaluating practice: Guidelines for the accountable professional (4thed.). Boston, MA: Allyn & Bacon.Borgers, N., Hox, J., & Sikkel, D. (2004). Response effects in surveys on children and adolescents: The effect ofnumber of response options, negative wording, and neutral mid-point. Quality and Quantity, 38(1), 17–33. Brown, T. A. (2015). Confirmatory factor analysis for applied research (2nd ed.). New York: NY: Guilford.Clark, L. A., & Watson, D. (1995). Constructing validity: Basic issues in objective scale development. PsychologicalAssessment, 7(3), 309–319. https://doi.org/10.1037/1040-3590.7.3.309Dowdy, E., Furlong, M. J., Nylund-Gibson, K., Moore, S., & Moffa, K. (2018). Initial validation of the SocialEmotional Distress Survey – Secondary to support complete mental health screening. Assessment forEffective Intervention, Intervention, 43, 241–248. t-covitality.infoUC Santa Barbara Project Covitality
8Gordon Wolf et al.: Likert-Type Response OptionsFurlong, M. J., You, S., Renshaw, T. L., Smith, D. C., & O’Malley, M. D. (2014). Preliminary development andvalidation of the Social and Emotional Health Survey for secondary students. Social Indicators Research,117, 1011–1032. 3-0373-0Krosnick, J. a., & Presser, S. (2010). Question and questionnaire design. In P. V. Marsden & J. D. Wright (Eds.),Handbook of survey research (2nd ed., pp. 263–313). West Yorkshire, England: Emerald 0115.xLee, J., & Paek, I. (2014). In search of the optimal number of response categories in a rating scale. Journal ofPsychoeducational Assessment, 32(7), 663–673. https://doi.org/10.1177/0734282914522200Lee, S. yeon, You, S., & Furlong, M. J. (2016). Validation of the Social Emotional Health Survey–Secondary forKorean students. Child Indicators Research, 9(1), 73–92. https://doi.org/10.1007/s12187-014-9294-yLei Chang. (1994). A Psychometric Evaluation of 4-Point and 6-point Likert-type scales in relation to reliability andvalidity. Applied Psychological Measurement, 18(3), 02Leung, S.-O. (2011). A comparison of psychometric properties and normality in 4-, 5-, 6-, and 11-Point LikertScales. Journal of Social Service Research, 37(4), 0697Lietz, P. (2010). Research into questionnaire design: A summary of the literature. International Journal of MarketResearch, 52(2), 249. https://doi.org/10.2501/S147078530920120XLikert, R. (1932). A technique for the measurement of attitudes. Archives of Psychology, 140, 1–55.Mcneish, D. (2017). Thanks coefficient alpha, we’ll take it from here. Psychological a, M., Brosseau-Liard, P., & Savalei, V. (2012). When can categorical variables be treated as continuous? Acomparison of robust continuous and categorical SEM estimation methods under suboptimal conditions.Psychological Methods, 17(354–373), 354–373.Rodgers, W. L., Andrews, F. M., & Herzog, A. R. (1992). Quality of survey measures: A structural equation modelingapproach. Journal of Official Statistics, 8(3), 251–275.Streiner, D. L. (2003). Starting at the beginning: An introduction to coefficient alpha and internal consistency.Journal of Personality Assessment, 80(1), 99–103. https://doi.org/10.1207/S15327752JPA8001Trochim, W. M., & Donnelly, J. P. (2006). The research methods knowledge base (3rd ed.). Cincinnati, OH: AtomicDog.You, S., Furlong, M. J., Felix, E., & O’Malley, M. (2015). Validation of the social and emotional health survey for fivesociocultural groups: Multigroup invariance and latent mean analyses. Psychology in the Schools, 52(4),349–362. https://doi.org/10.1002/pits.21828You, S., Furlong, M. J., Dowdy, E., Renshaw, T. L., Smith, D. C., & O’Malley, M. D. (2013). Further Validation of theSocial and Emotional Health Survey for High School Students. Applied Research in Quality of Life, 9(4),997–1015. ct-covitality.infoUC Santa Barbara Project Covitality
9Gordon Wolf et al.: Likert-Type Response OptionsAPPENDIXTable 2. Factor loadings for the higher order factor model estimated using MLR estimation.Table 3. Factor loadings for the higher order factor model estimated using unweighted least squaresestimation.Figure 1. The higher-order factor structure of the SEHS-S.Figure 2. Predictive validity of the 4-point and 6-point models estimated using ULS estimation.www.project-covitality.infoUC Santa Barbara Project Covitality
10Gordon Wolf et al.: Likert-Type Response OptionsTable 2. Factor loadings for the higher-order factor model estimated using MLR estimation.ItemBS: Self-Efficacy 1BS: Self-Efficacy 2BS: Self-Efficacy 2BS: Self-Awareness 1BS: Self-Awareness 2BS: Self-Awareness 3BS: Persistence 1BS: Persistence 2BS: Persistence 3BO: School Support 1BO: School Support 2BO: School Support 3BO: Family Coherence 1BO: Family Coherence 2BO: Family Coherence 3BO: Peer Support 1BO: Peer Support 2BO: Peer Support 3BS: Self-EfficacyBS: Self-AwarenessBS: PersistenceBO: School SupportBO: Family CoherenceBO: Peer SupportHigher order factor loadingsBelief inSelf (BS)4-pointBeliefin 06.615.713.708.590.578.659.614.550Belief 5.911.919.968.786.900.984.6924-point6-pointBelief in Self.914.987Belief in Others.970.960Emotional Competence.759.640Engaged Living.862.952.724.669.509Belief 8.853.629.635.464EC: Emotional Regulation 1EC: Emotional Regulation 2EC: Emotional Regulation 3EC: Empathy 1EC: Empathy 2EC: Empathy 3EC: Self Control 1EC: Self Control 2EC: Self Control 3EL: Optimism 1EL: Optimism 2EL: Optimism 3EL: Zest 1EL: Zest 2EL: Zest 3EL: Gratitude 1EL: Gratitude 2EL: Gratitude 3EC: Emotional RegulationEC: EmpathyEC: Self ControlEL: OptimismEL: ZestEL: 2.740.758Note. Bolded values reflect the higher factor loading between the two response options. *This item was mistakenly not administered during the iteration of the survey that utilizeda 4-point response option. Six of the 36 items on the 4-point response option were administered with a 5-point response option. These items represent the factors known as Zestand Gratitude. The response options for the 5-point scale were Not at all, Very little, Somewhat, Quite a lot, and Extremely.www.project-covitality.infoUC Santa Barbara Project Covitality
11Gordon Wolf et al.: Likert-Type Response OptionsTable 3. Factor loadings for the higher-order factor model estimated using unweighted least squares estimation.ItemBS: Self-Efficacy 1BS: Self-Efficacy 2BS: Self-Efficacy 2BS: Self-Awareness 1BS: Self-Awareness 2BS: Self-Awareness 3BS: Persistence 1BS: Persistence 2BS: Persistence 3BO: School Support 1BO: School Support 2BO: School Support 3BO: Family Coherence 1BO: Family Coherence 2BO: Family Coherence 3BO: Peer Support 1BO: Peer Support 2BO: Peer Support 3BS: Self-EfficacyBS: Self-AwarenessBS: PersistenceBO: School SupportBO: Family CoherenceBO: Peer SupportHigher order factor loadingsBelief inSelf4-pointBelief EL.858.939Belief 9.749.700.579Belief 4.661.625.500EC: Emotional Regulation 1EC: Emotional Regulation 2EC: Emotional Regulation 3EC: Empathy 1EC: Empathy 2EC: Empathy 3EC: Self Control 1EC: Self Control 2EC: Self Control 3EL: Optimism 1EL: Optimism 2EL: Optimism 3EL: Zest 1EL: Zest 2EL: Zest 3EL: Gratitude 1EL: Gratitude 2EL: Gratitude 3EC: Emotional RegulationEC: EmpathyEC: Self ControlEL: OptimismEL: ZestEL: 833.878.847.844.831.915.685.748.900.726.810Note. Bolded values reflect the higher factor loading between the two response options. *This item was mistakenly not administered during the iteration of the survey that utilizeda 4-point response option. Six of the 36 items on the 4-point response option were administered with a 5-point response option. These items represent the factors known as Zestand Gratitude. The response options for the 5-point scale were Not at all, Very little, Somewhat, Quite a lot, and Extremely.www.project-covitality.infoUC Santa Barbara Project Covitality
12Gordon Wolf et al.: Likert-Type Response OptionsFigure 2. The higher-order factor structure of the SEHS-S.Figure 2. Predictive validity of the 4-point and 6-point models estimated using ULS estimation.www.project-covitality.infoUC Santa Barbara Project Covitalit
Gevirtz Graduate School of Education International Center for School Based Youth Development January 2019 An Analytic Approach for Deciding Between 4- and 6-point Likert-Type Response Options Melissa Gordon Wolf Karen Nylund-Gibson Erin Dowdy Michael Furlong The research reported in this paper was supported in part by the Institute of Education .