Transcription
THE AFRICAN DATACENTER RISESHOW THE RACE TO THECLOUD IS TRANSFORMINGAFRICAN COLOCATIONMARKETSREPORT SUMMARY,TABLE OF CONTENTS& SAMPLE PAGESJUNE 2017
Report Summary: The African Data Center is Still Rising The African Multi-Tenant Data Center (MTDC) market has entered a newphase of growth, one that should see deeper adoption in core markets,and a broader, more distributed data center service penetration beyondthe core. The harbingers of this impending data center market growth have beenbuilding up for years. African broadband is booming; the number ofconnections has passed the 200 million mark and should grow by anaverage of nearly 20% over the next five years. Fiber connectivity prices aredeclining, workload migration to the cloud is accelerating, data privacy andsovereignty concerns are gaining ground, and a new breed of consumerand enterprise digital natives are putting new demands on African Internetnetworks. These and other factors are driving the race to bring the brains of theAfrican Internet back to the continent, in the process transforming theAfrican data center colocation business into one of the hottest growthsegments in the African ICT market. This transformation is at the heart ofthis report, the second edition of our “Africa Data Center Rises” series. Xalam Analytics LLC - 2017 Leveraging months of research, dozens of interviews, extensive datacollections and new analytical tools for data center analysis and geomapping, the “African Data Center Rises – How the Race to the Cloud isTransforming African Colocation Markets” report provides anunprecedented view into the dynamics underpinning the African MTDCcolocation market. The report explores key questions surrounding the African MTDCcolocation market from the mundane, yet critical (how many colo datacenters are there exactly in Africa, how big is the market, who are the keyplayers), to the more incisive, if complicated (Can African colo playerssurvive on colo only, should African telcos sell their data center assets, howmuch is Teraco worth, which markets are the most attractive, etc.) A reference report for all players and investors in the African colocationand cloud markets.2
Sample Key Points Explored in this ReportThe insights derived from our research on African data center colocation markets are distilled in this report, covering critical key questions and points, including: Why we say that the African colocation market is really, primarily, about 7 core markets – and what those countries are;Why we say that almost half of African MTDC facilities are really built to do other things – and why that is;Why we say that less than 10% of African MTDC facilities are “True” Carrier and Vendor-Neutral MTDCs – and what the implications are;Why we say that outside of the South African market, Africa has low levels or “realized demand”;Why we say that power supply remains a challenge for African colo players; but argue that connectivity is the bigger problem;Why we say that MTDC colocation is one of the hottest growth segments in the African ICT market;Why we say African colo markets are small and complicated – but carry substantial upside for those who will dare take them on;Why we say that power supply challenges do distort African data center economics – and hamper the long-term margin upside of this business;Why we say that African colocation isn’t a case of build it and they will come. You may build it, but absent other critical conditions, it will stay empty;Why we say that African telcos should consider selling their data center assets – though doing so will have no material impact on their balance sheets;Why we say, about South Africa’s Teraco – “Show them the Money”;Why international colo operators are not here yet – and why they are coming;And more.The Corporate/Premium version of this report includes more than 50 supporting charts and data points in Excel format (See Report Specs). Xalam Analytics LLC - 20173
Report Structure Overview1. HOW MANY MTDCs ARETHERE IN AFRICA?2. WHAT IS THE SIZE OF THEAFRICAN COLOCATIONMARKET?5. THE COMPETITIVESTRUCTURE OF THEAFRICAN MTDCCOLOCATION MARKET: OF“TRUE” CARRIER-NEUTRAL,TELCO DCs, AND IT PLAYERS Xalam Analytics LLC - 20173. WHAT IS THE DEMANDPOTENTIAL FOR AFRICANMTDC COLOCATION?6. PART II – BEHIND THENUMBERS: ANSWERING KEYQUESTIONS4. WHAT IS THE REVENUESIZE & OUTLOOK FORAFRICAN MTDCCOLOCATION?7. PART III – COUNTRYFOCUS ANALYSIS4
Markets & Companies CoveredThis report focuses on Africa at a broad level, with countries covered at varying levels of depth. Countries and players covered are as follows: The core analysis of the report is driven by insights and data generatedMarkets Coveredwith Good Depth primarily from these markets; We provide a country-focused analysis of colo market size, key players,estimated market share, revenue outlook Specific country-focused profile, key trends, projections and other analysis: The core analysis of the report is driven by insights and data generatedOther MarketsCoveredCompaniesMentioned Xalam Analytics LLC - 2017primarily from these markets; At a minimum, some top line numbers and projections are provided inspecific colo size tables; Key trends and dynamics are explored and highlighted throughout thereport - but no specific country profiling Amazon Web ServicesBCXCenturyLinkDataxionDigital RealtyEast Africa Data CenterEO Data CenterEquinixEtix Everywhere GPXHetzner SAHostowebIBMiColoInternet SolutionsInterxionLiquid Telecom MainOne/MDXiMaroc Data CenterMicrosoftMTN BusinessN OneOoredoo TunisiaOrange GroupRack AfricaRackCentreGhanaEgyptIvory CoastCameroonMauritiusAngola South AfricaKenyaNigeriaMoroccoTunisia TanzaniaZambiaMozambiqueSenegalRaya Data CenterSafaricomTelecom EgyptTelkom SATeracoT-Systems SAVerizonVodacom BusinessWindstream5
Table of ContentsEXECUTIVE SUMMARY: THE AFRICAN DATA CENTER IS STILL RISINGTHE COMPETITIVE STRUCTURE OF THE AFRICAN MTDC COLOCATION MARKET: OF “TRUE” CARRIERNEUTRAL, TELCO DCs, AND IT PLAYERSPART I – THE NUMBERSWho Controls Africa’s Colo Space? A Macro ViewNot Alike: Colo Market Competitive Structure in South, North AfricaNot Alike: Colo Market Competitive Structure in the KiNG Markets, Rest of Africa“True” Carrier-Neutral vs. “Not Really” Carrier-NeutralThe Rise of the “True” Carrier Neutral ColoAfrica’s Top 25 Largest Colocation Data CentersFrom Teraco to Emtel: Africa’s Top 20 Colocation PlayersHOW MANY MTDCs ARE THERE IN AFRICA?MTDCs in Africa: 150 and RisingSeparating “Real” Multi-Tenant Data Centers from the Other SortWhere they Are: Africa MTDC MapHow they Break Down: Africa MTDCs by Size and TypeHow they Break Down: Pure-Play Colo Facilities vs. Multi-Purpose FacilitiesHow they Break Down: (Almost) Everybody Is Tier III – Or are They?WHAT IS THE SIZE OF THE AFRICAN COLOCATION MARKET?The African Colo Market: 80k Square Meters of Available White SpaceThe African Colo Market: Power and Rack CapacityThe African Colocation Market: A Map ReviewSouth Africa, North Africa, the KiNG Markets and Everyone ElseAfrica’s Top Metro Colocation MarketsWHAT IS THE DEMAND POTENTIAL FOR AFRICAN MTDC COLOCATION?The African Colocation Demand Universe: Service Providers and Digital NativesThe African Colocation Demand Universe: Financials, SME, Enterprise andGovernmentAfrica’s Colo Demand Hotspots – A Segment ViewAfrica’s Potential Colo Demand: 200k Square Meters, and Probably MoreAssessing Realized Demand: Between Upside and SkepticismPART II – BEHIND THE NUMBERS: ANSWERING KEY QUESTIONSWhich African colo markets are most attractive?Should African Telcos Sell Their Data Center Assets?Can the African Data Center Survive the Continent’s Power Supply Problems?Why Are the Global Colo Players Not Here Yet? Will They Ever Come?Africa MTDC M&A Targets: There’s Teraco, Then There’s Everybody ElseFrom Teraco to MDXi and Dataxion: Identifying Africa’s Most Attractive Data Center M&A AssetsTeraco: Show Them the MoneyTeraco: A Growth Story in Key ChartsCan Government Data Centers Change the African Supply Picture?WHAT IS THE REVENUE SIZE & OUTLOOK FOR AFRICAN MTDC COLOCATION?Data Center Colocation – One of the Hottest Segments in the African ICT MarketMarket Outlook: The Rise of the Cloud Makes Us Bullish on African ColoThe African Colo Market Will Double in SizeAfrican Colo Market Outlook: A Segment View Xalam Analytics LLC - 20176
Table of ContentsPART III – COUNTRY FOCUSNIGERIA: THE GIANT IS STILL SLEEPINGSOUTH AFRICA: THE PLACE OF (DATA CENTER) GOLDNigeria MTDC Colocation Market – Five-Point SummaryAfrica’s Third Largest Colocation MarketExcellent Broadband Growth PotentialA Deep – Still Underexploited – Colo Demand PotentialA Highly Underpenetrated DemandThe Supply-Side: Could Use More Carrier-Neutral OptionsNigeria MTDC Colocation – Key Player AssessmentStrong Growth Fundamentals, and a Connectivity ProblemRevenue Outlook – Promising, but Could do Substantially BetterSouth Africa MTDC Colocation Market – Five-Point SummarySouth Africa: Africa’s Colo BehemothGauteng: The Place of (Data Center) GoldCape Town: More than Nice ViewsSouth Africa – A Deep Demand for Cloud ServicesThe Supply-Side: An IT/Enterprise Provider MarketSouth Africa MTDC Colocation – Key Player AssessmentRevenue Outlook – South AfricaKENYA: READY FOR TAKE-OFFKenya MTDC Colocation Market – Five-Point SummaryEast Africa’s Internet GatewayStrong Fundamental Drivers of Colo DemandAn Increasingly Ripe Demand for Cloud ServicesColo Demand - Growing, but Still UnderpenetratedThe Supply-Side: No Tier 1 Telco Domination HereKenya MTDC Colocation – Key Player AssessmentExcellent Fundamentals – with a Minor Terrestrial Fiber ConcernRevenue Outlook – Bullish on Kenyan ColocationMOROCCO: PROMISING, BUT STILL CONSTRAINEDMorocco MTDC Colocation Market – Five-Point SummaryA Slow Awakening to ColocationStrong Fundamental DriversMorocco – Cloud Services Demand is Still ConstrainedThe Supply-Side: Highly FragmentedMorocco MTDC Colocation Market SupplyMorocco MTDC Colocation – Key Player AssessmentMorocco MTDC Colocation – Pricing & Service PortfolioRevenue Outlook – Strong, but Can be BetterTUNISIA: AFRICA’S BEST HIDDEN COLO SECRETTunisia MTDC Colocation Market – Five-Point SummaryNorth Africa’s Fastest Growing MarketAn Excellent Broadband Growth PotentialTunisia – Demand for Cloud Services only EmergingThe Supply-Side: Carrier-Neutral DominationTunisia MTDC Colocation – Pricing & Service PortfolioRevenue Outlook – Market Size Projected to Triple Xalam Analytics LLC - 20177
List of Exhibits (1)PART I – THE NUMBERSBroadband is Here - Broadband Subscriber Base in Africa – 2015-2020The Fiber Capacity is Here: Africa Subsea Lit Capacity – 2015-2020The Cloud is Here – Cloud Data Center Workloads vs. Traditional DC Workloads in the Middle Eastand Africa (2015-2020)Number of Multi-Tenant Data Centers in Africa – Top Line View*Number of Multi-Tenant Data Centers in Africa – View by Market GroupingAfrican MTDCs - Based on Building Type, Specifications and CertificationsAfrican MTDCs - Based on the Primary Purpose/Function of the Facility***Where they Are: Africa MTDC Map*Distribution of African MTDCs by Size - (2017E)Distribution of African MTDCs by Primary Purpose - (2017E)*MTDC Facilities by Type of Operator – 2017 FMTDC Facilities Dedicated to Colocation - by Type of Operator – 2017 FMTDC Facilities by Tier – Based on Specifications ClaimsMTDC Facilities by Tier – Based on Actual Uptime Institute CertificationsAfrica Share of Global Population, GDP, Mobile Broadband and Colo SpaceEvolution of Africa MTDC Colocation White SpaceAfrica Colocation Space vs. Sample Major Colocation MarketsEvolution of Africa MTDC Colocation Capacity – Rack UnitsEvolution of Africa MTDC Colocation Capacity – Power SupplyAfrica’s Top 10 Colocation Markets (Countries)*Africa Colo Space by Core Market Grouping (2017 E)Africa’s Top 10 Colocation Metros / RegionsColocation Revenue as a Share of B2B ICT Wholesale Revenue – Sample Markets - 2016EAfrica MTDC Colocation Revenue Outlook – 2016 E – 2021 FMarket Contribution to African Colocation Revenue – 2016E vs. 2021FAfrica Colocation Revenue Growth by Customer Segment – 2016 E – 2021 FShare of Africa Colocation Revenue by Customer Segment – 2016 vs. 2021FShare of Africa MTDC Colocation White Space – 2017 F vs. 2021 FCarrier Neutral Data Center Share of Colocation White Space in Sample African MarketsAfrican Colocation Space by Type of Operator 2011E – 2017FAfrica’s Top 25 Largest Colocation Data CentersAfrica’s Top 20 Colocation Players – Based on Owned Colocation Space - 2017 EPART II – BEHIND THE NUMBERS: ANSWERING KEY QUESTIONSKey Metro Market Benchmarks: South Africa and North AfricaKey Metro Market Benchmarks: KiNG Markets and Other AfricaSample Telco Data Center TransactionsHow They Do It – Sample Energy Supply Sourcing StrategiesInternational MTDC Colocation Players – Global Data Center PresenceTeraco: Evolution of Colocation Space – 2012 - 2018Teraco: Evolution of Power Capacity – 2012 - 2018Teraco: Evolution of Customer Base – 2010 - 2016Teraco: Evolution of Cross-Connects – 2010 - 2016Where they Are: Government National Data Centers in Africa*Government NDC Share of Available Colocation Space – Sample MarketsEstimated Potential Demand in Key African Colocation MarketsDistribution of Potential Demand by Key SegmentAvailable Data Center Space Supply as % of Potential DemandUtilized Data Center Space as % of Potential DemandAvailable Data Center Space Supply as % of Potential DemandUtilized Data Center Space as % of Potential DemandRevenue Growth Over the Past 2 Years (2014-16) in Sample Markets – Colocation vs. B2BICT/WholesaleEvolution of Africa MTDC Colocation Revenue - 2011 E – 2016 EAfrica MTDC Colocation Space Forecast - 2016 E – 2021 F Xalam Analytics LLC - 20178
List of Exhibits (2)PART III – COUNTRY FOCUSSouth African Share of African Colocation – Sample Indicators (2017 E)Gauteng and the Others: SA Colocation Space by Key RegionCape Town in Context – Colocation Space Supply vs. Sample Markets (2017F)South Africa: Summary Demand OverviewSouth Africa: Summary Demand PenetrationSouth Africa Share of MTDC Colo Space by Key PlayerSouth Africa Share of MTDC Colo Space Supply by Type of ProviderShare of Utilized MTDC Colo Space by Type of ProviderSouth Africa: Demand vs. Supply GrowthSouth Africa: Colocation Revenue GrowthSouth Africa Colocation Market Revenue – USD millionKenya in Context – Colocation Space Supply vs. Sample Markets (2017F)*Mobile Broadband Growth in Kenya – 2015-2021Kenya: FTTH Penetration of HouseholdsKenya: Summary Demand OverviewKenya: Summary Demand PenetrationKenya: Share of MTDC Colo Space by Key PlayerKenya: Share of MTDC Colo Space Supply by Type of ProviderKenya: Demand vs. Supply GrowthKenya: Colocation Revenue GrowthKenya Colocation Market Revenue – USD millionMorocco in Context – Colocation Space Supply vs. Sample Markets (2017F)Morocco: Summary Demand OverviewMorocco: Summary Demand PenetrationMorocco: Share of MTDC Colo Space by Key PlayerMorocco: Share of MTDC Colo Space Supply by Type of ProviderMorocco: Demand vs. Supply GrowthMorocco: Colocation Revenue GrowthMorocco Colocation Market Revenue – USD millionTunisia in Context – Colocation Space Supply vs. Sample Markets (2017F)Tunisia: Summary Demand OverviewTunisia: Summary Demand PenetrationTunisia: Share of MTDC Colo Space by Key PlayerTunisia: Share of MTDC Colo Space Supply by Type of ProviderTunisia: Demand vs. Supply Growth*Tunisia: Colocation Revenue GrowthTunisia Colocation Market Revenue – USD millionNigeria in Context – Colocation Space Supply vs. Sample Markets (2017F)Mobile Broadband Growth in Nigeria – 2015-2021Nigeria: FTTH Penetration of HouseholdsNigeria: Summary Demand OverviewNigeria: Summary Demand PenetrationNigeria: Share of MTDC Colo Space by Key PlayerNigeria: Share of MTDC Colo Space Supply by Type of ProviderNigeria: Demand vs. Supply GrowthNigeria: Colocation Revenue GrowthNigeria Colocation Market Revenue – USD million Xalam Analytics LLC - 20179
SAMPLE PAGESThe following are sample pages forthis report, provided for indicativepurposes only, with edits, and in noparticular order. Xalam Analytics LLC - 201710
Our Views in 10 Questions – And Where to Find ThemHow Many Data Centers are thereexactly in Africa?How big is the African colocationmarket?What’s the demand potential?Between XXX and XXX, dependingon the count and definitions. Butonly XXX are “Real”, purposebuilt MTDC facilities, to Tier III orTier IV specifications; and ofthose, only XXX are “true” Carrierand Vendor-Neutral MTDCs. XXX Square meters of space, XXX MW of power capacity, XXXm in revenue. Growing at XXX% annually, projected todouble in size over the next fiveyears. XXXk square meters, XXXk withmore aggressive demandassumptions. Outside of SouthAfrica, less than XXX% of thispotential demand actually usescolocation services.See Pages 16-17P. 32-33See Pages 16-17But What about Africa’s deficientpower supply infrastructure?We say it’s a challenge – not anunsurmountable obstacle. Weeven say the cost of metroconnectivity is a bigger obstaclethan power supply availability.Still, the power challenge createsa distortion of the Africancolocation model and will make itdifficult to maximize long termmarginsP. 54 – 56. Xalam Analytics LLC - 2017Which African colo markets arethe most attractive?South Africa stands alone. On acolo space basis, it is larger thanthe next 20 African marketscombined.7 markets account for 90% ofcolocation revenue: XXX, XXX,XXX, XXX, XXX, XXX and XXX.Several other markets have gooddemand potential, butunattractive supply-sideconditions.Why are the global colo playersnot here yet?What are Africa’s best targets forcolo M&A?African colo markets arecomplicated, just haven’t beenbig enough, and the paths tomarket entry have been narrow.But things are changing, and theglobal colo players are likelycoming.There are a few, from XXX to XXX.Teraco is unquestionably the bestof the lot; acquiring it would beexpensive. But from the baselineevidence in this report, fewAfrican tech businesses would beas worth the money as this one.We do not believe so. But they’llhave some (limited) use.P. 57-59P.62-63P. 64-66P. 32-33, 49-50Which players control the Africancolocation market?IT/Cloud Enterprise-focusedplayers control XXX% of Africa’scolo space; carrier-neutralproviders manage XX% of thefacilities but control XXX% of thespace. XXX is Africa’s largest coloprovider and XXX is the onlytraditional telco in the Top 5.P. 40-47Should African telcos sell theirdata center assets?Can government data centersfundamentally change Africancolocation markets?While there is a good operationaland strategic rationale for selling,XXX, XXX,XXXP.51-5311
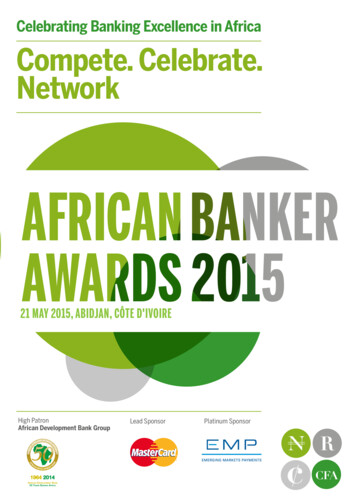
The African Colocation Market: A Map ReviewAfrica’s Top 10 Colocation Markets (Countries)*051015202530354045Square Meter ThousandsEstimates include data centers in construction and expected to launch in 2017Source: Xalam Analytics ResearchBubble size represents relative colo space sizeSource: Xalam Analytics Research Xalam Analytics LLC - 201712
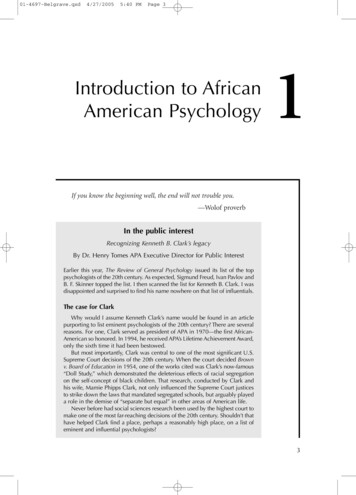
How they Break Down: Africa MTDCs by Size and TypeA Predominantly Small MTDC BaseDistribution of African MTDCs by Size - (2017E) On the whole, African data centers are small; the median size of an African MTDC isaround XXX square meters and about a fifth of the MTDCs are smaller than 100 squaremeters – in essence, more or less well-equipped server rooms. The sweet spot is nonetheless higher – the average MTDC size is close to XXX squaremeters, and around a third of all African MTDCs fall in the XXX-XXX square meter bracket; Some of the MTDCs are relatively sizeable: XXX African data centers have available whitespace above XXXX sqm, and XXX are larger than XXXX sqm. XXX of Africa’s XXX largest data centers (4 of the Top 5) are in South Africa; XXX of the topXXX are in Egypt, with XXX and XXXX slotting one each in the Top 15. XXXXX% of African MTDCs are built for a primary purpose other than commercialcolocation.40%35%30%25%20%15%10%5%0% 100 Sqm100 to 300 Sqm300 to 1000 Sqm1000 to 2500 Sqm 2500 Sqm*based on overall equipped, usable space; actual space dedicated to third-party colocation may be smaller.Distribution of African MTDCs by Primary Purpose - (2017E)*Types of Colocation Facilities in Africa*Data Center Core PurposePure-Play Colocation DCThe data center facility was built primarily to offer colocation services.Telco FacilityThe primary purpose of the facility is to house telecom company equipment; excessspace is then used to offer colocation services.IT Equipment HostingFacilityThe primary purpose of the facility is to house IT firm/other equipment; excess spaceis then used to offer colocation servicesGovernment FacilityThe primary purpose of the facility is to house servers from government and publicinstitutions; excess capacity is sold to the private sector on a commercial basis.Cable Landing StationThe primary purpose of the facility is to house submarine carrier equipment landingon the cost; some extra capacity available to other providers.GovernmentFacility5%IT HostingFacility22%Cable LandingStation3%Pure PlayColocation45%Telco Facility25%*Focus here is on the primary purpose of the facility, rather than the strategic focus or type of owner; Kenya’s East Africa Data Center, for example, is owned by a fiberco; but its primary commercial purpose is to offer third party colocationservices; it would fall under “pure play colocation” in this chart. Based on data as of May 2017. Sources: Xalam Analytics Research, the Companies13
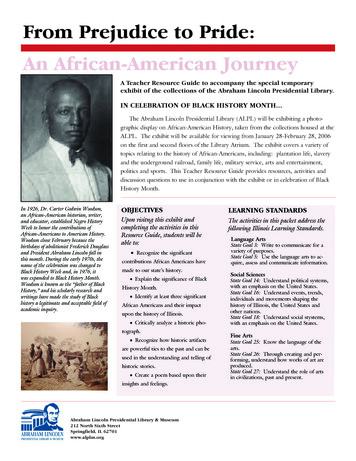
The African Colo MarketEvolution of Africa MTDC Colocation White SpaceAfrican Colocation – Growing Fast, but Still Small on a Global Scale We estimate African colocation white space supply at around XXXX Square meters in 2017 In relative terms, the African colocation market is small, a reflection of the small weight of thecontinent on global Internet traffic – and perhaps one of the most glaring signs of an Internetmarketplace still predominantly turned towards its external borders. The African market is around half the size of Amsterdam, and 3.5x smaller than London. These comparisons show that ultimately, Africa (with the notable exception of South Africa) is XXX% annual growth in available colocationspaceThousands Square Meters(including new space coming to market during the 2017 year). Overall available white space hasdoubled over the past five years and has been growing by an average of around XXX% annually .a different type of colocation market; colo facilities are smaller, market maturity levels are lowand in many markets, supporting infrastructure is suboptimal. On the flip side, low penetrationlevels mean that there is substantial upside for those who will dare take it on.2012 E2013 E2014 E2015 E2016 E2017 FSource: Xalam Analytics ResearchAfrica Colocation Space vs. Sample Major Colocation MarketsAfrican Colo Space: Half the Size ofAmsterdam & Frankfurt, 3x smaller thanLondonAfrica ShareThousands Square MetersAfrica Share of Global Population, GDP, Mobile Broadband and Colo Spaceof Global Populationof Global GDPof MBB Connectionsof Global ColocationSpaceSources: African data by Xalam Analytics Research; GDP and population data from the World Bank (2016); Global MobileBroadband Connections from Ericsson Mobility Report (2016); Global colocation numbers are Xalam Analytics estimatesAfricaAmsterdamFrankfurtLondonSources: Africa: Xalam Analytics Research; Amsterdam: Dutch Data Center Association;Frankfurt and London estimated based on CBRE European Market Review (2016)14
Who Controls Africa’s Colo Space? A Macro ViewWho Controls Africa’s Colo Space? A Broad Mapping by MTDC Player Type (2017 F)*Share of Africa MTDC Colocation White Space – 2017 F vs. 2021 FAlternative ISP6%Carrier NeutralColo23%IT/Cloud Provider40%FiberCo DC2%Government3%Alternative ISPCarrier Neutral ColoFiberCo DC2017 FIntegrated Telco24% The differences in competitive structure between African markets are stark, a function ofsubstantial variations in economic structure, maturity of connectivity and industry regulation.Such differences are directly reflected in the competitive structure of African colocationmarkets, from the strong presence of carrier-neutral players in South Africa and North Africato their quasi absence in most of the continent (see next page and Country Analysis). At a macro-level, IT and cloud providers have long been the largest owners of Africancolocation capacity; they are strong in South Africa, and until recently, were among the fewproviders of colocation services in many markets; today, they are seeing their turf challengedby ISPs and integrated telcos looking to build a presence in the enterprise and IT servicesspace.*Based on our definitions; for example, we put Internet Solutions in the IT/Cloud/Enterprise service provider group;others could put IS in the alternative ISP/Connectivity provider group. Xalam Analytics LLC - 2017GovernmentIntegrated TelcoIT/Cloud Provider2021 FMarket share estimates include data centers in construction and expected to launch in 2017Source: Xalam Analytics Research Integrated telcos are the second largest group, with about a quarter of Africa’s colocation space.Their overall colo space has been increasing in absolute terms, as more telcos build out data centerin a bid to develop a presence in the enterprise and IT services space. In relative terms, however,telcos have been losing share at a macro level, notably due to the fast rise of carrier-neutral options.But telcos are leaders in many individual markets, most notably in the “Other Africa” group wherestrong, alternative colocation offerings have yet to emerge. Carrier-neutral colocation players are the fastest-growing group. Led by Teraco, but also players suchas GPX (Egypt), Dataxion (Tunisia), N One (Morocco) or the upcoming iColo data center in Kenya, theyhave deployed XXXX% of all the white space rolled out in African markets over the past five years (seeseparate analysis). We are projecting the share of most groups to decline, with one exception – carrier neutral players,whom we expect to drive growth in the main African markets over the forecast period.15
From Teraco to Emtel: Africa’s Top 20 Colocation PlayersAfrica’s Top 20 Colocation Players – Based on Owned Colocation Space - 2017 EConnectivity Provider/ TelcoCarrier-Neutral Colo ProviderIT/SI/Cloud ProviderGovernment DCReport Only02468101214Thousands Square MetersSources: The Companies, Xalam Analytics Estimates Xalam Analytics LLC - 201716
Which African Markets are Most Attractive for Colocation Services?KiNG Markets & Other AfricaKiNGMetroMarketsSize/Depth of the B2B andCarrier MarketStrategic RegionalInternet Traffic HubDigital ServicesProvider Ecosystem(IT/Cloud Providers,OTTs, CDN, VideoStreaming, Startups,etc.)Reliability of thePower Grid &Alternative Sources ofPowerAvailability ofAffordable Metro &DLD Fiber CapacityAvailability ofAffordableInternational aMetroMarkets(Sample) XXXXXXXXXXXXXXExcellent Xalam Analytics LLC - 2017GoodAverageWeakTerrible17
Cape Town: More than Nice ViewsSquare Meters ThousandsCape Town in Context – Colocation Space Supply vs. Sample Markets(2017F)*Cape TownCountry 1Country 2Country 3Source: Xalam Analytics Estimates Cape Town accounts for around XXX% of SA’s colo supply capacity. Itis Africa’s third largest metro market (only behind Gauteng andGreater Cairo) in terms of available space supply. If it were a country, Cape Town would be Africa’s third largestmarket, slightly ahead of XXX in terms of available supply. Besides a strong tourism industry, and the secondary base for SouthAfrica’s corporate customers, the region is home to a largeecosystem of digital startups. Xalam Analytics LLC - 201718
Report Specs: 2 Budget OptionsStandard1-5 UsersUS 1,500PremiumCorporate LicenceUS 2,000Report Delivered in PDF FormatPackage delivered in PDF, Excel,Winzip or Box, including:Including:125 pages60 Charts & VisualsReport in PDF – 125 pages& 60 Charts & VisualsA 12 Slide Executive Synopsis50 Charts with underlying chartdata in Excel format Xalam Analytics LLC - 201719
Leveraging research and data analytics to helpinvestors identify opportunities in AME ytics.comXalam Analytics, LLCPart of the Light Reading ResearchNetworkUS Office: 1 Mifflin Place, HarvardSq.Suite 400Cambridge, MA 02138Londoninfo@xalamanalytics.com
African data center colocation business into one of the hottest growth segments in the African ICT market. This transformation is at the heart of . The Supply-Side: No Tier 1 Telco Domination Here. Kenya MTDC Colocation - Key Player Assessment. Excellent Fundamentals - with a Minor Terrestrial Fiber Concern.