Transcription
Demographic Research a free, expedited, online journalof peer-reviewed research and commentaryin the population sciences published by theMax Planck Institute for Demographic ResearchDoberaner Strasse 114 · D-18057 Rostock · GERMANYwww.demographic-research.orgDEMOGRAPHIC RESEARCHVOLUME 5, ARTICLE 4, PAGES 79-124PUBLISHED 13 NOVEMBER I: 10.4054/DemRes.2001.5.4Attrition in Longitudinal HouseholdSurvey DataHarold AldermanJere R. BehrmanHans-Peter KohlerJohn A. MaluccioSusan Cotts Watkins 2001 Max-Planck-Gesellschaft.
Table of Contents1Introduction802Some Theoretical Aspects of the Effects ofAttrition on EstimatesAttrition bias due to selection on observables andunobservablesTesting for attrition bias82Data and Extent of AttritionBolivian Pre-School Program EvaluationHousehold Survey Data. El Proyecto Integral deDesarrollo Infantil (PIDI)The Kenyan Ideational Change Survey (KDICP)KwaZulu-Natal Income Dynamics Study (KIDS)8889Some Attrition Tests for the Bolivian, Kenyan, andSouth African SamplesComparison of Means for Major Outcome andControl VariablesProbits for Probability of AttritionDo Those Lost to Follow-up have DifferentCoefficient Estimates than Those 6References120Appendix123
Demographic Research - Volume 5, Article 4Attrition in Longitudinal Household Survey Data:Some Tests for Three Developing-Country SamplesHarold Alderman 1, Jere R. Behrman 2, Hans-Peter Kohler 3, John A. Maluccio 4,and Susan Cotts Watkins 5AbstractLongitudinal household data can have considerable advantages over much more widelyused cross-sectional data for capturing dynamic demographic relationships. However, adisturbing feature of such data is that there is often substantial attrition and this may makethe interpretation of estimates problematic. Such attrition may be particularly severe wherethere is considerable migration between rural and urban areas. Many analysts share theintuition that attrition is likely to be selective on characteristics such as schooling and thusthat high attrition is likely to bias estimates. This paper considers the extent andimplications of attrition for three longitudinal household surveys from Bolivia, Kenya, andSouth Africa that report very high per-year attrition rates between survey rounds. Ourestimates indicate that: (a) the means for a number of critical outcome and familybackground variables differ significantly between those who are lost to follow-up and thosewho are re-interviewed; (b) a number of family background variables are significantpredictors of attrition; but (c) nevertheless, the coefficient estimates for standard familybackground variables in regressions and probit equations for a majority of the outcomevariables considered in all three data sets are not affected significantly by attrition.Therefore, attrition apparently is not a general problem for obtaining consistent estimates1Development Research Group, World Bank, 1818 H Street NW, Washington D.C. 20433, USA. Email:halderman@worldbank.org.2Population Studies Center, McNeil 160, 3718 Locust Walk, University of Pennsylvania, Philadelphia,PA 19104-6297, USA. Email: jbehrman@econ.sas.upenn.edu.3Max-Planck Institute for Demographic Research, Doberaner Str. 114, 18057 Rostock, Germany. Email:kohler@demogr.mpg.de.4International Food Policy Research Institute, 2033 K Street NW, Washington D.C. 20006, USA. Email:j.maluccio@cgiar.org.5University of Pennsylvania, McNeil 113, 3718 Locust Walk, Philadelphia, PA 19104-6299, USA.Email: arch.org79
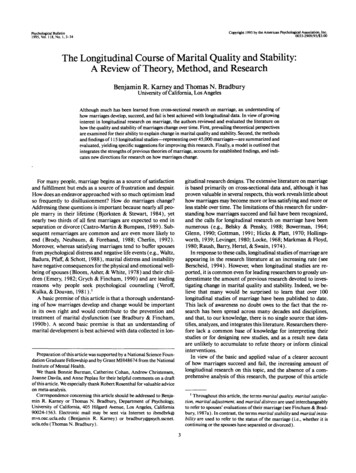
Demographic Research - Volume 5, Article 4of the coefficients of interest for most of these outcomes. These results, which are verysimilar to those for developed countries, suggest that multivariate estimates of behavioralrelations may not be biased due to attrition and thus support the collection of longitudinaldata.1. IntroductionLongitudinal (or panel) household data can have considerable advantages over more widelyavailable cross-sectional data for social science analysis. Longitudinal data permit (1)tracing the dynamics of behaviors, (2) identifying the influence of past behaviors on currentbehaviors, and (3) controlling for unobserved fixed characteristics in the investigation ofthe effect of time-varying exogenous variables on endogenous behaviors. These advantagesare substantial for demographers studying processes that occur over time including theimpact of programs on subsequent behavior that often use time-varying exogenousvariables. As a result, the advantages are also increasingly appreciated: for example, areview of articles published in the journal Demography indicates that only 26 articles usinglongitudinal data appeared between 1980-1989, while there were 65 between 1990-2000.Unfortunately, the collection of longitudinal data is likely to be difficult andexpensive, and some researchers, such as Ashenfelter, Deaton, and Solon (1986), havequestioned whether the gains are worth the costs. One problem in particular that hasconcerned analysts is that sample attrition may lead to selective samples and make theinterpretation of estimates problematic. Many analysts share the intuition that attrition islikely to be selective on characteristics such as schooling and thus that high attrition islikely to bias estimates made from longitudinal data. While there has been some work onthe effect of attrition on estimates using developed-country samples, little has been doneusing data from developing countries, where considerable migration between rural andurban areas typically exacerbates the problem of attrition. Table 1 summarizes the attritionrates in a number of longitudinal data sets from developing countries. While these varywidely (ranging from 6 to 50 percent between two survey rounds and 1.5 to 23.2 percentper year between survey rounds), often there is considerable attrition.In this paper, we consider some of the implications of attrition for three of the sevenlongitudinal household surveys from developing countries in Table 1 that report the highestper-year attrition rates between survey rounds: (1) a Bolivian household survey designedto evaluate an early childhood development intervention in poor urban areas, with surveyrounds in 1995/1996 and 1998; (2) a Kenyan rural household survey designed to investigatethe role of social networks in attitudes and behavior regarding reproductive health, withsurvey rounds in 1994/1995 and 1996/1997; and (3) a South African g
Demographic Research - Volume 5, Article 4Table 1:Attrition rates for longitudinal household survey data in developingcountries listed in order of attrition rates per yearCountry, time period/intervalbetween rounds (in rough orderof attrition rates per year)Attrition ratebetween rounds(percentage)Attrition rate peryear(percentage)Bolivia (urban), 1995/6 to 1998(two-year interval)3519.4Kenya (rural, South NyanzaProvince), 1994/5 to 1996/7(two-year interval)couplesmenwomen41332823.218.115.1Nigeria (five-year interval)5013.0SourcePresent study (alsosee Alderman andBehrman 1999)Present study (alsosee Behrman,Kohler, andWatkins 2001)Renne (1997)Present study (alsosee Maluccio2001)South Africa (KwaZulu-Natal)1993 to 1998. (five yearinterval)householdspreschool children16223.44.8India (rural) 1970/71 to 1981/2(11-year interval)333.6Malaysia (12-year interval)252.4Indonesia 1993 to 1997 (fouryear interval)61.5Foster andRosenzweig 1995Smith and Thomas1997Thomas,Frankenberg, andSmith 1999Note: The annual attrition rate is calculated as 1- (1-q)1/T, where q is the overall attrition rate and T is the number of years coveredby the panel.http://www.demographic-research.org81
Demographic Research - Volume 5, Article 4Province) rural and urban household survey designed for more general purposes, withsurvey rounds in 1993 and 1998. The different aims of the projects and the variety ofoutcome measures facilitate generalization, at least for survey areas such as these that arerelatively poor and experiencing considerable mobility.Drawing on recent studies on attrition in longitudinal surveys for developed countries,the next section summarizes theoretical aspects of the effects of attrition on estimates.Section 3 describes the three datasets used in this study and section 4 presents some testsfor the implications of attrition between the first and the second rounds of the three surveys.Section 5 summarizes our conclusions.2. Some Theoretical Aspects of the Effects of Attrition on EstimatesMost of the previous work on attrition in large longitudinal samples is for developedeconomies, for example, the studies published in a special issue of The Journal of HumanResources (Spring 1998) on Attrition in Longitudinal Surveys (for related statisticalliterature on missing values and survey non-response see for instance Little and Rubin 1987or Ahlo 1990). The striking result of the studies presented in the Journal of HumanResources (JHR) is that the biases in estimated socioeconomic relations due to attrition aresmall despite attrition rates as high as 50 percent and significant differences between thosere-interviewed and those lost to follow-up for many important characteristics. For example,Fitzgerald, Gottschalk and Moffitt (1998) summarize:By 1989 the Michigan Panel Study on Income Dynamics (PSID) had experiencedapproximately 50 percent sample loss from cumulative attrition from its initial 1968membership (p. 251)We find that while the PSID has been highly selective on many important variablesof interest, including those ordinarily regarded as outcome variables, attrition biasnevertheless remains quite small in magnitude. (most attrition is random). (p.252)Although a sample loss as high as [experienced] must necessarily reduce precisionof estimation, there is no necessary relationship between the size of the sample lossfrom attrition and the existence or magnitude of attrition bias. Even a large amountof attrition causes no bias if it is ‘random’ (p. 256)The other studies in this special issue of the JHR further confirm these findings for thePSID or reach similar conclusions for other important panel data such as the Survey of82http://www.demographic-research.org
Demographic Research - Volume 5, Article 4Income and Program Participation (SIPP), the National Longitudinal Surveys of LaborMarket Experience (NLS), and the Labor Supply Panel Survey in the Netherlands (Falarisand Peters 1998; Lillard and Panis1998; Van den Berg and Lindeboom 1998; Zabel 1998;Ziliak and Kniesner 1998).This absence of relevant distortions in parameter estimates due to attrition can beunderstood once the relation between the mechanisms leading to attrition and the empiricalmodel of interest is made explicit.2.1 Attrition bias due to selection on observables and unobservablesFitzgerald, Gottschalk, and Moffitt (1998) provide an econometric framework for theanalysis of attrition in which the common distinction between selection on variablesobserved in the data and variables that are unobserved is used to develop tests for attritionbias and correction factors to eliminate it. (Note 1) This framework assumes a panel studythat attempts to interview the same sample of respondents (or households, etc.) for say, Tannual survey rounds at times t 1, T. The initial sample at time t 1 is assumed to bea random or stratified random sample of the population. Attrition of a respondent at timet, denoted At, is then defined as the fact that the respondent participates in all survey waves1, , t-1, but does not participate in any survey wave from time t onwards (Note 2).Common causes for attrition are death or migration of the respondent, or refusal toparticipate due to saturation or frustration with a particular survey. The respondent thusreports information for the dependent and explanatory variables for the survey waves 1, ,t-1. Neither the dependent variable nor time-varying explanatory variables are observedfrom survey wave t onwards. (Note 3) Analyses of and adjustments for attrition at time tcan therefore be based on fixed characteristics of the respondent, lagged time-varyingvariables pertaining to periods prior to time t, and information that do not require thecompletion of an interview, such as interviewer characteristics and location of residence.The central concern in the analyses of attrition – and of missing data in general – isselection bias, that is, a distortion of the estimation results due to non-random patterns ofattrition. The common distinction is between attrition that is completely random, attritionthat is selective on variables unobserved in the data, and attrition that is selective onvariables observed in the data. The latter can be further distinguished between attrition thatleads to ignorable selection on observables (the statistical literature on missing data alsouses the terms “missing-at-random”) or non-ignorable selection on observables.While attrition does not necessarily introduce bias in the estimates of interest, whenit does, selective attrition on observables is more amenable to statistical solutions thanselective attrition on unobservables. In particular, the above taxonomy of attrition leads toa sequence of tests that we will follow in this study. First, given that there is samplehttp://www.demographic-research.org83
Demographic Research - Volume 5, Article 4attrition, one determines whether or not there is selection on observables. Second, if thereis selection on observables, one determines whether this attrition is ignorable – and thusdoes not bias the estimates of interest – or whether it is non-ignorable. In the latter case, theanalyses need to adjust for attrition since otherwise selection leads to biased inferencesabout relevant parameters. The available methods to correct for attrition on observables areoften relatively easy to implement and rely on relatively weak assumptions, in contrast tothe methods that are required in order to adjust for selection on unobservables. Whileselective attrition on unobservables potentially remains a problem even after the analysesaccount for selection on observables, using as much information as possible about selectionon observables in the panel helps to reduce the amount of residual, unexplained variationin the data due to attrition. Controlling for selection on observables thus will likely reducethe biases due to the selection on unobservables. (Note 4)More formally, consider the survey wave at time t and assume that what is of interestis a conditional population density f(yt xt) where yt is a scalar dependent variable and xt isan observed scalar independent variable (for illustration; in practice the extension treatingxt as a vector, which potentially includes lagged dependent variables, fixed characteristicsof the respondent, and lagged time-varying characteristics of the respondent, isstraightforward; see for instance Fitzgerald et al. 1998). In particular, we assume the linearparametric modelyt 0 1xt t,yt observed if At 0(1)where t is a mean-zero random variable, and At is an attrition indicator equal to 1 if anobservation is missing its value of yt because of attrition, and equal to zero if an observationis not missing its value of yt. For identification, we assume in this theoretical model that thevariable xt is observed for both attritors and non-attritors, as would be the case if it were atime-invariant or lagged variable, for example. The presence of attrition implies that Eq.(1) can only be estimated for respondents that are interviewed at time t, that is forobservations for which At 0 and yt is observed.The analysis of these observed data can therefore determine the density f(yt xt, At 0)that is conditional on xt and At 0. Additional information or restrictions are necessary inorder to infer the density of primary interest, f(yt xt), from the observed data. That is, weseek f(yt) conditional on xt but not on At 0.This additional information can come from the probability of attrition, Pr(At 0 yt, xt,zt), where zt is an auxiliary variable (or vector) that is assumed to be observable for all unitsbut is not included in xt. In particular, in the straightforward generalization to vectors, zt caninclude lagged values of the dependent variable (which are observed up to time t-1 forrespondents who are lost to follow-up at time t), as well as fixed characteristics of the84http://www.demographic-research.org
Demographic Research - Volume 5, Article 4respondent, lagged time-varying characteristics, and variables that do not require thecompletion of an interview, such as interviewer characteristics and location of residence.(The set of respondent characteristics that can potentially be included in zt is restricted tothose characteristics that are not already included among the variables in xt.)Linearizing the probability of attrition implies a process of the formAt* 0 1x t 2zt tAt 1 if At* 0 0 if At* 0,(2)(3)where At* is a latent index and attrition occurs if this index is equal or larger to zero and tis a mean-zero random influence on the attrition probability.Attrition can then be classified as follows (this classification differs slightly from thatproposed by Fitzgerald et al. 1998 and has a more direct relation to the statistical literatureon missing data; see also Kohler 2001):Attrition exhibits selection on unobservables if Pr(At 0 yt, xt, zt) 3U At 0 xt, zt), sothat the attrition function cannot be reduced from Pr(At 0 yt, xt, zt). In the specificparametric model in Eqs. (1 – 3), therefore, selection on unobservables occurs if vt is notindependent of t xt, where t xt is a shorthand notation for the error term t conditional onxt.Attrition exhibits selection on observables ifPr(At 0 yt, xt, zt) Pr(At 0 xt, zt),(4)that is, if, conditional on xt and zt, the attrition probability is independent of the dependentvariable yt and therefore of the unobserved factors entering the error term t in relation (1).On one hand, this selection on observables is ignorable if (a) yt and zt are independentconditional on xt and At 0, or (b) the attrition function in Eq. (4) can be further reduced toPr(At 0 xt, zt) Pr(At 0 xt), i.e., the probability of attrition is independent of the variablezt. Ignorable selection on observables implies that the linear regression of relation (1) onthe basis of the observed data on non-attritors leads to unbiased estimates of the coefficientsβ0 and β1. In this case, no specific methods are required to control or adjust for attrition.On the other hand, selection on observables is non-ignorable when neither condition(a) nor (b) holds. In this case, standard linear regression analysis of relation (1) does notyield unbiased estimates of the coefficients β0 and β1, and alternative estimation techniquesare required that are further discussed below. Stated in terms of the parametric model inEqs. (1 – 3), ignorable selection on observables occurs if vt is independent of t xt and (a’)zt is independent of t xt, or (b’) the attrition does not depend on zt (i.e., 2 in Eq. 2 is zero).http://www.demographic-research.org85
Demographic Research - Volume 5, Article 4Selection on observables in this parametric model is non-ignorable when neither condition(a’) nor (b’) holds.Attrition is completely at random if the attrition function Pr(At 0 yt, xt, zt) can bereduced to Pr(At 0) and attrition neither depends on the dependent variable yt nor theobserved variables xt and zt. In our specific model, attrition is completely at random if vt isindependent of t xt and 1 and 2 in Eq. (2) are zero.Ordering these attrition patterns in terms of their assumptions from more restrictiveto less restrictive yields: completely random attrition selective attrition on observables selective attrition on unobservables. Completely random attrition is unlikely in mostpanel studies, and if it exists, it does not result in biases of parameter estimates. Attritionthat is selective on observables and unobservables, on the other hand, is probably acommon phenomenon in most panel studies, and we will briefly discuss the statisticalapproaches to overcome the biases that are potentially caused by such attrition.Selection on unobservables is often presented as dependent on the estimation of theattrition index equation (2) (see for instance Maddala 1983 or Powell 1994 for discussionsof this approach). Identification, however, usually relies on nonlinearities in the indexequation or an exclusion restriction, i.e., the existence of a variable zt – often loosely termed“instrument” – that predicts attrition but is independent of t xt and not included in xt. It isdifficult to rationalize most such exclusion restrictions because, for example, personalcharacteristics that affect attrition might also directly affect the outcome variable, i.e., theyshould be in xt or are correlated with t xt. There may be some such identifying variables inthe form of variables that are external to individuals and not under their control, such ascharacteristics of the interviewer in the various rounds (Zabel 1998, Maluccio 2001).However, in the PSID and potentially also in other panel studies the interviewers areassigned on the basis of respondent characteristics, in which case this strategy is also notfeasible. In general, therefore, selection on unobservables presents an obstacle to accurateparameter estimation. Most promising, in our opinion, is therefore to test and – if necessaryadjust – for non-ignorable selection on observables by using as much information aspossible about selection in the panel. This reduces the amount of residual, unexplainedvariation due to attrition left over in the data and it lessens the scope for selection onunobservables for which few feasible statistical solutions exist.If there is non-ignorable selection on observables, the critical variable is zt, a variablethat affects attrition propensities and that is also related to the density of yt conditional onxt due to the fact that zt is not independent of t xt. In this sense, zt is “endogenous to yt.”Indeed, a lagged value of yt can play the role of zt if it is not in the structural relation beingestimated but is related to attrition.Fitzgerald et al. (1998) show formally that, under the selection on observablesrestriction in Eq. (4), the complete population density f(yt xt) can be computed from theconditional joint density of yt and zt, which we denote by g:86http://www.demographic-research.org
Demographic Research - Volume 5, Article 4f(yt xt) J yt, zt xt, At 0) w(zt, xt) dzt,(5)wherew(zt, xt) Pr(At 0 xt) / Pr(At 0 zt, xt)(6)are normalized weights (the proof of Eq. 5 is also given in the appendix of this paper).(Note 5) The numerator of Eq. (6) is the probability of remaining in the sample (i.e., nonattrition) conditional on xt, and the denominator is the probability of remaining in thesample conditional on zt and xt. The weights w(zt, xt) in Eq. (6) can be estimated from thedata when both xt and zt are observed. This is the case when – as we have assumed above– xt and zt contain either time-invariant or lagged time-varying characteristics of therespondent or variables that do not require a completed interview. (Note 6)The intuition for Eqs. (5 – 6) is in the spirit of weighting (panel) observations with theinverse of the probability that an observation is included (as in stratified samples, forinstance); in the above case pertaining to attrition, this probability is replaced by thefunction of attrition probabilities in Eq. (6). Because both the weights and the conditionaldensity g are identifiable and estimable from the data, the complete-population densityf(yt xt) is estimable as well as its moments such as the expected value Eyt 0 1xt impliedby Eq. (1). This result is particularly important since it implies that in the linear model inEq. (1) the parameters 0 and 1 can be estimated without bias, despite the presence ofselective attrition on observables, via a weighted least squares regression (WLS) that usesthe weights defined in Eq. (6).Inspection of Eqs. (5) and (6) also reveals the cases when selection on observables canbe ignored. In particular, if zt is not a determinant of attrition, the weights in Eq. (6) equalone and no attrition bias is present. If yt and zt are independent conditional on xt and At 0,the density g in Eq. (5) factors and it can again be shown that the unconditional densityf(yt xt) equals the conditional density and there is no attrition bias.2.2 Testing for attrition bias (Note 7)Testing for attrition bias due to selection on unobservables is possible in econometricmodels that include the estimation of the attrition index. The identification of such modelswith panel data, however, is problematic due to the frequent lack of instruments that allowidentification. As an alternative, Fitzgerald et al. (1998) suggest that indirect tests forselection on unobservables can be made by comparisons with data sets without (or withmuch less) attrition (e.g., the Current Population Survey for comparison with the PSID inhttp://www.demographic-research.org87
Demographic Research - Volume 5, Article 4the United States). Unfortunately, only very limited possibilities for such comparisons existfor most panels, and such comparisons are especially difficult in developing countries. Dueto this limited ability to detect selective attrition on unobservables with the datasetsexamined in this paper, we do not discuss this approach further nor do we perform thecorresponding tests.Testing for selection bias due to selective attrition on observables, on the other hand,is possible in most panel studies and we will focus on these approaches. The two sufficientconditions that render the selection on observables through attrition ignorable are either (1)zt does not affect At or (2) zt is independent of yt conditional on xt and At 0. Specificationtests can be based on either of these two conditions. One test is simply to determinewhether candidate variables for zt (for example, lagged values of y) significantly affect At.Another test is based on Becketti, Gould, Lillard, and Welch (1988). In the BGLW test, thevalue of y at the initial wave of the survey (y1) is regressed on respondent’s characteristicsat the initial wave (x1) and on A, which denotes the event that a respondent becomes anattritor at some time during the survey (i.e., At equals one for some t in 2, ,T). The test forattrition is based on the significance of A in that equation. This test is closely related to thetest based on regressing A on x1 and y1, which is a direct estimation of the attritionprobability in Eqs. (2 – 3) in the special case when the y1 is used to represent the auxiliaryvariable zt. In fact, the direct estimation of the attrition probability and the BGLW test aresimply inverses of one another (Fitzgerald et al. 1998). (Note 8)Clearly, if there is no evidence of attrition bias from these specification tests, thissuggests that the attrition on observables is ignorable. (Since the null-hypothesis of ourattrition tests is the absence of attrition, the fact that there is not significant evidence ofattrition bias from these specification tests is no proof that such bias does not exist. It does,however, show that the possible bias is too small to be detectable given the power of theavailable tests. This limitation is a general problem of statistical inference and not restrictedto the specification tests for attrition).If the specification tests suggest that attrition on observables is ignorable, then thedesired information on f(yt xt) can be directly inferred from the conditional density f(yt xt,At 0) (under the assumption that there is no selective attrition on unobservables). If theabove tests detect non-ignorable selection on observables due to attrition, the resultingbiases in the inference of 0 and 1 in Eq. (1) can be avoided by using a weighted leastsquares methodology with the weights given in Eq. (6).3. Data and Extent of AttritionIn this section, we describe the three data sets that we use, emphasizing the diverse relationsof interest they can address.88http://www.demographic-research.org
Demographic Research - Volume 5, Article 43.1 Bolivian Pre-School Program Evaluation Household Survey Data. El ProyectoIntegral de Desarrollo Infantil (PIDI)PIDI is a targeted urban early child development project expected to improve thenutritional status and cognitive development of children who participate and to facilitatethe labor force participation of their caregivers. PIDI delivers child services throughchildcare centers located in the homes of local women who have been trained in childcare.The program provides food accounting for 70 percent of the children’s nutritional needs,health and nutrition monitoring, and programs to stimulate the children’s social andintellectual development. The PIDI program was designed to facilitate ongoing impactevaluation through the collection of longitudinal data.Eligibility for PIDI at the time of the collection of the first and second rounds of datawas based on an assessment of social risk. As a result of this selection, children who attenda PIDI center are, on average, from poorer family backgrounds than children who live inthe same communities but who do not attend a PIDI center (Behrman, Cheng and Todd2001). The first PIDI evaluation data set (Bolivia 1) was collected between November 1995and May 1996 and consisted of 2,047 households. (Note 9) The follow-up survey (Bolivia2) was collected in the first half of 1998 and consisted of interviews in the 65 percent of theoriginal 2,047 households that could be located (plus an additional 3,453 households thatwere not visited in Bolivia 1). The attrition rate of 35 percent for Bolivia 1 is relativelyhigh, which rai
2.1 Attrition bias due to selection on observables and unobservables Fitzgerald, Gottschalk, and Moffitt (1998) provide an econometric framework for the analysis of attrition in which the common distinction between selection on variables observed in the data and variables that are unobserved is used to develop tests for attrition