Transcription
Journal of Database Management, 18(1), 43-67, January-March 2007 43Semantic Integration and KnowledgeDiscovery for Environmental ResearchZhiyuan Chen, University of Maryland, Baltimore County (UMBC), USAAryya Gangopadhyay, University of Maryland, Baltimore County (UMBC), USAGeorge Karabatis, University of Maryland, Baltimore County (UMBC), USAMichael McGuire, University of Maryland, Baltimore County (UMBC), USAClaire Welty, University of Maryland, Baltimore County (UMBC), USAAbstractEnvironmental research and knowledge discovery both require extensive use of data stored invarious sources and created in different ways for diverse purposes. We describe a new metadataapproach to elicit semantic information from environmental data and implement semanticsbased techniques to assist users in integrating, navigating, and mining multiple environmentaldata sources. Our system contains specifications of various environmental data sources andthe relationships that are formed among them. User requests are augmented with semanticallyrelated data sources and automatically presented as a visual semantic network. In addition, wepresent a methodology for data navigation and pattern discovery using multi-resolution browsing and data mining. The data semantics are captured and utilized in terms of their patternsand trends at multiple levels of resolution. We present the efficacy of our methodology throughexperimental results.Keywords:environmental research, knowledge discovery and navigation, semantic integration, semantic networks, waveletsIntroductionThe urban environment is formedby complex interactions between naturaland human systems. Studying the urbanenvironment requires the collection andanalysis of very large datasets that spanmany disciplines, have semantic (includingspatial and temporal) differences and interdependencies, are collected and managedby multiple organizations, and are storedin varying formats. Scientific knowledgediscovery is often hindered because ofchallenges in the integration and navigation of these disparate data. Furthermore,Copyright 2007, Idea Group Inc. Copying or distributing in print or electronic forms without written permission of Idea Group Inc.is prohibited.
44 Journal of Database Management, 18(1), 43-67, January-March 2007as the number of dimensions in the dataincreases, novel approaches for patterndiscovery are needed.Environmental data are collected in avariety of units (metric or SI), time increments (minutes, hours, or even days), mapprojections (e.g., UTM or State Plane) andspatial densities. The data are stored innumerous formats, multiple locations, andare not centralized into a single repositoryfor easy access. To help users (mostly environmental researchers) identify data setsof interest, we use a metadata approach toextract semantically related data sourcesand present them to the researchers as asemantic network. Starting with an initialsearch (query) submitted by a researcher,we exploit stored relationships (metadata)among actual data sources to enhance thesearch result with additional semanticallyrelated information. Although domain experts need to manually construct the initialsemantic network, which may only includea small number of sources, we introducean algorithm to let the network expandand evolve automatically based on usagepatterns. Then, we present the semanticnetwork to the user as a visual display ofa hyperbolic tree; we claim that semanticnetworks provide an elegant and compacttechnique to visualize considerable amountsof semantically relevant data sources in asimple yet powerful manner.Once users have finalized a set of environmental data sources, based on semanticnetworks, they can access the actual sourcesto extract data and perform techniques forknowledge discovery. We introduce a newapproach to integrate urban environmentaldata and provide scientists with semantictechniques to navigate and discover patternsin very large environmental datasets.Our system provides access to a multitude of heterogeneous and autonomousdata repositories and assists the user tonavigate through the abundance of diversedata sources as if they were a single homogeneous source. More specifically, ourcontributions are:1.2.Recommendation of Additional andRelevant Data Sources: We presentour approach to recommend datasources that are potentially relevantto the user’s search interests. Currently, it is tedious and impractical forusers to locate relevant informationsources by themselves. We providea methodology that addresses thisproblem and automatically suppliesusers with additional and potentiallyrelevant data sources that they mightnot be aware of. In order to discoverthese additional recommendations,we exploit semantic relationshipsbetween data sources. We define semantic networks for interrelated datasources and present an algorithm toautomatically refine, augment, andexpand an initial and relatively smallsemantic network with additional andrelevant data sources; we also exploituser profiles to tailor resulting datasources to specific user preferences.Visualization and Navigation of Relevant Data Sources: The semanticnetwork with the additional sourcesis shown to the user as a visual hyperbolic tree improving usability byshowing the semantic relationshipsamong relevant data sources in a visual way. After the user has decidedon the choice of relevant data sourcesof interest (based on our metadata approach) and has accessed the actualdata, we also assist the user in navigating through the plethora of environmental data using visualization andCopyright 2007, Idea Group Inc. Copying or distributing in print or electronic forms without written permission of Idea Group Inc.is prohibited.
Journal of Database Management, 18(1), 43-67, January-March 2007 453.navigation techniques that describedata at multiple levels of resolution,enabling pattern and knowledgediscovery at different semantic levels. We achieve that, using wavelettransformation techniques, and wedemonstrate resilience of wavelettransformation to noisy data.Implementation of a PrototypeSystem: Finally, we have designedand implemented a prototype systemas a proof of concept for our techniques. Using this system we havedemonstrated the feasibility of ourcontributions and have conducteda set of experiments verifying andvalidating our approach.This article is organized as follows.First, we present related work on data integration using semantics, and on explorationof multi-dimensional data. Next, we presentour research methodology on semantic networks and pattern discovery with wavelettransformations. Then, we describe ourprototype implementation and the experiments we conducted. Our conclusions arepresented in the final section.Related WorkData IntegrationThere is a rich body of existingwork on data integration problems. Thefundamental problem is to enable interoperation across different heterogeneoussources of information. In general, thisproblem manifests itself either as schemamismatches (schema integration) or dataincompatibilities (data integration) whileaccessing disparate data sources. Severalsurveys identifying problems and proposedapproaches on schema and data integrationhave been written over the years (Batini,Lenzerini, & Navathe, 1986; Ouksel &Sheth, 1999; Rahm & Bernstein, 2001).There has been a significant amount ofwork on data integration, especially onresolving discrepancies of different dataschemas using a global (mediated) schema(Friedman, Levy, & Millstein, 1999; Levy,Rajaraman, & Ordille, 1996; Miller et al.,2001; Papakonstantinou, Garcia-Molina,& Ullman, 1996; Rahm & Bernstein,2001; Ram, Park, & Hwang, 2002). Morerecently, there exists work on decentralizeddata sharing (Bowers, Lin, & Ludascher,2004; Doan, Domingos, & Halevy, 2003;Halevy, Ives, Suciu, & Tatarinov, 2003;Hyperion, Tatarinov, & Halevy, 2004) andon integrating data in web-based databases(Bowers et al., 2004; Chang, He, & Zhang,2005; Dispensa & Brulle, 2003). Clustering,classification and ontologies have also beenextensively used as a tool to solve semanticheterogeneity problems (Jain & Zhao, 2004;Kalfoglou & Schorlemmer, 2003; Ram& Park, 2004; Sheth et al., 2004; Sheth,Arpinar, & Kashyap, 2003; Sheth et al.,2002; Zhao & Ram, 2002, 2004).All the previously mentioned worktakes a deep integration approach, wherethe data schemas (or query interface forintegrating web databases) of all sources areintegrated. However, this approach is oftentoo restrictive for environmental researchbecause: (1) there are so many differenttypes of data collected by so many differentgroups that it is impractical for all of themto agree on a universal mediated schema; (2)unlike companies, environmental researchers often share data in an ad hoc way, e.g.,a company may purchase products fromseveral fixed suppliers while environmentalresearchers may use any dataset collectedby other researchers but related to theircurrent research task.Copyright 2007, Idea Group Inc. Copying or distributing in print or electronic forms without written permission of Idea Group Inc.is prohibited.
46 Journal of Database Management, 18(1), 43-67, January-March 2007There has been much effort by theecology research community to integrateits data (EML, ORS, SEEK). These systems take a shallow integration approachwhere only metadata is integrated; theyallow researchers to store metadata in acentralized database and to select datasetsby searching the metadata using keywordor SQL-based search. Such systems avoidthe problem of defining a global-mediateddata schema and allow researchers to sharedata in an ad hoc way. A semantics-basedintegration approach for geospatial datais presented in (Ram, Khatri, Zhang, &Zeng, 2001).The main problem of existing systemsfor integrating environmental data is thatthey provide limited support to assist usersin finding data sources semantically relatedto their research. Most existing systems assume researchers have full knowledge ofwhat keywords to search and provide noassistance in selecting data sources basedon relationships between them. However,unlike business applications, environmentalresearch is more explorative and researchers are interested in searching semanticallyrelated datasets. Although experiencedresearchers may find all related keywords,inexperienced researchers such as graduate students may have trouble doing this.The only exception is the SEEK project(Bowers et al., 2004; Bowers & Ludascher,2004), which uses an ontology for ecologyconcepts to find related datasets. However,SEEK assumes the ontology will be completely given by domain experts, whileour approach augments such knowledgeby incremental and automatic refinementof the semantic network.There has also been work on discovering semantic similarity in (Fankhauser,Kracker, & Neuhold, 1991) based ongeneralization/specialization, and posi-tive/negative association between classes;in our article, we do not restrict our work tothese types of classes only, instead, we letthe users identify the degree of relevancebetween data sources as their own semanticinterpretation. Although our approach givesmore emphasis on the user’s semantics, itmay require more manual work to calculatethe semantic relationships in the semanticnetwork, since it is user-based. To reducethe amount of manual work, we start with asmall manually created semantic network,and then we apply an algorithm that we designed and implemented, to automaticallyexpand, refine, and augment the semanticnetwork by taking advantage of observedusage patterns. Another difference with(Fankhauser et al., 1991) is the way thatthe degree of relevance is calculated.They use triangular norms (T-norms) fromfuzzy logic, while we use conditionalprobabilities. Relevant to our work is thetopic of discovering and ranking semanticrelationships for the Semantic Web (Aleman-Meza, Halaschek-Wiener, Arpinar,Ramakrishnan, & Sheth, 2005; Sheth etal., 2004). However, relationship rankingis not in the scope of this article.Using Wavelets for Exploration ofMultidimensional DataIn order to study long-term environmental factors, we need to evaluatemeasures across multiple dimensions suchas time and geographic space at differentdimensional hierarchies. An example of thetype of queries that have to be answeredis, “How do stream temperature and precipitation change over time and space?” Inorder to answer such queries, the systemmust integrate diverse sets of information,which is typically facilitated by dimensionalmodeling techniques (Kimball, 2002) andonline analytical processing (OLAP). TheCopyright 2007, Idea Group Inc. Copying or distributing in print or electronic forms without written permission of Idea Group Inc.is prohibited.
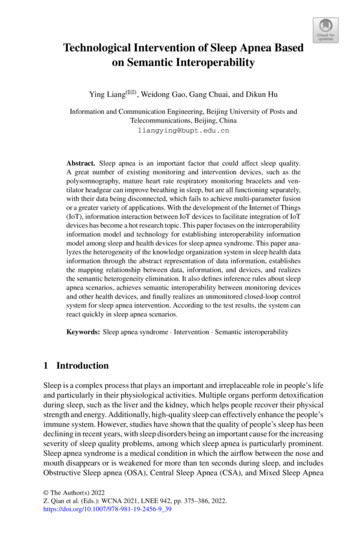
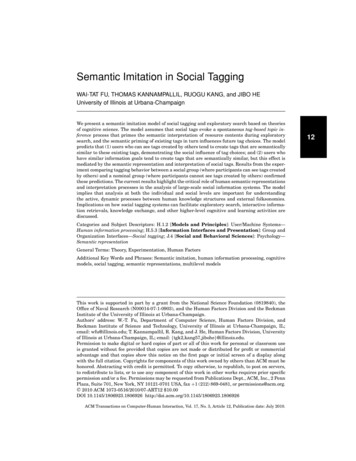
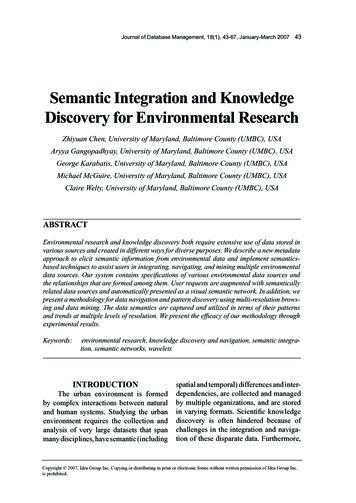
Journal of Database Management, 18(1), 43-67, January-March 2007 47challenge stems from the fact that suchdimensional models grow exponentiallyin size with the number of dimensions anddimensional hierarchies. Current OLAPtechniques, however, rely on the intuitionof the decision maker in navigating throughthis lattice of cuboids and only providenavigation tools such as drill down androll up. There have been very few attemptsmade to address this issue, most notablythe work done by (Sarawagi, Agrawal, &Megiddo, 1998) and (Kumar, Gangopadhyay, & Karabatis, in press). However,the major deficiency of the existing workin this area is that the volume of data aftera few drill-downs becomes prohibitivelylarge, which hinders the effectiveness of themethod. In order to help end users (scientistsor engineers) discover and analyze patternsfrom large datasets, we have developed amethodology for visualization of data atmultiple levels of dimensional hierarchyand pattern discovery through data miningtechniques (Han & Kamber, 2000; Mitchell,1997) at multiple levels of resolution.The last decade has seen an explosionof interest in wavelets (Daubechies, 1992;Goswami & Chan, 1999), a subject area thathas coalesced from roots in mathematics,physics, electrical engineering and otherdisciplines. Wavelets have been developedas a means to provide low-resolution viewsof data with the ability to reconstruct highresolution views if necessary. Wavelettransformation has been applied in numerous disciplines such as compression and denoising of audio signals and images, fingerprint compression, edge detection, objectdetection in two-dimensional images, andimage retrieval (Stollnitz, Derose, & Salesin, 1996). There have been few studies onapproximate query answering through lossycompression of multi-dimensional datacubes (Matias, Vitter, & Wang, 1998; Smith,Li, & Jhingran, 2004; Vitter & Wang, 1999;Vitter, Wang, & Iyer, 1998), data cleaning,and time-series data analysis (Percival &Walden, 2000). However, no study has beendone on utilizing wavelet transformation toprovide decision support. We use waveletsto provide coarse, low-resolution views toresearchers with the capability of retrieving high-resolution data by zooming intoselected areas.Generally speaking, wavelet transformation is a tool that divides up data,functions, or operators into different frequency components and then studies eachcomponent with a resolution matched to itsscale (Daubechies, 1992). A wavelet hasmany desirable properties such as compactsupport, vanishing moments and dilatingrelation and other preferred properties suchas smoothness (Chui & Lian, 1996). Thecore idea behind a discrete wavelet transformation (DWT) is to progressively smooththe data using an iterative procedure andkeep the detail along the way. The DWTis performed using the pyramid algorithm(Mallat, 1989) in O(N) time.Research Design andMethodsOverview of the ArchitectureThe overall architecture of our systemis shown in Figure 1. It consists of a dataintegration component, a data warehouse,and visualization, navigation, and patterndiscovery component, all for the semanticutilization of heterogeneous data sourcesdepicted on the left. The data integrationcomponent consists of a metadata repository, a semantic network, and a set of conversion functions. The metadata repositorystores information about the source dataincluding descriptions of each particularsource along with information on its syntaxCopyright 2007, Idea Group Inc. Copying or distributing in print or electronic forms without written permission of Idea Group Inc.is prohibited.
48 Journal of Database Management, 18(1), 43-67, January-March 2007Data Mining &PatternDiscoveryWaveletcoefficientsand semantics. In our approach the metadatalayer is not a global schema. Instead wecollect various information artifacts aboutthe sources to assist in finding relationshipsand correspondences among data in different sources. We also store information onhow to access the data (including locationidentifier, access method, access rights,username, etc.) and how to transform l ySourceDBData IntegrationDataWarehouseMulti-resolutionview of dataVisualization, Navigationand Pattern DiscoveryWeb ClientsFigure 1. System architecture with data integration and knowledge discovery componentsdata to the canonical form if needed throughconversion functions (on measurementunits, formats, etc.), as explained in thefollowing section.The semantic network contains relationships between sources. Users requestdata sources by searching the metadata repository and our system will automaticallyuse the semantic network to return not onlyCopyright 2007, Idea Group Inc. Copying or distributing in print or electronic forms without written permission of Idea Group Inc.is prohibited.
Journal of Database Management, 18(1), 43-67, January-March 2007 49the requested ones but also to recommendadditional and related data sources that users might not know about. Once the usersdecide on the final selection of the sourcesthey may download data directly to theirlocal machines. Data being downloadedcan be converted to canonical form forpossible analysis. This is achieved by aset of conversion functions that are part ofthe integration component. Data that areintegrated are stored in the data warehouse.The data warehouse is a multidimensionalmodel of commonly used source data,which also stores wavelet coefficients.Once users have obtained data, they canvisualize, navigate, and discover patternsat different dimensions and resolutions toaid knowledge discovery.Data IntegrationIn this section, we address issues related to (1) data sources and relationshipsthat form among them, (2) semantic networks, for recommendation of additionaland relevant data sources visualized as hyperbolic trees, and (3) automatic expansionand augmentation of the semantic networkby observing user patterns.Describing Data Sources and their RelationshipsThe plethora of diverse data in environmental research poses significantintegration problems. Some data sourcesmay be structured or semi-structured databases with varying data models (relational,object-oriented, object-relational, etc.);some may be available as spreadsheets,while others may be flat files. Data mayalso contain spatial information in rasteror vector formats.We take a metadata approach, in whichwe store information about the data, whichis collected and stored in the metadata layerwith details from both scientific and storageperspectives. For example, many ecosystemstudy projects collect data related to climate(e.g., precipitation depth, wind speed, windvelocity, air temperature, humidity), soils(e.g., temperature, water content, tracegases), and streams (e.g., depth, flow rate,temperature, nutrients, pathogens, toxics,biota). For each such category, we store itsdefinition, measurement unit, collectionfrequency, and measurement location, tocreate an accurate description of what isbeing collected, how it is measured, whereit is stored, and how it is accessed. Usually, this type of information is availablefrom the data sources themselves. It is partof a routine process to specify specificmetadata information when users submitdata at the data sources. Additional information may also be stored from externalsources (e.g., the Open Research System(ORS)). In general, information about datasources is not significantly large, especiallywhen compared with the amount of actualdata at the sources; metadata informationcan be collected from the sources eitherautomatically (through an applicationprogramming interface (API) if available)or manually. All such information is keptin the metadata repository and it servesthe purpose of a universal registry; similarbut not identical to universal description,discovery and integration (UDDI) for Webservices. The metadata repository, stored inan object-relational database, is augmentedwith information on additional data sourcesas needed.This work expands on the specificationof relationships among database objectsstored in heterogeneous database systems(Georgakopoulos, Karabatis, & Gantimahapatruni, 1997; Karabatis, Rusinkiewicz,& Sheth, 1999; Rusinkiewicz, Sheth, &Karabatis, 1991; Sheth & Karabatis, 1993).Copyright 2007, Idea Group Inc. Copying or distributing in print or electronic forms without written permission of Idea Group Inc.is prohibited.
50 Journal of Database Management, 18(1), 43-67, January-March 2007We have created a methodology allowingresearchers to derive semantic relationships among data sources based on sourcedescriptions in the metadata layer. Thesesemantic relationships form a semanticnetwork of related information, which assists users to discover additional information, relevant to their search but possiblyunknown to them. We realize that somerelationships may not be captured initiallyin the metadata repository, especially whensemantic incompatibilities prevent directidentification of data (such as problemsrelated to synonyms, homonyms, etc.).Nevertheless, missing relationships arecaptured and added to the metadata repository by observing researchers’ usage patterns when they interact with the semanticnetwork, as will be explained further in thecurrent section. The notion of relationshipsbetween concepts is also related to thetopic maps or concept maps (TopicMap),and Semantic Web (W3C) for XML andweb documents containing metadata aboutconcepts. However, our work does not limititself only to XML or web data, but can beused to describe data in general.Converting Data to a Canonical FormEnvironmental data sources may havedifferences in formats, data units, spatialand temporal granularities, and may be collected at different time intervals. We haveimplemented methods and/or applicationsto convert between different units andformats. In addition, spatial and temporaldisparities are resolved using spatial andtemporal join/aggregation operations andintegrating data at the appropriate level.As an example, suppose that we need tointegrate stream chemical and biologicaldata collected at each site with land useand land cover data. In our data warehousemodel, each site belongs to a stream reach,and each stream reach belongs to a subwatershed (the land area that drains to aparticular point along a stream segmentand is represented by a polygon feature).Land use/land cover data is also collectedon areas represented by polygons (althoughthese polygons are different and smallerthan polygons for sub-watersheds). Thus,we aggregate stream data to sub-watershedlevel, and then aggregate land use/landcover data to areas represented by thesame set of polygons for sub-watershedsusing re-projection, spatial joins, or overlayfunctions provided by ArcObjects, the APIincluded in the ESRI’s ArcGIS softwaresuite (www.esri.com/software/arcgis).Using Semantic Networks to ExpandUser QueriesIn this section, we provide details onthe creation and utilization of semanticnetworks. We formally define semanticnetworks and we present techniques toextract information from semantic networksand recommend additional and relevantdata sources to users in their search ofrelated data sources. We also present analgorithm to automatically refine, anddynamically augment semantic networks;Semantic networks have long been used torepresent relationships (Masterman, 1961).We take advantage of their structure toelicit additional semantic information forenvironmental data.Definition 1: We formally define a semanticnetwork G(V,E,W) as a graph G where: V is the set of nodes in the network.Each node represents a data source ordata set. For convenience, we use datasource and data set interchangeablyin this article.Copyright 2007, Idea Group Inc. Copying or distributing in print or electronic forms without written permission of Idea Group Inc.is prohibited.
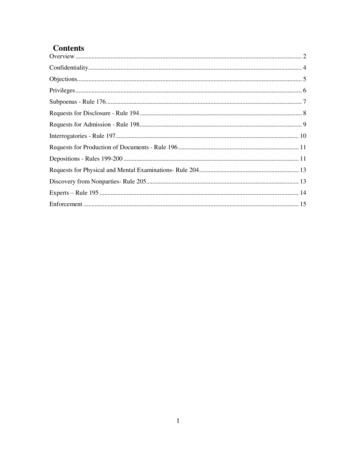
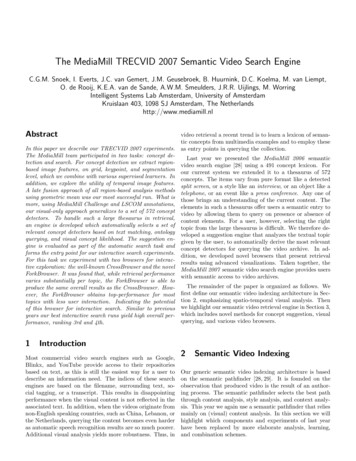
Journal of Database Management, 18(1), 43-67, January-March 2007 51Figure 2. An example semantic networkFishPopulation0.9StreamTemperature0.9Land Use/Land Cover 0.9ImperviousSurfacesE is the set of directed edges in thenetwork. An edge (vi, vj) indicates thatnode vi is semantically related to nodevj.W is a V * V relevance score matrix,where W(i,j) is a number in range of[0,1] and represents the degree of relevance (or relevance score) betweennodes vj and vi.Figure 2 depicts an example semanticnetwork related to fish population. The number on each edge represents the relevancescore associated with the two adjacentnodes. Based on these scores, we can inferthe relevance between any two nodes inthe network. We consider each relevancescore as a conditional probability and assume they are independent of each other(Rice, 1994). For example, the relevancescore between fish population and streamtemperature can be considered as the conditional probability of a researcher interestedin stream temperature given that he or sheis interested in fish population.Using the standard notation for conditional probability, we have:P(surfaces fish) P(surfaces, streamtemperature fish) because the user will beinterested in impervious surfaces, assuming the user is also interested in streamtemperature.Using chain rules and assuming allconditional probabilities are independent(Rice, 1994), we have:P(surfaces, temperature fish) P(temperature fish) * P(surfaces temperature) 0.9 * 0.9 0.81.In general, if vi and vj are two nodes,there are k paths p1, , pk between vi andvj, where path pl (1 l k) consistsof nodes vl1, , vl pl 1 ( pl is the length ofpath pl).The relevance score rs between viand vj isrs min( 1, w(l , lpl 1 i pl ii 1))(1)The above formula computes the relevance score between vi and vj as the sumof relevance scores for all paths connectingvi and vj. For each such path, the relevancescore between the two endpoints is computed as the product of relevance scores forall edges along the path. There can be moredetailed types of semantic relationships(cause-effect, is-a, and is-part-of), or to usemore advanced inference rules without theindependent assumption on the conditionalprobabilities, but these extensions are beyond the scope of this article.Construction of Semantic NetworkWe assume that domain experts haveprovided an initial semantic network, i.e., aset of edges and nodes with their relevancescores. Based on this initial semantic network, we compute the relevance scoresbetween any pair of nodes in the network,and create the matrix W.Let us consider the example in Figure2. Suppose matrix R stores the relevancescores of all edges in the initial semanticCopyright 2007, Idea Group Inc. Copying or distributing in print or electronic forms without written permission of Idea Group Inc.is prohibited.
52 Journal of Database Management, 18(1), 43-67, January-March 2007network. The first, second, third, and fourthrow (column) in the matrix corresponds toedges from (to) fish, temperature, surfacedata, and land data. Rij stores the relevancescore from node i to node j.0 0 0. 9 0 0 0 0.9 0 R 0 00 0 .9 0 000 Based on formula (1), the relevancescore between any pair of nodes equals thesum of relevance scores of all paths betweenthem. Using matrix multiplication rules,and for any given pair (i, j) with i j, wecalculate the sum of relevance scores of allpaths between i and j with length k. It isequal to Rkij where Rk is the multiplicationof k matrices R. For example, the relevancescores of all paths with length 2 is: 0 0R R*R 0 0 20 0.810000000 0.81 0 0 There are two non-zero entries: R213 0.81, identifying the relevance scorebetween fish data to surface data, andR224 0.81 identifying the score betweentemperature and land data. Hence, the relevance score rs between any pair of nodesin the network can be computed using thefollowing formula:rs R1 i Ni(2)Using Semantic Networks to Elicit Additional SemanticsA user in search of ecosystem datasources may perform a keyword search orsubmit a regular SQL query to our system,which in turn will find data sources thatdirectly satisfy the user’s conditions. Wecall these data sources exact answers. Inaddition to the exact answers, we describe anovel approach to enhance and augment theresult set with additional sources, semantically relevant to the exact answers, whichthe user might not be aware of. We achievethis goal by exploiting the semantic network, and returning all data sources whoserelevance score with the exact answers ishigher than a threshold. For simplicity, wehave set the threshold in our system to 0.5but a user can adjust it according to howclosely additional data sources should berelated to the exact answers.For example, suppose a user wants tofind all data sources related to ‘fish population.’ The exact answer contains only thefish population data set because only thatdata set contains the keyword ‘fish population.’ However, using the semantic networkin Figure 2, our system will return all otherthree data sources in the figure because theyare also related to the fish population according to the semantic network. Therefore,we can automatically recommend to theusers additional semantic information (datasources) relevant to the exact answers.Vi
Data Integration There is a rich body of existing work on data integration problems. The fundamental problem is to enable inter-operation across different heterogeneous sources of information. In general, this problem manifests itself either as schema mismatches (schema integration) or data incompatibilities (data integration) while