Transcription
THEOFYMONOECANOZIARFLANDERS INVESTMENT & TRADE MARKET SURVEY
//////////////THE ECONOMY OF ARIZONAMarch //////////////www.flandersinvestmentandtrade.com
INHOUDIntro . 31. General Economic Overview . 41.1 Hit by Covid-1951.2 A business-friendly state71.3 Greater Phoenix is the heavyweight72. Main sectors and industries. 93. Arizona’s trade figures . 123.1 Exports volume, composition and destinations123.2 Imports volume, composition and origins133.3 Arizona’s trade with Belgium163.4 Arizona’s trade with EU244. Rankings of large and/or fast growing companies in Arizona . 264.1 Deloitte Fast 500 companies from Arizona (2020)264.2 Fastest Growing Firms in Arizona (Inc. 2021)274.3 Biggest Employers HQ’d in Arizona (Zippia, 2022)285. Useful contacts . 295.1 Economic Development295.2 Other ////////////////////pagina 2 van 31The Economy of Arizona
INTROThis report draws a portrait of the economy of Arizona, a flourishing economy in the Southwest of theUnited States, where companies from Flanders, Belgium, may find business opportunities. Well-knownBelgian firms in the automotive, construction and chemical sectors have already set up base there.Arizona borders California to the West, Nevada and Utah to the North, New Mexico to the East, andneighboring country Mexico to the South. It counts 7.42 million inhabitants, which makes it 14th among the50 US states in terms of population size. Its economy is the 19th biggest among those same 50 states, witha real Gross Domestic Product that currently sits at 338.77 billion.Historically Arizona’s economy relied heavily on what were called “the five C’s”: copper, cotton, cattle, citrus,and climate. Today some of these are still important, but manufacturing, tech industries and a large servicessector have been added. Like most states in the USA, Arizona today generates most of its revenue from theservices industry.We hope the report will be a source of inspiration for Flemish companies.Our special thanks go to Emilia Pauwels for doing most of the research and writing, during her internshipin the second half of 2021.Flanders Investment & Trade, Los Angeles, March //////////////The Economy of Arizonapagina 3 van 31
1. GENERAL ECONOMIC OVERVIEWWith a nominal Gross Domestic Product of 372.46 billion (in current dollars), Arizona ranked 19th amongthe 50 states in 2020 1, as the table here below agina 4 van 31The Economy of Arizona
Calculated in the more common way of presenting and comparing such figures, the inflation-adjusted “realGDP” (expressed in chained dollars of 2012) arrived at roughly 320.66 billion in 2020. That’s up a remarkable54.3% since 2000.Currently, Arizona’s GDP stands at 338.77 billion (annualized figure, based on the data for the 3rd quarterof 2021). The figures for the full year 2021 are released on March 31, 2022.1.1 HIT BY COVID-19Due to the impact of the Covid-19 pandemic, Arizona saw a negative GDP growth in 2020 just like the restof the states and the nation as whole, but it decreased at the third lowest rate, behind Utah and Washingtonstate, at 0.9%, whereas the U.S. GDP growth was -3.5% 2.Figures of the U.S. Bureau of Labor Statistics show that the state’s unemployment rate was on a steadydecline, until the COVID-19 pandemic hit. From 4.9% in February 2020, just before Covid “exploded” in theUS, unemployment rocketed to 14.2% two months later, in April, but then gradually descended again, to6.6% in July 2021 3 - slightly higher than the national average of 5.4% at that time. 000000000003?amp%253bdata tool XGtable&output view data&include graphs true(graph) ////////////////////////////////////The Economy of Arizonapagina 5 van 31
Arizona is projected to see 1.9% annual job growth over the next eight years, compared to the nationalprojected 0.4% annual job growth 5.For a glimpse of incomes in Arizona and in the United States, looking at per capita income is most helpful.Real personal income per capita is income per person adjusted for state price level differences and nationalinflation, according to the Bureau of Economic Analysis. Thus, real personal income per capita is a moreaccurate measure than using just personal income per capita, which is nominal and doesn’t account forinflation or cost of living differences in each state.Real U.S. per capita income in 2020 was 53,504, representing a 12.8% increase since 2015, when it stood at 47,414.Arizona is among the 10 states with the lowest real per capita income in 2020. Compared with its richerneighbor California the figures were as follows:ArizonaReal per capita income: 45,193Nominal per capita income: 49,648CaliforniaReal per capita income: 57,347Nominal per capita income: //////////pagina 6 van 31The Economy of Arizona
1.2 A BUSINESS-FRIENDLY STATEIn most rankings Arizona figures within the top half of all the states when it comes to business-friendlyclimates. Its low tax rates, limited market regulations, close proximity to thriving domestic markets and easyaccess to international markets through its airports, make the state attractive to potential businessinvestments. It may not be among the very, very best in class, but in general it delivers a nice performance.In SiteSelection magazine’s “2020 Executive Survey Business Climate Rankings”, the state ranked tenth 6.On Forbes’ list of “Best States for Business” (2019) 7 Arizona ended up in 18th place. For the sub-rankings inthat study the state was:3rd in Growth Prospects38th in Business Costs12th in Labor Supply18th in Regulatory Environment12th in Economic Climate35th in Quality of LifeFurthermore, Arizona ranked 17th in the Milken Institute’s “State Technology and Science Index” 8. It was 29thin the “State Competitiveness Index” by the Empire Center for Public Policy 9. And 13th on the “Rich StatesPoor States Economic Outlook Rank” 10, which looks at tax rates and state revenues.In the “2022 State Business Tax Climate Index” by The Tax Foundation, Arizona is 23rd in the pack of 50, soit’s in the “better half”. 11 The state’s corporate income tax rate is 4.9%. (Note: the federal corporate incometax is 21%. Corporations may deduct state corporate income tax paid against federal taxable income,lowering the effective federal corporate income tax rate).1.3 GREATER PHOENIX IS THE HEAVYWEIGHTThe Greater Phoenix area, home to 4.7 million Arizonians, accounts for around 73% of Arizona’s GDP, with 255 billion, putting it in 16th place among all metropolitan areas in the U.S 12.With most Arizona-based Fortune-500 companies located in Phoenix, the metropolitan area has beenprojected to be the most rewarding city in the state to do business in. Phoenix ranked 9th on l8 ports-pdf/State-Tech-Science-V6 0.pdf9 mpetitiveness-index/10 https://www.richstatespoorstates.org/states/AZ/11 climate-index/12 ////////////////The Economy of Arizonapagina 7 van 31
Magazine’s list of top 10 cities to start a business in in 2020 13. And the greater Phoenix area is home toover 1,000 foreign ///////////////////////////pagina 8 van 31The Economy of Arizona
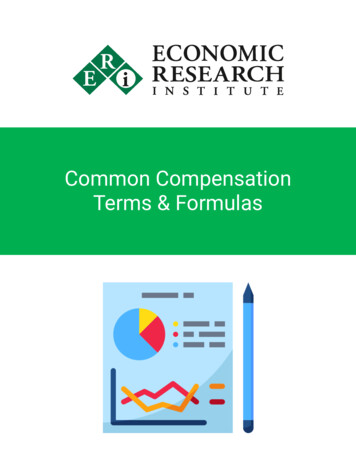
2. MAIN SECTORS AND INDUSTRIESIn terms of real value added to the state’s GDP, Arizona’s biggest sectors are finance, real estate andinsurance services, professional and business services, government and related enterprises, educational,health care, and social services, and manufacturing, as can be seen on the graph below.The industries that offer the most employment in the state, however, include aerospace and defense,electronics, and semiconductor manufacturing.Because of its climate and attractions, including Monument Valley and Grand Canyon National Park, tourismis also one of the larger sectors.The tech industry is growing rapidly, with more STEM graduates from major universities in the state stayingin the state than before, and it has a 40% higher job growth rate in the industry than the U.S. overall 14. Themost important part of the tech industry in Arizona is semiconductor manufacturing, with globally //////////////////////The Economy of Arizonapagina 9 van 31
semiconductor companies such as Intel Corporation and ON Semiconductor housing some of theirmanufacturing facilities and/or headquarters in the state.In March 2021, Intel announced a substantial expansion of its Arizona-based manufacturing capacity witha 20 billion investment, which includes two new semiconductor fabrication facilities and the creation of3,000 new high-tech, high-wage jobs in Chandler, near Phoenix. The investment will add to Intel’s alreadyexisting operations there with about 12,000 employees.In 2020 another semiconductor giant, the Taiwanese TSMC, had announced to build a chip factory in Arizonafor 10 to 12 billion, and in 2021 it doubled that amount by planning an additional fab there.Forbes magazine went so far as to say Arizona has become the U.S.’ “Semiconductor Central”. It claimsArizona has five essential resources for the semiconductor industry to thrive, namely available land,infrastructure, skilled talent, a lack of natural disasters, and attractive tax incentives 15. The industry isexpected to grow steadily in Arizona, as other tech giants such as Samsung have also announced plans ofopening semiconductor fabs in the area.There’s also a sizeable software industry in Arizona: in total, the state is home to more than 500 softwarecompanies 16.Cybersecurity and advanced computer technologies have been recognized, by state and local governments,as an industrial cornerstone for the Arizona economy. Leadership is committed to supporting this vitalindustry.Arizona is home to the headquarters of the United States Army Network Enterprise Technology Command(NETCOM). Its mission is to lead the global operations of the Department of Defense Information Network(DoDIN) whichensures freedom of action in cybersecurity while denying the same to the adversaries of the USA. NETCOMis headquartered at Fort Huachuca, AZ and provides all the information technology services for all networkcommunications. The operation employs nearly 16.000 soldiers, civilians, and contract personnel aroundthe world.The aerospace and defense industry in Arizona is particularly promising, and major airplane manufacturerssuch as Raytheon, Boeing, Honeywell International, General Dynamics, and Northrop Grumman are someof the largest employers in the industry. The defense industry initially started out in Arizona because itsclear skies were perfect for holding military training and flight exercises, and the commercial airline industryfollowed shortly after. The state ranks seventh in aerospace industry employment overall in the US andfifth in employment in uctor-central/?sh ///////////////////////////pagina 10 van 31The Economy of Arizona
Ranked by employment, the healthcare industry is very essential to Arizona with over 250,000 health careworkers. The industry boomed significantly after the introduction of the ‘competitiveness package’ signedinto legislation in 2011 by Governor Jan Brewer. In 2018, hospitals contributed 29.8 billion to the economy 17,and hospital workers accounted for 7% of the total workforce in the state. The largest private employer inArizona is Banner Health, operating 30 hospitals across six states.In finance and insurance Greater Phoenix has the sixth largest cluster in the United States by employment.The region has added nearly 55,000 jobs in finance and insurance in the last decade.Following an example set by the United Kingdom, on March 22, 2018 Arizona became the first state in theU.S. to create a Regulatory Sandbox Program (RSP) where financial services companies can test innovativeproducts and technology in market for up to 24 months without obtaining a license or other authorizationsthat might otherwise be required.It encourages the development of emerging industries like FinTech, blockchain and cryptocurrenciesthroughout the state.Autonomous or self-driving vehicles are a promising industry for the state, with Greater Phoenix leadingthe way. Governor Doug Ducey signed an executive order in 2015 allowing for the testing of self-drivingvehicles on public roads in Arizona, and research is underway to expand the use of the autonomous vehicles.A report by Intel estimated that autonomous vehicle technology will allow for a new economy, wortharound 7 trillion globally by 2050. This industry works closely with the semiconductor industry, as itprovides the necessary technology for the self-driving vehicles.Among the companies innovating and testing autonomous driving technology in Greater Phoenix are giantslike Ford, GM, Chrysler, Toyota, Lucid Motors, Intel, NXP Semiconductors, ON Semiconductors, and Waymo,the former Google self-driving car project that is now a separate subsidiary of Google-parent Alphabet.Phoenix is the only market where Waymo is currently operating its self-driving ride-hailing service, WaymoOne, to the general public.Electric and hydrogen-fueled vehicles are another developing segment of the Arizona economy. NikolaMotors (in trucks) and Lucid Motors (in cars) both have factories in Arizona.The real estate and construction industries are also booming in Arizona as a result of the growingpopulation and especially the influx of people moving to the Phoenix ////////////The Economy of Arizonapagina 11 van 31
3. ARIZONA’S TRADE FIGURESArizona’s international trade (imports and exports) accounts for 14% of the state’s GDP. That may seemlittle - to the Belgian eye – but one needs to keep in mind that the state has an enormous intra-nationalor domestic market: the USA, with their 330 million consumers.3.1 EXPORTS VOLUME, COMPOSITION AND DESTINATIONSLittle wonder then that exports only account for less than 10% of Arizona’s GDP. To compare: in Belgium,with its small domestic market of 11.5 million people, exports account for a little over 80% of its GDP.In the past, Arizona’s primary exports were the so-called “Four C’s” : copper, cotton, cattle, and citrus. Someauthors write about “Five C’s”, adding “climate”, which refers to Arizona’s more than 300 days of sunshineper year that help bring tourists to its natural wonders like the Grand Canyon and Monument Valley, andattract people from out of state to have a second residence in Arizona and spend the winters there.But several decades ago Arizona started shifting towards more manufacturing exports. Today, the Five C’srepresent a more modest impact on Arizona’s economy. (But they still play a strong “cultural” role.) Onlycopper still accounts for a sizeable chunk of the state’s exports.Most of the Five C’s sales outside Arizona can not be considered “exports” because they are mainly soldwithin the United States. But they are still significant contributors to the economy. Copper ore is the highestcontributor, with “real” exports mainly heading to Mexico, while cattle and citrus exports have remainedquite low in the past few decades. The United States is the fourth largest producer of copper ore in theworld, and Arizona accounts for two thirds of the nation’s copper production ///////////////////////pagina 12 van 31The Economy of Arizona
Arizona’s total exports of goods were 19.7 billion USD in Covid-year 2020, a significant decrease from the24.7 billion registered in 2019. In 2021 exports slightly firmed to 19.8B, making it the 21st largest exportingstate in the USA. 19 (Note that Arizona has no seaports, it is landlocked.)Of the 19.7 billion USD exports of Arizona, some 15.1 billion originated from the Phoenix Metropolitan area.The exports produced by the greater Phoenix area increased by 62% from 2010 to 2019 20.In 2021 the top export destinations of Arizona were Mexico ( 8.18B), Canada ( 2.27B), China ( 1.49B), Ireland( 844M), and the Netherlands ( 806M). Further below in this report we’ll have a closer look at Arizona’sexports to Belgium and to the EU-27.3.2 IMPORTS VOLUME, COMPOSITION AND ORIGINSIn 2021 the top exports of Arizona were Aircraft parts ( 3.25B), Electronic integrated circuits, processors andcontrollers ( 1.69B), Copper ores and concentrates ( 1.69B), Electronic integrated circuits ( 705M), andInstruments, appliances for medical and science ( 465M).Arizona’s imports in goods were 25.7 billion USD in covid-year 2020, down from 26.6 billion in 2019. In 2021Arizona imported 25.6B, making it the 24th largest importing state in the USA.1920https://oec.world/en/profile/subnational usa state/az?redirect true&subnationalTimeSelector ///////////////////////////////////////The Economy of Arizonapagina 13 van 31
Top imports of Arizona last year were Commodities ( 2.7B), Machines and apparatuses ( 850M), Fixed wingaircraft ( 812M), Electronic integrated circuits, processors and controllers ( 746M), and Copper cathodes andsections of cathodes ( 622M).In 2021 the top import origins of Arizona were Mexico ( 9.4B), China ( 3.69B), Canada ( 2.34B), Japan ( 1.6B),and Taiwan ( 1.3B). Further below in this report we’ll have a closer look at Arizona’s imports from Belgiumand from the ////////////////pagina 14 van 31The Economy of Arizona
//////////The Economy of Arizonapagina 15 van 31
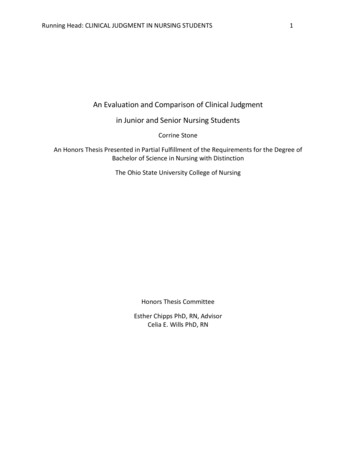
3.3 ARIZONA’S TRADE WITH BELGIUMBelgium is Arizona’s 26th export destination, and its 32nd source of imports. 21 The Netherlands rank muchhigher on both counts: 4th export destination, and 13th source of imports.Arizona’s imports from BelgiumThe graph below shows the top imports in 2021 from Belgium into Arizona. 22(Source: Greater Phoenix Economic Council (GPEC), “Belgian Trade & Investment Profile”, March destatsThe first category in the table, “Goods Returned (Exports & Imports) and Reimports (Canada only)” is a little strange, as it concerns items that,after having been exported from the USA, returned with no extra value added, e.g. for repair, or for other reasons. But the category – based onHTS code 9801 - is basically a ‘black box’ with goods that can pertain to all kinds of sectors. One possible explanation could be that some USand/or Canadian companies arrange their “returns” from the European market through a logistical hub in Belgium and to their headquarters orsubsidiaries in Arizona. And that this leads to its high relative weight in a rather low total amount of Arizona’s imports from Belgium. (We werenot able to get a precise explanation from several sources that we /////////////////////////pagina 16 van 31The Economy of Arizona
The table below shows top imports into Arizona from Belgium and their percentage change from 2016 to2021 .Imports20162021Percent Change 9,364,157 13,702,08946.3%Chemicals 2,083,902 8,798,687322.2%Computer andelectronic product 4,778,465 7,226,64051.2%Misc. Manufacturedcommodities 860,254 3,329,574287%Fabricated metalproducts 3,104,014 2,804,695-9.6% 2,189,313 2,512,08714.7% 8,848,675 2,432,326-72.5% 574,736 1,007,59875.3%Printed Matter andRelated Product, 5,187 625,42411957.5%Textile and Fabrics 135,870 540,223297.6%All other 2,682,341 1,777,867-33.7%Total 34,626,914 44,757,21029.3%Goods returned(exports and Imports)and ReimportsCanada only 23Machinery, exceptelectricalElectrical ment23Same explanation as footnote 22, on the previous ///////////////The Economy of Arizonapagina 17 van 31
The table and graph below show the top growing categories in imports from Belgium into Arizona, bypercent change from 2016 to 2021.20162021% ChangePrinted matter &related products 5,187 625,42411957.5%Wood products 33,280 294,010783.4% 5,730 43,892666.0% 2,082,902 8,798,687322.2% 135,870 540,223297.6% 860,254 3,329,574287.0%Non-metallicmineral products 148,218 319,938115.9%Transportationequipment 574,736 1,007,59875.3% 4,778,465 7,226,64051.2%US Goods Ret &Reimps; Goods Retto CA (EXP) 9,364,157 13,702,08946.3%Total 34,474,239 onsChemicalsTextile & fabricsMisc.ManufacturedcommoditiesComputer andElectronicProducts(Source: GPEC, March ////////////////pagina 18 van 31The Economy of Arizona
(Source: GPEC, March ////////////////The Economy of Arizonapagina 19 van 31
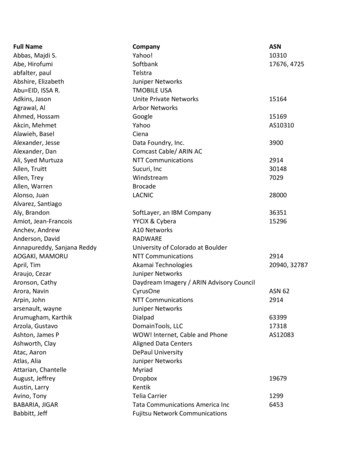
Arizona’s Exports to BelgiumThe table below shows the top export categories from Arizona to Belgium and their percentage changefrom 2016 to 2021.AZ Exports20162021% Change 137,939,595 33,312,769-75.8%TransportationEquipment 5,813,252 22,542,571287.8%Fabricated MetalProducts 26,734,033 15,386,266-42.4%Plastic & RubberProducts 9,824,323 14,637,05949%Processed Foods 293,575 11,021,1203,654.1%Chemicals 11,669,781 9,409,222-19.4%Machinery ExceptElectrical 4,014,571 8,314,200107.1%MiscellaneousManufactures 15,375,836 4,518,673-70.6%Electrical Equipment,Appliances, Components 6,560,617 4,214,747-35.8%Other Special Classif.Provisions 303,931 1,431,513371%All Other 5,877,461 3,222,332-63.5%Total 224,406,975 128,010,472-43%Computer & ////////////////////////////pagina 20 van 31The Economy of Arizona
The graph below shows the top export categories from Arizona to Belgium in 2021.(Source: GPEC, March ////////////////The Economy of Arizonapagina 21 van 31
The fastest growing categories in Arizona’s exports of goods to Belgium are as follows:Exports20162021% ChangeProcessed Foods 293,575 11,021,1203,654.1%Used or SecondHand Merchandise 113,556 828,850629.9%Other SpecialClassification Provisions 303,931 1,431,513371.0%TransportationEquipment 5,813,252 22,542,571287.8%Printed Matter &Related Products 23,477 65,307178.2%Machinery, ExceptElectrical 4,014,571 8,314,200107.1%Plastics & RubberProducts 9,824,323 14,637,05949.0%Waste & Scrap 2,503 3,56542.4%Minerals & Ores 126,526 174,01937.5%Primary MetalManufactures 299,860 368,70523.0% 20,815,574 59,386,909185.3%Total(Source: GPEC, March ////////////////pagina 22 van 31The Economy of Arizona
(Source: GPEC, March ////////////////The Economy of Arizonapagina 23 van 31
3.4 ARIZONA’S TRADE WITH EUArizona’s Imports from the EU-27The table below shows the main categories of imports into Arizona from the EU-27 and their percentagechange from 2016 to 2021.Imports20162021% ChangeComputer & electronicproducts 887,670,995 1,111,916,63725.3%Transportationequipment 393,856,466 890,866,792126.2%Machinery, exceptelectrical 685,433,594 544,542,911-20.6% 518,276,326 436,651,645-15.7% 175,119,611 167,341,608-4.4% 151,722,218 152,333,9380.4%Fabricated metalproducts 72,878,638 90,417,75424.1%Beverages & tobaccoproducts 56,486,410 75,932,09334.4%Miscellaneousmanufactures 63,540,509 58,129,485-8.5%Primary metalmanufactures 54,074,326 52,202,439-3.5% 131,341,266 196,679,54549.7% 3,190,400,359 3,777,014,84735.9%Goods returned(Exports and Imports)and Reimports(Canada only)ChemicalsElectrical equipment,appliances &componentsAll otherTotal(Source: GPEC, March ////////////////pagina 24 van 31The Economy of Arizona
Arizona’s Exports to the EU-27The table below shows the main categories of exports from Arizona to the EU-27 and their percentagechange from 2016 to 2021.Exports2016Computer & ElectronicProducts 630,925,137 1,356,396,280115.0%TransportationEquipment 853,392,724 799,512,724-6.3%Machinery, ExceptElectrical 171,907,101 268,390,59256.1%Minerals & Ores 68,772,128 209,383,317204.5%Electrical Equipment,Appliances &Components 154,558,019 173,813,67812.5%Fabricated MetalProducts 202,275,253 164,752,723-18.6%Chemicals 116,343,842 162,957,72040.1%MiscellaneousManufactures 156,864,640 153,427,859-2.2%Special ClassificationProvisions 62,403,102 62,585,8640.3%Agricultural Products 67,116,227 56,288,817-16.1%All Other 138,498,276 157,891,51314% 3,565,401,08735.9%Total 2,623,056,4492021% Change(Source: GPEC, March ////////////////The Economy of Arizonapagina 25 van 31
4. RANKINGS OF LARGE AND/OR FAST GROWINGCOMPANIES IN ARIZONA4.1 DELOITTE FAST 500 COMPANIES FROM ARIZONA (2020)Every year consultancy Deloitte presents a ranking of the 500 fastest growing technology companies inNorth-America. 24 In 2020 the following tech firms
Poor States Economic Outlook Rank" 10, which looks at tax rates and state revenues. In the "2022 State Business Tax Climate Index" by The Tax Foundation, Arizona is 23rd in the pack of 50, so it's in the "better half". 11. The state's corporate income tax rate is 4.9%. (Note: the federal corporate income tax is 21%.