Transcription
R e s e a r c hAugust 8, 2002TopicalStudy#56Dr. Edward Yardeni(212) 778-2646ed yardeni@prusec.comStock Valuation Models
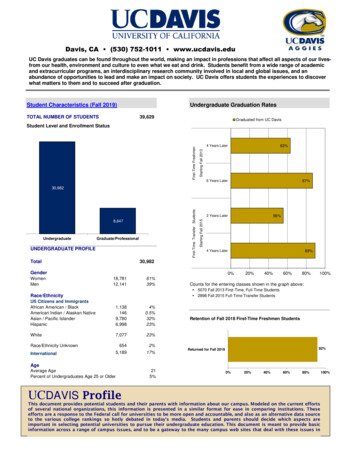
2Figure 1.FED’S STOCK VALUATION MODEL &70 YARDENI’S ASSET ALLOCATION MODEL: BONDS/STOCKS*(for Moderately Aggressive Investor, percent)8080705060Stocks overvalued when greater than zeroStocks undervalued when less than 700030/70-1020/8010/90-20-30-20-30Yardeni79 80 81 82 83 84 85 86 87 88 89 90 91 92 93 94 95 96 97 98 99 00 01 02 03 04 05 06 07 08-40August 8, 2002* Ratio of S&P 500 index to its fair value (12-month forward consensus expected operating earnings per sharedivided by the ten-year U.S. Treasury bond yield) minus 100. Monthly through March 1994, weekly after.Source: Thomson Financial.Stock Valuation Models-408/2-10
RESEARCHStock Valuation ModelsI. Judging ValueHow can we judge whether stock prices are too high, too low, or just right? Investmentstrategists are fond of using stock valuation models to do so. Some of these are simple. Someare complex. Data on earnings, dividends, interest rates, and risk are all thrown into theseblack boxes to derive a “fair value” for the stock market. If the stock market’s price indexexceeds this number, then the market is overvalued. If it is below fair value, then stocks areundervalued. Presumably, investors should buy when stocks are undervalued, and sell whenthey are overvalued.In this topical study, I will examine a simple stock valuation model, which has been quite usefuland can also be used as a stocks-versus-bonds asset allocation tool (Figure 1). I started tostudy the model in 1997, after reading that the folks at the Federal Reserve have been using it.If it is good enough for them, it is good enough for me. I dubbed it the Fed’s Stock ValuationModel (FSVM), though no one at the Fed ever officially endorsed it.The FSVM has caught on since then, partly because I have been updating it on a daily basis onmy Website.1 Barron’s frequently mentions it. The cover page of the September 24, 2001,issue observed that the stock market was “the biggest bargain in years.” The bullish article,titled “Buyers’ Market” and written by Michael Santoli, was entirely based on the FSVM, whichshowed that stocks were extremely undervalued when the New York Stock Exchange reopenedfor trading on September 17, 2001.A model can help us to assess value. But any model is just an attempt to simplify reality, whichis always a great deal more complex, random, and unpredictable. Valuation is ultimately ajudgment call. Like beauty, it is in the eye of the beholder. It is also a relative concept. Thereare no absolutes. Stocks are cheap or dear relative to other investment and spendingalternatives. A model can always be constructed to explain nearly 100% of what happened inthe past. “Dummy variables” can be added to account for one-time unpredictable events orshocks in the past. However, the future is always full of surprises that create “outliers”; i.e.,valuations that can’t be explained by the model. For investors, these anomalies present both thegreatest risks and the greatest rewards.More specifically, almost everyone’s valuation models went on red alert in 1999 and 2000.Stocks were grossly overvalued. With the benefit of hindsight, it was one of the greatest stockmarket bubbles ever. Investors simply chose to believe that the models were wrong. Thepressure to go with the flow of consensus sentiment was so great that some strategistsreengineered their models to show that stocks were still relatively attractive. One widelyfollowed pundit simply replaced the bond yield variable with the lower inflation rate variable inhis model to accomplish the alchemy of transforming an overvalued market into anundervalued one.I fought the urge to fiddle with my adopted model. So I repeatedly warned that the market wasextremely overvalued. However, I did observe that while investing in a bubble is dangerous, it13www.prudential.com/yardeniAugust 8, 2002
RESEARCHStock Valuation Modelscan be extremely rewarding if you remember to get out just before the bubble bursts.2 That waseasier said than done.I have to admit that I did fiddle with the simple model to find out if it was missing something asstocks soared well above earnings. This led me to devise an “improved” version of the model:FSVM-2. It convinced me that stocks were priced for perfection as investors increasinglyseemed to accept the growing optimism of Wall Street’s industry analysts about the long-termprospects for earnings growth. The improved model also demonstrated that investors weregiving more weight to these increasingly irrational expectations for earnings in the valuation ofstocks! As I will show, analysts have been slashing their long-term earnings growth forecastssince early 2000, and investors are once again giving very little weight to earnings projectionsbeyond the next 12 months.3The question during the summer of 2002 is whether investor sentiment had swung too far fromgreed to fear. According to the FSVM, stocks were 37% undervalued in late July. This was themost extreme such reading since 1979 and 1980. Despite a huge jump in stock prices at theend of July, the FSVM has become quite controversial. The bears contend that the model isflawed. Stocks are not undervalued at all, in their opinion. Stocks are still overvalued and mayfall much lower over the rest of this year and next. Ironically, not too long ago, it was the bullswho declared that stocks were not overvalued, and offered lots of reasons to ignore the FSVM.I believe that the model is still useful and should not be ignored. Nevertheless, it should be onlyone of several inputs investors use to assess whether it is a good or bad time to buy stocks. Forexample, while the FSVM indicated that I should increase my recommended exposure toequities in June and July of this year, I went the other way: I lowered my exposure from 30/70bonds/stocks to 35/65 for a Moderately Aggressive Investor. For a Moderate Investor, Ichanged my recommended cash/bonds/stocks allocation from 10/40/50 to 10/50/40. I did sobecause I concluded that investors might continue to worry about the quality of earnings afterWorldCom disclosed on June 26 that the company’s earnings for the past several quarters wereoverstated as a result of fraudulent accounting.2For example, on February 1, 1999, I wrote “I have a deep faith in the wisdom of the public. But it’s been shaken by thebuying frenzy in the stock market. I like prosperity as much as anyone else does. But the action so far this year has beenmanic. Of course, manias can be very profitable on the way up. The problem is that it is always very difficult to guess whenthe bubble is likely to burst. If you get out too early, you feel stupid and poorer. If you stay too long, you feel stupid andpoorer. The recent drop in Internet stocks may have been the beginning of the end, or not. For now, I’ll go with the flowand conclude that the bubble will inflate some more.”3In my Topical Study #44, “New, Improved Stock Valuation Model,” dated July 26, 1999, I wrote, “My analysis willdemonstrate that the market’s assumptions about risk, and especially about long-term earnings growth may beunrealistically optimistic, leaving it vulnerable to a big fall .The stock market is clearly priced for perfection. If perpetualprosperity continues uninterrupted, then perhaps the market’s exuberant expectations will be realized. I, however, see morepotential for disappointment, given the extreme optimism about long-term earnings growth embedded in current marketprices.”4August 8, 2002
RESEARCHStock Valuation ModelsII. Fed’s Stock Valuation ModelAfter Fed Chairman Alan Greenspan famously worried out loud for the first time about“irrational exuberance” on December 5, 1996, he probably instructed his staff to devise a stockmarket valuation model to help him evaluate the extent of the market’s exuberance.Apparently, they did so and it was made public, though buried, in the Fed’s Monetary PolicyReport to the Congress, which accompanied Mr. Greenspan’s testimony on July 22, 1997.4Twice a year, in February and July, the Chairman of the Federal Reserve delivers a monetarypolicy report to Congress. The Chairman’s testimony is widely followed and analyzed. Virtuallyno one reads the actual policy report, which accompanies the testimony. I regularly read thesereports.The Fed model was summed up in one paragraph and one chart on page 24 of the 25-pagedocument (Figure A). The chart shows an amazingly strong correlation between the ten-yearTreasury bond yield (TBY) and the S&P 500 current earnings yield (CEY)—i.e., the ratio of 12month forward consensus expected operating earnings (E) to the price index for the S&P 500companies (P).Figure A: Excerpt From The Fed’s July 1997 Monetary Policy ReportThe run-up in stock prices in the spring was bolstered by unexpectedly strong corporate profitsfor the first quarter. Still, the ratio of prices in the S&P 500 to consensus estimates of earningsover the coming twelve months has risen further from levels that were already unusually high.Changes in this ratio have often been inversely related to changes in long-term Treasury yields,but this year’s stock price gains were not matched by a significant net decline in interest rates.As a result, the yield on ten-year Treasury notes now exceeds the ratio of twelve-month-aheadearnings to prices by the largest amount since 1991, when earnings were depressed by theeconomic slowdown. One important factor behind the increase in stock prices this yearappears to be a further rise in analysts’ reported expectations of earnings growth over the nextthree to five years. The average of these expectations has risen fairly steadily since early 1995and currently stands at a level not seen since the steep recession of the early 1980s, whenearnings were expected to bounce back from levels that were quite low.Source: Monetary Policy Report to the Congress, Federal Reserve Board.It is relatively easy to calculate 12-month forward earnings for the S&P 500. The data aresimply a time-weighted average of the current and next year’s consensus estimates produced byWall Street’s industry analysts. Every month, Thomson Financial surveys these folks andcompiles monthly consensus earnings estimates for the current and coming year. Theconsensus data for the S&P 500 companies are aggregated on a market-capitalization-weightedbasis. To calculate the 12-month forward earnings series for the S&P 500, we need 23 monthsof data for each year. For example, during January of the current year, 12-month forwardearnings are identical to the expectations for the current year. One month later, in February ofthe current year, forward earnings are equal to 11/12 plus 1/12 of February’s estimates 97/july/ReportSection2.htmAugust 8, 2002
RESEARCHStock Valuation Modelsearnings in the current year and the next year, respectively. Of course, forward earnings areidentical to the current year’s consensus forecast at the start of the current year and convergetoward the coming year’s expectations.This method of calculating forward earnings doesn’t exactly jibe with actual expectations for thecoming 12 months. For example, half of forward earnings in July reflects half of the earningsexpected for the current year, which is already half over. Furthermore, in this case, the otherhalf of forward earnings reflects earnings expectations for July through December of next year;i.e., the 6-month period beyond our 12-month horizon for forward earnings. The problem isthat there are no data available for July of the current year through June of next year. We cancome close using quarterly earnings forecasts, which are also available from ThomsonFinancial. This is unnecessary, in my opinion. The method used by Thomson Financial is agood enough approximation. The data start in September 1978 on a monthly basis (Figure 2).Weekly data are also available since 1994.Because write-offs are one-shot events, analysts cannot model them in their spreadsheets. Inother words, forward earnings are essentially projections of operating earnings. I use forwardearnings, rather than either reported or operating trailing earnings, in most of my analysesbecause market prices reflect future earnings expectations. The past is relevant, but only to theextent that it is influencing the formation of current expectations about the future outlook forearnings.Again, the close relationship between the ten-year Treasury bond yield and the current earningsyield of stocks is impressive. The average spread between CEY and TBY is only 25 basis pointssince 1979 (Figure 3). This suggests that the stock market is fairly valued when:(1) CEY TBYIt is undervalued (overvalued) when CEY is greater (less) than TBY. Another way to see this isto take the reciprocal of both variables in the equation above. In the investment community, wetend to follow the price-to-earnings ratio more than the earnings yield. The ratio of the S&P500 price index to forward earnings (P/E) is highly correlated with the reciprocal of the tenyear bond yield, and on average the two have been nearly identical (Figure 4). This suggeststhat the “fair value” of the valuation multiple, using forward earnings, is simply one divided bythe Treasury bond yield. For example, when the Treasury yield is 5%, the fair value P/E is 20.So, in the Fed’s valuation model, the “fair value” price for the S&P 500 (FVP) is equal toexpected earnings divided by the bond yield and the fair-value P/E is the reciprocal of theTreasury bond yield:(2) FVP E / TBY or,(3) FVP / E 1 / TBYThe ratio of the actual S&P 500 price index to the fair value price shows the degree ofovervaluation or undervaluation (Figure 1). History shows that markets can stay overvaluedand become even more overvalued for a while. But eventually, overvaluation is corrected in6August 8, 2002
RESEARCHStock Valuation Modelsthree ways: 1) interest rates can fall, 2) earnings expectations can rise, and of course, 3) stockprices can drop—the old fashioned way to decrease values. Undervaluation can be correctedby rising yields, lower earnings expectations, and higher stock prices.The Fed’s Stock Valuation Model worked quite well in the past. It identified when stock priceswere excessively overvalued or undervalued, and likely to fall or rise:1) The market was extremely undervalued from 1979 through 1982, setting the stage for apowerful rally that lasted through the summer of 1987.2) Stock prices crashed after the market rose to an all-time record 34% overvaluation peakduring September 1987.3) Then the market was undervalued in the late 1980s, and stock prices rose.4) In the early 1990s, it was moderately overvalued and stock values advanced at a lacklusterpace.5) Stock prices were mostly undervalued during the mid-1990s, and a great bull marketstarted in late 1994.6) Ironically, the market was actually fairly valued during December 1996, when the FedChairman worried out loud about irrational exuberance, and stock prices continued toadvance.7) During the summers of both 1997 and 1998, overvaluation conditions were corrected by asharp drop in stock prices.8) Then a two-month undervaluation condition during September and October 1998 wasquickly reversed as stock prices soared to a remarkable record 70% overvaluationreading during January 2000. This bubble was led by the Nasdaq and technology stocks,which crashed over the rest of the year, bringing the market closer to fair value in late2000 through early 2002.9) While the model suggested that stock prices were fairly valued in the spring of 2002, stockprices plunged in the summer. By late July, the FSVM showed that stocks were 37%undervalued, the lowest reading since 1979. On Wednesday, July 24, the Dow JonesIndustrials Average fell to an intra-day low of 7490, and then rallied dramatically to closeat 8191. By Tuesday the Dow had regained 1317 points intra-day, or 17.6%, the biggestfour-day rally since 1933.According to Ned Davis Research, when the FSVM has shown stocks to be more than 5%undervalued since 1980, the average one-year gain in the S&P 500 has been 31.7%. When themodel has been more than 15% overvalued, the market has dropped 8.7%, on average, in the5following year.57Michael Santoli, “Good-Looking Models,” Barron’s, August 5, 2002.August 8, 2002
RESEARCHStock Valuation ModelsIII. New Improved ModelThe stock market is a very efficient market. In efficient markets all available information is fullydiscounted in prices. In other words, efficient markets should be always “correctly” valued, atleast in theory. All buyers and all sellers have access to exactly the same information. They arecompletely free to act upon this information by buying or selling stocks as they choose. So themarket price is always the correct price, reflecting all available information. In his June 17,1999, Congressional testimony, Federal Reserve Chairman Alan Greenspan soliloquized aboutvaluation:The 1990s have witnessed one of the great bull stock markets in American history.Whether that means an unstable bubble has developed in its wake is difficult toassess. A large number of analysts have judged the level of equity prices to beexcessive, even taking into account the rise in “fair value” resulting from theacceleration of productivity and the associated long-term corporate earnings outlook.But bubbles generally are perceptible only after the fact. To spot a bubble in advancerequires a judgment that hundreds of thousands of informed investors have it all6wrong. Betting against markets is usually precarious at best.This is another one of the Chairman’s ambiguous insights, which may have contributed to thevery bubble he was worrying about. He seems to be saying that the stock market might be abubble, but since the market efficiently reflects the expectations of “thousands of informedinvestors,” maybe the market is right because all those people can’t be wrong. They werewrong, and so was the Fed Chairman about the judgment of all those folks. However, at thetime, the available information obviously convinced the crowd that stocks were worth buying.The crowd didn’t realize that it was a bubble until it burst. In other words, efficient marketscan experience bubbles when investors irrationally buy into unrealistically bullish assumptionsabout the future prospects of stocks.Of course, individually, we can all have our own opinions about whether stocks are cheap orexpensive at the going market price. Perhaps we should consider replacing the terms“undervalued” and “overvalued” with “underpriced” and “overpriced,” respectively. I think inthis way, we acknowledge that the stock market is efficient and that the market price shouldusually be the objective fair value. At the same time, the new terminology allows us to devisevaluation models to formulate subjective opinions about market prices. If my model showsthat the market is overpriced, I am simply stating that I disagree with the weight of opinion thathas lifted the market price above my own assessment of the right price.Now let’s formulate a new, improved model (FSVM-2) that more explicitly identifies thevariables that together determine the value of the stock market. If, for example, the FSVMshows that stocks are 50% overvalued, we need to add variables that can explain why theaggregate of all buyers and sellers believe that the price is right. Once we agree on what is “in”the market, we can each make our own pro or con case, and invest TESTIMONY/1999/19990617.htmAugust 8, 2002
RESEARCHStock Valuation ModelsThe simple version of the FSVM is missing some variables, which might explain why the currentearnings yield might diverge from the Treasury yield. We clearly need to account for variablesthat differentiate stocks from bonds. If the government guarantees that stock earnings will befixed for the next ten years, then the price of the S&P 500 would be at a level that nearly equatesthe current earnings yield to the ten-year Treasury bond yield. But there is no such guaranteefor stocks. Earnings can go down. Companies can lose money. They can also go out ofbusiness . Earnings can also go up. We need variables to capture:1) business risk to earnings, and2) earnings expectations beyond just the next 12 months.The new, improved valuation model (i.e., FSVM-2) reflecting these variables should have thefollowing structure:(4) CEY a b · TBY c · RP d · LTEGwhere CEY is the current earnings yield defined as 12-month forward earnings of the S&P 500divided by the S&P 500 price index. TBY is the ten-year Treasury bond yield. The two newadditional variables are the risk premium (RP) and long-term expected earnings growth,beyond the next 12 months (LTEG). My assumption is that the current earnings yield (“thedependent variable”) is a linear function of the three independent variables on the right of theequation above. There are several other ways to specify the model. But this should do for now.How should we measure risk in the model? An obvious choice is to use the spread betweencorporate bond yields and Treasury bond yields. This spread measures the market’sassessment of the risk that some corporations might be forced to default on their bonds. Ofcourse, such events are very unusual, especially for companies included in the S&P 500.However, the spread is only likely to widen during periods of economic distress, when bondinvestors tend to worry that profits won’t be sufficient to meet the debt-servicing obligations ofsome companies. Most companies won’t have this problem, but their earnings would mostlikely be depressed during such periods. So the new improved model can be represented asfollows:(5) CEY a b · TBY c · (CBY TBY) d · LTEGwhere CBY is the corporate bond yield. Which corporate bond yield should we use in themodel? We can try Moody’s composites of the yields on corporate bonds rated Aaa, Aa, A, orBaa. I found that the spread between the A-rated corporate composite yield and the Treasurybond yield fits quite well. This spread averaged 131 basis points since 1960. It tends to widenmost during “flight-to-quality” credit crunches, when Treasury bond yields tend to fall thefastest (Figure 6).The final variable included in FSVM-2 is one for expected earnings growth beyond the next 12months. Thomson Financial compiles data on consensus long-term earnings growth for theS&P 500 (Figure 7). The monthly data start in 1985 and are based on industry analysts’projections for the next three to five years (Figure B).9August 8, 2002
RESEARCHStock Valuation ModelsIn equation (5) above, my presumption is that a 0 and b c 1. So,(6) CEY CBY d · LTEGor,(7) CEY TBY RP d · LTEGIn other words, in this version of FSVM-2, investors demand that the current earnings yield fullyreflect the Treasury bond yield and the default risk premium in bonds less some fraction oflong-term expected earnings growth. In this model, the market is always fairly valued, the onlyquestion is whether the implied value of “d” and the consensus expectations for long-termearnings growth are too pessimistic (excessively cautious), too optimistic (irrationallyexuberant), or just about right (rational).We can derive “d” from equation (5) as follows:(8) d (CBY CEY) / LTEGPlugging in the available data since 1985, “d” has ranged between 0.33 and -0.27, andaveraged 0.13 (Figure 8). This means that on average, investors assign a weight of 0.13 toLTEG. They don’t give it much weight because historically it has been biased upward (FigureB). They also don’t give it much weight because long-term earnings are harder to forecast thanearnings over the coming 12 months. Notice that in 1999 and early 2000, investors effectivelygave LTEG a weight of 0.23, or nearly twice as much as the historical average. Actually, up until1999, “d” averaged only 0.10. This supports my observation at the beginning of this study thatinvestors were irrationally giving more weight to irrationally high long-term earningsexpectations in the late 1990s.We can derive a set of fair-value time series for the S&P 500 and for the valuation multiple fordifferent values of “d” using the following formula:(9) FVP E / (CBY d · LTEG)(10) FVP / E 1 / (CBY d · LTEG)Obviously, to avoid nonsensical results like a negative fair-value price or an infinite P/E, CBY d · LTEG. We can draw fair-value price series for the S&P 500 using equation (9). We havedata for all the variables except the d-coefficient. Nevertheless, we can proceed by plotting aseries for various plausible fixed values of d. Based on the analysis above, I’ve chosen thefollowing values: 0.10, 0.20, and 0.25. Now we can compare the matrix of the three resultingFVP series to the actual S&P 500. At the end of July, the latest fair value, using d 0.10, was968.02. The S&P 500 was 6.7% below this level (Figures 9 and 10).10August 8, 2002
RESEARCHStock Valuation ModelsFigure B: LongLong-Term Earnings GrowthIn the long-run, profits don’t, and can’t, grow faster than GDP. Historically, this growth rate hasaveraged about 7%. So why do Wall Street’s industry analysts collectively and consistentlypredict that corporate earnings will grow much faster than 7%? From the start of the data in1985 through 1995, analysts estimated that S&P 500 earnings will grow between 10.8% and12.1% (Figure 7). This range well exceeds 7%. The collective forecast of industry analysts forlong-term earnings growth is obviously biased to the upside. Wall Street’s analysts areextrapolating the earnings growth potential for their companies, in their industries. It is unlikelythat most analysts will have the interest and staying power to cover companies and industriesthey believe are likely to be underperformers for the next several years. So, naturally, their longterm outlook is likely to be relatively rosy. This bias is best revealed when the consensus dataare compiled and compared to reality.If the projected earnings growth overshoot is constant over time, then investors can make anadjustment for the overly optimistic bias of analysts, and invest accordingly. This is harder to doduring a speculative bubble, when even the best analysts can get sucked into the mania. Asstock prices soared during the second half of the 1990s, analysts became more bullish on theoutlook for their companies. As they became more bullish, so did investors and speculators.Analysts increasingly justified high stock prices and lofty valuation multiples by raising theirestimates for the long-term potential earnings growth rates of their companies.Long-term earnings growth expectations for the S&P 500 companies started to rise steadily after1995 up to 14.9% by the end of 1998. Then they soared through 2000, peaking at 18.7% duringAugust of that year. Analysts, investors, and speculators ignored the natural speed limitsimposed by the natural growth of the economy and earnings. They forgot that nothing on oursmall Planet Earth can compound at such extraordinary rates without eventually consuming allthe oxygen in the atmosphere.Once the speculative bubble began to burst in March 2000, analysts scrambled to reassess theirwildly optimistic projections. Consensus long-term earnings growth expectations plunged to13.3% for the S&P 500 by July 2002 from the all-time 18.7% peak in August 2000. The reversal forthe technology sector of the S&P 500 was even more dramatic, with growth expectationsdropping to 17.9% in July 2002 from the 2000 peak rate of 28.7%.Source: Edward Yardeni, Prudential Securities.Notice that equations (9) and (10) describing the same FSVM-2 both morph into the Fed’sStock Valuation Model when RP—the corporate bond’s default risk premium—is equal to thelong-term earnings growth term d · LTEG. Historically, on average, this is the case, which iswhy the simple version of the model has worked surprisingly well.7The FSVM is a very simple stock valuation model. It should be used along with other stockvaluation tools, including FSVM-2. Of course, there are numerous other more sophisticatedand complex models. The Fed model is not a perfect market-timing tool. As noted above, anovervalued (undervalued) market can become even more overvalued (undervalued). However,the Fed model does have a good track record of showing whether stocks are cheap or7Since 1985, RP and d · LTEG have averaged 165 and 177 basis points, respectively. Not anexact match, but close enough.11August 8, 2002
RESEARCHStock Valuation Modelsexpensive. Investors are likely to earn below (above) average returns over the next 12 to 24months when the market is overvalued (undervalued).IV. The Quality of EarningsIn my Topical Study #45, “Earnings: The Phantom Menace,” dated August 16, 1999, I onceagain observed that according to the FSVM “the market is extremely overpriced and vulnerableto a significant fall.” I also explained that the model uses the market’s earnings expectations,not mine. I argued again that the market’s expectations were unrealistically optimistic and thatearnings were inflated by phantom revenues and unexpensed stock options:A related problem is that many companies are overstating their earnings by usingquestionable accounting and financial practices. Some are significantly overstatingtheir profits, and they tend to have the highest valuation multiples in the stockmarket. This suggests that investors are not aware that the quality of earnings may berelatively low among some of the companies reporting the fastest earnings growth.This suggests an interesting twist on the valuation model. Let’s assume that the stock market isalways fairly valued; i.e., the P/E is always equal to the reciprocal of the ten-year Treasury bondyield. Using the FSVM, we can easily calculate the market’s estimate of forward earnings (E) bymultip
Dr. Edward Yardeni (212) 778-2646 ed_yardeni@prusec.com ResearchStock Valuation Models . R E S E A R C H Stock Valuation Models . Presumably, investors should buy when stocks are undervalued, and sell when they are overvalued. In this topical study, I will examine a simple stock valuation model, which has been quite useful