Transcription
May 11, 2011400 Turner Street, Suite 102Blacksburg, VA 24061Dr. Shane BallUSDA-National Institute of Food and AgricultureDear Shane:Greetings from the FAEIS team! Following this letter you will find the second statistical quarterly report, asrequired by NIFA’s RFA which states that FAEIS will “Produce quarterly reports on the progress in addressingtranscription errors, outliers and missing values.” (Appendix B). Major accomplishments since the first report(January 2011), include a presentation to NIFA staff on April 7, 2011 and a program review by the FAEISStatistical Expert Panel on April 8th in Washington, DC. The FAEIS team prepared extensive notebooks forpanelists and NIFA representatives, distributed prior to the Panel meeting. Please consider both the FAEISStatistical Expert Panel notebook and this subsequent report as our second quarterly progress report.In this report, we present three statistical methods to identify outliers and compare these to the boxplot methodpresented in the first quarterly report. Results show that these three methods—natural standard deviation, pseudostandard deviation, and Lag1 difference—are more sensitive than the boxplot method for identifying outliers.Also, we hired one additional statistical graduate student to assist in our statistical efforts (Appendix A).This report also compares FAEIS to the Integrated Postsecondary Education Data System (IPEDS). APowerPoint presentation given by Dr. Eric Vance at the Statistical Expert Panel meeting is included asAppendix C. Results show that overall, FAEIS data provide users greater specificity by collecting all data usingClassification of Instructional Programs (CIP) codes. In contrast, IPEDS only provides CIP code breakdown inits degrees awarded survey. This is important since data analyses can be disaggregated at the degree/disciplinelevel using CIP codes with FAEIS. Here is a brief summary that addresses each of the items mentioned in theRFA:RFATimeline for DeliverablesItems3Creation of SAS dataset and report verification10/20102,5Identification of outliers and missing data04/20109Statistical update quarterly report01/20112,5Improvement of Identification of outliers04/20102Comparisons of IPEDS and FAEIS04/20111,6Statistical Expert Panel meeting04/20119Statistical update quarterly report05/20112Identification of redundant entries and miscoded CIP codes06/20112Automated identification of problematic data06/2011Non-Universal database problem07/2011Thank you and please contact us if you have any questions on this second quarterly report.Sincerely,Mary A. Marchant, Ph.D.FAEIS Principal Director
Progress on the Statistical Analysis of FAEIS Data Quality—Second Quarterly Report—May 11, 2011Food and Agricultural Education Information edu540-231-4941Mary Marchant, Ph.D., FAEIS Principal InvestigatorAgriculture and Applied Economics Department, Virginia TechTimothy Mack, Ph.D., FAEIS Co-Principal InvestigatorSchool of Graduate Studies and Research, Indiana University of PennsylvaniaEric Smith, Ph.D., FAEIS Co-Principal InvestigatorStatistics Department, Virginia TechBill Richardson, FAEIS Project ManagerAgriculture, Human and Natural Resources Information Technology (AHNR-IT),Virginia TechEric Vance, Ph.D., FAEIS Statistical Project Manager and LISA DirectorLISA (Laboratory for Interdisciplinary Statistical Analysis) and Statistics Department,Virginia TechAlbert Shen, Ph.D., FAEIS Statistical Graduate Research Assistant (GRA)Statistics Department, Virginia TechKatie Griffin, FAEIS Graduate Research AssistantStatistics Department, Virginia TechAshley Bell, FAEIS Graduate Research AssistantDairy Science Department, Virginia TechLisa Hightower, FAEIS Graduate Research AssistantAgricultural and Extension Education Department, Virginia Tech
Progress on the Statistical Analysis of FAEIS Data Quality—Second Quarterly Report—IntroductionThis is the second in a series of quarterly reports from the Food and Agricultural EducationSystem (FAEIS) to the U.S. Department of Agriculture-National Institute of Food andAgriculture (USDA-NIFA), in response to item #9 in the FAEIS RFA (see Appendix B) whichstates: “Produce quarterly reports on the progress in addressing transcription errors, outliersand missing values. Include statistical procedures used to correct and process FAEIS data.”SummaryIn the first progress report, the FAEIS Team explored the use of the boxplot method toidentify outliers. In this second report, we explore three additional methods and compare themto the earlier boxplot method. These three methods include: natural standard deviation (NSD),pseudo standard deviation (PSD), and Lag1 difference. Results show that these threemethods are more sensitive than the boxplot method for identifying outliers.On April 8, 2011, the FAEIS Statistical Expert Panel met in Washington, DC in response toitem #1 of the FAEIS RFA. Prior to the meeting FAEIS staff prepared and sent notebooks topanel members and USDA-NIFA representatives. This progress report includes both thereport that follows, as well as the FAEIS Statistical Expert Panel notebook, previously sent toUSDA-NIFA.In this report we compare FAEIS to IPEDS (see section 3). Overall, FAEIS data arecollected with greater specificity by collecting all data using Classification of InstructionalPrograms (CIP) code classifications. In contrast, IPEDS only provides CIP code breakdown inits degrees awarded survey. Some of the additional major differences found between FAEISand IPEDS are as follows: FAEIS enrollment data have greater granularity, since data are collected annually byCIP code and thus is far more useful to make comparisons at the degree/disciplinelevel. In contrast IPEDS collects enrollment data every 2 years and for only 6aggregated fields of study at the undergraduate level and 9 aggregated fields of studyat the graduate level; none of the aggregated fields are related to Agriculture. FAEIS data are released 10 months before IPEDS data. FAEIS collects finer data on faculty, allowing average salary comparisons by discipline,rank, tenure status, contract length, gender and ethnicity. IPEDS only collects facultydata aggregated at the institution level. FAEIS reporting features are faster, more powerful and easier to use than IPEDS.
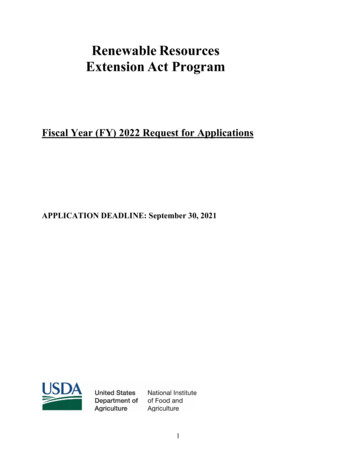
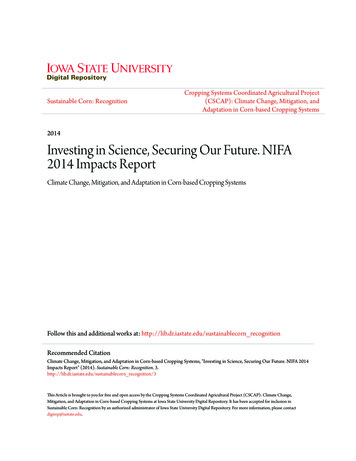
1. FAEIS has added additional statistical expertise(Refers to RFA item 2; see Appendix B)In January, FAEIS added a second Graduate Research Assistant (GRA) from the Statisticsdepartment, Katie Griffin, to the Help Desk team. As a graduate student pursuing a Mastersdegree in statistics, Katie brings in statistical expertise and part of her duty is to work on thecomparison of FAEIS data with the Integrated Postsecondary Education Data System (IPEDS)and other data sources. Some of the comparison results were presented at the FAEISStatistical Expert Panel on April 8, 2011, and received positive feedback. She joins FAEISTeam members Eric Smith, Eric Vance, and Albert Shen from the Virginia Tech StatisticsDepartment, also described on the first page of this report and in Appendix A.2. SAS algorithms have been improved to identify outliers(Refers to RFA items 2 & 5; see Appendix B)In the first quarterly progress report, we reported the development of boxplot and strip plotmethods to identify outliers in the FAEIS data. Boxplots and strip plots provide limitedinformation when the sample size is small. In the FAEIS data, the boxplots are based on onlyup to six data points. Therefore, in this quarter we developed three new methods to improvethe identification of outliers. We use Bachelor Enrollment in Food Science and Technology asan example to illustrate each method and to make comparisons.In the boxplot (Figure 1; top), we should pay attention to two features of the display. Thefirst feature is the outliers, which are labeled as red circles with the values (enrollment) to theright. The second feature is the tall boxes, which indicate large variation of the data between2004 and 2009. To take a closer look at the variations in the data, the strip plot is very helpful.In the strip plot (Figure 1; bottom), the enrollment for each year is plotted as a dot. Clustersof dots will reflect small variation and a small box in the boxplot. On the other hand, if the dotsare widely scattered, there is large variation and a large box is formed in the boxplot. Anotherissue to explore from the strip plot is the “trend” of enrollment when the variation is large. Ifthere is an obvious trend (increase or decrease) of enrollment with year, the data is morereliable. On the other hand, if there is no obvious trend for the large variation, the data may bequestionable and would be flagged for further investigation.The first new method uses the ordinary or natural standard deviation (NSD) derived fromthe FAEIS data. First, we create groups (small, medium, large, and extra large) based on theenrollment size. We then calculate the standard deviation for each group in the sameacademic area. The outliers are flagged for the observations that are outside two or threestandard deviation from the mean. An example using this method is shown below (Figure 2;top). Six observations are identified as outliers, three of them (151, 238, 40) are outside two1
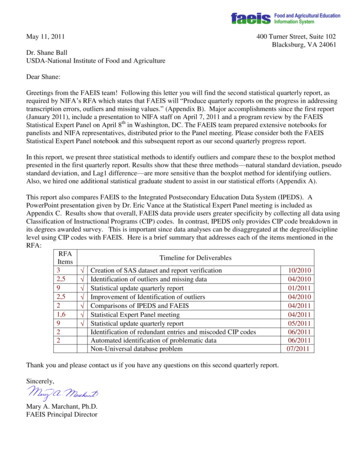
standard deviations from the mean and the other three (16, 163, 5) outside three standarddeviations. When compared to the boxplot method, the NSD method identified fewer outliers(8 from boxplot vs. 6 from NSD). Four (151, 16, 40, 5) of the six observations identified by theNSD method are also identified by the boxplot method. The NSD method is more sensitive tothe observations that stretch over a wide range (i.e. the long boxes in the boxplot) and lesssensitive to the observations that stretch over a narrow range, i.e. the short boxes, than theboxplot method. Overall, the NSD method is better than the boxplot method.The new second method uses the pseudo standard deviation (PSD) based oninterquartile range (IQR). Again we first create groups based on the enrollment size. We thenobtain the IQR, the distance between the 75th percentile and the 25th percentile, for eachgroup in the same academic area. The pseudo standard deviation is calculated as IQR/1.35.The outliers are flagged for the observations that are outside two or four PSD from themedian, which is equivalent to 1.5 or 3 IQR from the median. An example using this method isshown below (Figure 2; bottom). The identified outliers are almost identical to those using theNSD method. One observation (61) identified using the PSD method is not identified using theNSD method. Therefore, the PSD method can be used as the supplementary method to theNSD method.The third new method looks for an odd change in the data pattern (the Lag1Difference). The Lag1 difference plot is the plot of the difference between enrollments inadjacent years. The difference between one year and the next year is calculated. Then thestandard deviations of the differences are calculated using the same approach as in theregular calculations. Again, an ordinary standard deviation may be calculated or one that isrobust to outliers based on the interquartile range may be used. The odd values that areidentified in the two plots are the same values. However, in the first plot we note that somevalues that are in the middle of the total enrollment plot (Figure 3; top) do not appear to beoutliers. When displayed in the difference plot (Figure 3; bottom) we note that they areextreme. For example, compare Oregon State University in both plots. The middle value in thefirst plot appears extreme in the second plot.2
200100Total EnrollmentBoxplot of Enrollment by InstitutionBaccalaureate Enrollment in Food Science and Technology300Strip Plot of Enrollment by InstitutionFigure 1. Boxplot and Strip Plot for Identifying Data QualityWashington State UniversityInstitutionVirginia Polytechnic Institute aUniversity of Wisconsin- MadisonUniversity of Wisconsin - RiverUniversity of VermontUniversity of TennesseeUniversity of Nebraska- LincolnUniversity of MissouriUniversity of Minnesota, St. PauUniversity of MassachusettsUniversity of MarylandUniversity of KentuckyUniversity of Illinois at UrbanaUniversity of IdahoUniversity of GeorgiaUniversity of FloridaUniversity of DelawareUniversity of California, DavisUniversity of ArkansasThe Pennsylvania State UniversitThe Ohio State UniversityTexas Tech UniversityTexas A&M UniversityTennessee State UniversitySouthwest Minnesota State UniverSouthern University and AgricultSouthern Illinois University-CarRutgers University- New BrunswicPurdue UniversityOregon State UniversityOklahoma State UniversityNorth Dakota State UniversityNorth Carolina State UniversityMississippi State UniversityMichigan State UniversityLouisiana State UniversityKansas State UniversityIowa State UniversityFramingham State CollegeFlorida A and M UniversityDelaware Valley CollegeCornell UniversityClemson UniversityCalifornia State University - LoCalifornia State University - FrCalifornia State Polytechnic UniAlabama Agricultural and Mechani3200920082007200620052004Year0
Outliers of Enrollment by Institution Using Natural Standard DeviationOutliers of Enrollment by Institution Using Inter Quartile RangeFigure 2. Plots for Identifying Data Quality4
605040302010-100-20Difference in Total EnrollmentOutliers of Enrollment by Institution Using Lag1 Difference90Baccalaureate Enrollment in Food Science and TechnologyNormalOutlier 1.5lagOutlier 3lag8070-30-40-50Plot of Difference in Enrollment by Institution Using Lag1 DifferenceWashington State UniversityVirginia Polytechnic Institute aUniversity of Wisconsin- MadisonUniversity of Wisconsin - RiverUniversity of VermontUniversity of TennesseeFigure 3. Plots for Identifying Data QualityUniversity of Nebraska- LincolnUniversity of MissouriUniversity of Minnesota, St. PauUniversity of MassachusettsUniversity of MarylandUniversity of KentuckyUniversity of Illinois at UrbanaUniversity of IdahoUniversity of GeorgiaUniversity of FloridaUniversity of DelawareUniversity of California, DavisUniversity of ArkansasThe Pennsylvania State UniversitThe Ohio State University5Texas Tech UniversityTexas A&M UniversityTennessee State UniversitySouthwest Minnesota State UniverSouthern University and AgricultSouthern Illinois University-CarRutgers University- New BrunswicPurdue UniversityOregon State UniversityOklahoma State UniversityNorth Dakota State UniversityNorth Carolina State UniversityMississippi State UniversityMichigan State UniversityLouisiana State UniversityKansas State UniversityIowa State UniversityFramingham State CollegeFlorida A and M UniversityDelaware Valley CollegeCornell UniversityClemson UniversityCalifornia State University - LoCalifornia State University - FrCalifornia State Polytechnic UniAlabama Agricultural and MechaniInstitution
3. Comparisons of FAEIS and IPEDS(Refers to RFA item 2; see Appendix B)In March 2011, FAEIS began a project to provide a detailed comparison of FAEIS to IPEDSand other comparable databases, such as the Survey of Earned Doctorates (SED) containingstudent and faculty information at the national level. A PowerPoint presentation on this subjectwas given by Dr. Eric Vance at the Statistical Expert Panel meeting on April 8, 2011 and isincluded in this report as Appendix C.The FAEIS database system has been compared to the Integrated PostsecondaryEducation Data System (IPEDS). IPEDS collects data in seven areas that include institutionalcharacteristics, institutional prices, enrollment, student financial aid, degrees and certificatesconferred, student persistence and success, and institutional resources. FAEIS and IPEDScan be compared on three of these main areas: enrollment, degrees and certificatesconferred, and institutional resources.Table 1 compares FAEIS and IPEDS data sources. In making comparisons across allcategories, it is important to note that FAEIS always collects and reports all data by CIPcodes, while IPEDS collects only degrees awarded by CIP codes. This provides a greaterlevel of specificity for FAEIS data. For example, FAEIS collects detailed annual data forstudent enrollment and faculty while IPEDS does not.Table 1FAEISIPEDSYesYesGenderRace/EthnicityDegree levelGenderRace/EthnicityDegree levelYesYesYesYes (instructional only)- every year by CIP codesYesNo- every year bydemographic variablesRace/EthnicityTenure StatusAgeGenderAcademic rankContract lengthGenderAcademic rankContract lengthYesYesDegrees Awarded- every year bydemographic variables- every year by CIP codesFaculty- every year by average salary6
Table 1-Continued:Fall enrollmentYesYes*GenderEthnicityGenderEthnicity- every year by CIP codesYesNo- every year by degreelevel (AA, BS, MS, PHD)YesNo (graduate &undergraduate totals only)NoYes- every year bydemographic variables--Yes- every year by CIP codes--No- every year bydemographic variablesAcademic year enrollmentFor enrollment, both databases collect data every year by the demographic variablesof race/ethnicity and gender. IPEDS also collects fall enrollment data by level of study, whichindicates whether a student is an undergraduate or graduate. FAEIS collects these data in farmore detail, subdividing enrollment by Associates, Bachelors, Masters, and Doctorateprograms. But the biggest difference between the two databases’ fall enrollment data is thatFAEIS collects fall undergraduate and graduate enrollment data by CIP code every year,whereas IPEDS collects these data every two years aggregated by six fields of study atthe undergraduate level and nine fields of study at the graduate level.IPEDS and FAEIS contain comparable data for degrees awarded, referred to in IPEDSas degrees and certificates conferred or completions. FAEIS and IPEDS both use thedemographic variables of race/ethnicity and gender for this survey. Also, both are collected atthe degree level. For these data IPEDS collects completions by CIP codes, as does FAEIS.Essentially, the types of data included in these surveys appear to be identical between FAEISand IPEDS. However, upon further investigation when producing reports from both systems,more often than not there are inconsistencies among the number of degrees awarded. Thiscould be due to the fact that data come from different sources for the two database systems.The data in FAEIS are reported by individuals within the appropriate college or departmentwhere the degree was completed within the institution; thus closer to the source. Whereas,IPEDS data come from a central source for each institution, usually institutional research (IR)or comparable office. Also important to note is that reporting to IPEDS is required by allinstitutions participating in student financial aid programs from the government, whereasreporting to FAEIS is voluntary.7
Finally, for faculty numbers and salaries, within the IPEDS survey of institutionalresources there is a component called human resources, which covers headcount and salaryof all institutional staff members, including faculty; thus it can be compared to the facultysurvey in FAEIS. As with other IPEDS data, faculty data are not collected by CIP code, butrather at the institution level. Both systems collect academic rank, contract length, tenurestatus, gender, and race/ethnicity for faculty. Another difference is that IPEDS can only reportfaculty salary data by race/ethnicity for salary ranges, not by average salary. However, FAEIScan report average faculty salary by race/ethnicity. Furthermore, FAEIS collects all faculty databy CIP codes, whereas IPEDS collects faculty data by entire institution. Thus, FAEIS canspecify faculty salaries for specific disciplines by gender, ethnicity and rank, whileIPEDS reports faculty salary at the institution level by gender and rank with ethnicityreported in salary ranges.SummaryFAEIS always collects and reports all data by CIP codes, while IPEDS collects onlydegrees awarded by CIP codes.IPEDS does not collect fall enrollment data for individual CIPs or degree areas. In oddnumbered years, IPEDS collects fall enrollment on six major fields of study forundergraduates and three major fields of study for graduates. None of the fields ofstudy are related to agriculture.FAEIS salary data are collected with greater specificity. FAEIS data providesinformation on average salaries by gender and race/ethnicity by CIP codes.FAEIS reporting is both easier for users and more powerful than IPEDS. IPEDSrequires more steps than FAEIS to generate even the simplest reports. IPEDS can notreport across years, so multiple reports must be generated and combined externally.IPEDS does not generate multi-dimensional reports, and does not generate finishedreports, only extracted data, which needs editing to eliminate unwanted columns.4. Statistical Expert Panel Meeting(Refers to RFA item 1; see Appendix B)The FAEIS Statistical Expert Panel meeting was held on April 8th, 2011 in Washington, DC,consisting of the following panel members:Dr. Ali I Mohamed, Panel ChairDirector, Division of Environmental SystemsU.S. Department of AgricultureNational Institute of Food and Agriculture8
Mr. Jim AlessioDirector, State Council of Higher Education for VirginiaDr. Ken EsbenshadeAssociate Dean and Director of Academic ProgramsCollege of Agriculture and Life SciencesNorth Carolina State UniversityDr. Nagaraj NeerchalChair, Math and Stat DepartmentDepartment of Mathematics & StatisticsUniversity of Maryland, Baltimore CountyMs. Sabrina RatchfordStatistician, Postsecondary, Adult and Career EducationU.S. Department of Education, NCESDr. Nicole SmithResearch Professor and EconomistCenter on Education and the WorkforceGeorgetown UniversityThe meeting began at 9:00am with a brief introduction from Dr. Frank Boteler, USDA-NIFA.The report and recommendations from the Statistics Expert panel are forthcoming and will beaddressed in the next edition of this report.5. Future Work(Refers to RFA items 1, 2B, 6; see Appendix B)In the subsequent quarters, the following will be enacted:1. SAS algorithms to identify redundant/repeated data entries and miscoded CIP codes –Redundant or repeated data entries have been found in the FAEIS data, as well asmiscoded CIP codes. These types of data errors are not easily identified manually.Redundant data often occur when the same information was entered multiple timesusing different FAEIS accounts. Often these data appear to be outliers whencompared to other years. A SAS algorithm is being developed to identify the redundantdata by searching for multiple accounts and for outliers. Misplaced CIP codes oftenhave the feature of missing data for a certain CIP code in certain years when the datais placed in another similar CIP code. A SAS algorithm is being developed to identifythe misplaced CIP codes by matching the CIP codes with missing data.9
2. Automated identification of invalid/problematic data –Once the identification of erroneous data with SAS is fully developed and tested, it willbe automated with Microsoft Task Manager on a daily or semi-weekly basis. Thedetected erroneous data will be sent by e-mail to the graduate research assistants atthe FAEIS help desk for further investigation. The FAEIS GRAs will follow up with thecorresponding institution representatives. This will be a routine data quality assuranceprocedure. We have achieved some success in the preliminary tests and are in theprocess of improving the formats and results.3. Responses to suggestions from the Statistical Expert Panel.4. Further comparisons of FAEIS with IPEDS and other national databases.5. Expanded use of data mining and direct contacts with Institutional Research offices forobtaining data for institutions with missing data.RFAItems32,592,521,6922Timeline for DeliverablesCreation of SAS dataset and report verificationIdentification of outliers and missing dataStatistical update quarterly reportImprovement of Identification of outliersComparisons of IPEDS and FAEISStatistical Expert Panel meetingStatistical update quarterly reportIdentification of redundant entries & miscoded CIP codesAutomated identification of problematic dataNon-Universal database 105/201106/201106/201107/2011
Appendix A—FAEIS TEAM MEMBERSFAEIS Help Desk StaffBill Richardson: FAEIS Project ManagerBill Richardson received a Bachelor of Science in Forestry at Virginia Tech in1976. He began working at Virginia Tech in 1983 and in 1993 in Agriculture,Human and Natural Resources Information Technology in the College ofAgriculture and Life Sciences. He has been with the FAEIS project since itcame to Virginia Tech in 2001, starting as the lead programmer and lateradding the dual role of project manager.Dr. Jolene Hamm: FAEIS Consultant / Former Help Desk ManagerJolene Hamm completed her PhD in Agricultural Education and Extension atVirginia Tech in December 2010. She worked as the FAEIS Help DeskManager and a graduate research assistant for nearly three years prior tograduation. Dr. Hamm has authored a series of refereed journal articles,including one on FAEIS. Dr. Hamm is currently working at the Office ofInstitutional Research and Effectiveness at Ferrum College in Virginia.Albert Shen: FAEIS Statistics Graduate Research AssistantAlbert Shen received a Bachelor of Science in physics at National Tsing-HuaUniversity in Taiwan. He received a Masters degree in statistics from ColumbiaUniversity. He completed a doctorate in biophysics from the University ofVirginia. He is currently working toward a doctorate in the StatisticsDepartment at Virginia Tech.Katie Griffin: FAEIS Statistics Graduate Research AssistantKatie Griffin received a Bachelor of Science in Mathematical Sciences fromLoyola University Maryland. She is currently completing her Masters degree inthe Statistics Department at Virginia Tech.Lisa Hightower: FAEIS Help Desk Graduate Research AssistantLisa Hightower received a Bachelor of Science in Journalism and minored invideo production and a Masters degree in agricultural communication at theUniversity of Florida. She is currently completing a doctorate degree in theAgricultural Education and Extension Department at Virginia Tech.Ashley Bell: FAEIS Help Desk Graduate Research AssistantAshley Bell received a Bachelor of Science in Animal and Poultry Sciencesand minored in Biology at Virginia Tech. She is currently working on a Mastersdegree in the Dairy Science Department at Virginia Tech.11
FAEIS Principal InvestigatorsDr. Mary Marchant: Principal InvestigatorDr. Mary Marchant obtained all of her advanced degrees at theUniversity of California Davis. Upon graduating with a PhD inagricultural economics, she joined the University of Kentucky faculty,where she worked for 17 years. Dr. Marchant joined Virginia Tech (VT)as Associate Dean and Director of Academic Programs for the Collegeof Agriculture and Life Sciences in April 2006 and recently joined the VTfaculty in the Department of Agriculture and Applied Economics.Dr. Tim Mack: Co-Principal InvestigatorDr. Tim Mack is the dean of the School of Graduate Studies andResearch at Indiana University of Pennsylvania (IUP). Mack came toIUP from Georgia Southern University, where he was the Dean of theJack N. Averitt College of Graduate Studies. Previous to that position,he worked at Virginia Tech, serving for three years as Associate Deanfor Information Technology and Distance Education in the College ofAgriculture and Life Sciences. Dr. Mack was instrumental in bringingFAIES to VT and served as the original principal investigator.Dr. Eric Smith: Co-Principal InvestigatorDr. Eric P. Smith has been a member of the Statistics Department atVirginia Tech faculty since 1982 and chair of the department since2006. His research focuses on the development and application ofstatistical methods to help understand and solve environmental andecological problems. He was the director of the Statistical ConsultingCenter 1995-2004.Dr. Eric Vance: Statistical Project ManagerDr. Eric Vance is an Assistant Research Professor in the Department ofStatistics at Virginia Tech. He received his MS in statistics and decisionsciences from the Institute of Statistics and Decision Sciences at DukeUniversity and his PhD in Statistical Science from the Department ofStatistical Science at Duke University. He has more than 7 years ofexperience contributing statistical expertise to interdisciplinary researchprojects. Since 2008, he has been the director of the Laboratory forInterdisciplinary Statistical Analysis (LISA).12
Appendix B--USDA-NIFA 2010-2011 RFA--Final Year of ContractNIFA calls for significant advanced expertise, detailed reporting andcommunications:1. Because FAEIS is a national database, it is expected that data management andanalyses must be reviewed by an external expert panel. The expert panel willdetermine the limitations of FAEIS data, proper interpretation and analyses of data froma voluntary data submission process, which is an unreliable data collection source.2. Data and data analyses must be the products of significant statistical expertise thatreflects standards for survey data management, analyses, and interpretation.Transcription errors will be corrected by implementing quality control procedures beforethe statistical analyses are performed. Methods to accomplish this include:a. Proofing data visually in column by row format (Excel or SAS file) by FAEISemployees. In addition, use exploratory data analyses as an additional quality checkand test the assumptions.b. Systematic testing of data to determine its data accuracy to a “gold-standard”database – which is the IPEDs database.c. Outlier tests to highlight abnormal values and eliminate them before other statisticsare calculated. Also, remove any redundancy and “orphan records” from thedatabase. Applicant should use appropriate statistical outlier tests to determine ifdata are wrong and ca
required by NIFA's RFA which states that FAEIS will "Produce quarterly reports on the progress in addressing transcription errors, outliers and missing values." (Appendix B). Major accomplishments since the first report (January 2011), include a presentation to NIFA staff on April 7, 2011 and a program review by the FAEIS