Transcription
U.S. Department Of TransportationNational Highway Traffic Safety AdministrationPreliminary Regulatory Impact Analysis:Proposed Rulemaking for Model Years 2024-2026 LightDuty Vehicle Corporate Average Fuel Economy StandardsAugust 2021
1. IntroductionThis Preliminary Regulatory Impact Analysis (PRIA) has been prepared to assess the potentialand anticipated consequences of proposed and alternative Corporate Average Fuel Economy(CAFE) standards for passenger cars and light trucks for model years (MY) 2024-2026.Regulatory analysis is a tool used to anticipate and evaluate likely consequences of rules. Itprovides a formal way of organizing the evidence on the key effects, positive and negative, of thevarious alternatives that are considered in developing regulations. The goal of this PRIA is toconsolidate that evidence to help inform decision-makers of the potential consequences ofchoosing among the considered regulatory paths.NHTSA is required by law to take regulatory action and does not have the discretion not to setstandards. NHTSA is required to set CAFE standards by the Energy Policy and ConservationAct of 1975 (EPCA), as amended by the Energy Independence and Security Act of 2007 (EISA).CAFE standards must be set (or amended, if the amendment is to result in higher stringency) atleast 18 months prior to the beginning of the model year; must be set separately for each modelyear and for passenger cars and light trucks; must be “attribute-based and defined by amathematical function;” and must be set at the maximum feasible level that NHTSA determinesmanufacturers can reach for that fleet in that model year, among other requirements. 1This assessment examines the costs and benefits of proposed and alternative CAFE standardslevels for passenger cars and light trucks for MYs 2024 through 2026. In this proposal, NHTSAis revisiting existing CAFE standards that were finalized in 2020, as directed by Executive Order13990. This action today is taken and under the agency’s statutory authority. This assessmentexamines the costs and benefits of setting fuel economy standards for passenger cars and lighttrucks that change at a variety of different rates during those model years. 2 It includes adiscussion of the technologies that can improve fuel economy (and reduce carbon dioxideemissions), as well as analysis of the potential impacts on vehicle retail prices, lifetime fuelsavings and their value to consumers, and other societal effects such as energy security, changesin pollutant emissions levels, and safety. 3 Estimating impacts also involves consideration ofconsumers’ responses to standards – for example, whether and how changes in vehicle prices asa result of changes in CAFE standards could affect sales of new and used vehicles.As explained above, EISA requires NHTSA to set attribute-based CAFE standards that are basedon a mathematical function. The mathematical function or “curve” representing the standards isa constrained linear function that provides a separate fuel economy target for each vehiclefootprint, and there are separate curves for cars and for trucks. Vehicle footprint has been usedas the relevant attribute for the curves since MY 2011. Under all of the regulatory alternatives,the standards would become more stringent for each model year from 2024 to 2026, relative toSee 49 U.S.C. Section 32902 and Section VI of the preamble that this PRIA accompanies for more information.Throughout this PRIA, cost and benefit analyses are presented for individual model years as well as the cumulativetotal for all model years through MY 2029, although some physical effects are presented on a calendar year basisinstead, as appropriate.3This analysis does not contain NHTSA’s assessment of the potential environmental impacts of the proposed rulefor purposes of the National Environmental Policy Act (NEPA), 42 U.S.C. 4321-4347, which is contained in theagency’s Supplemental Environmental Impact Statement (SEIS) accompanying the proposal.12
the MY 2023 standards. Generally, the larger the vehicle footprint, the less numerically stringentthe corresponding vehicle mpg target, except at the largest and smallest footprint sizes wheretargets are flat across footprint sizes. With footprint-based standards, the burden of complianceis theoretically distributed across all vehicle footprints and across all manufacturers. Eachmanufacturer is subject to individualized standards for passenger cars and light trucks, in eachmodel year, based on the vehicles it produces.We constructed an analysis fleet representing the entire light-duty fleet in detail as a startingpoint to evaluate the costs and benefits of the rule, against which we simulate manufacturers’year-by-year response through Model Year 2050 4 to standards defining each regulatoryalternative. The analysis fleet is comprised of the best information available as of early 2021regarding the Model Year 2020 fleet, and, for each of 3,627 specific model/configurations,contains information such as production volumes, fuel economy ratings, dimensions (footprint),curb weight and GVWR, engine characteristics, transmission characteristics, and other keyengineering information. For each regulatory alternative, we used the CAFE Model to simulatemanufacturers’ year-by-year application of technology that improves fuel economy, assumingthat manufacturers would respond not only to the year-by-year standards defining the regulatoryalternative, but also to a baseline consisting of the CAFE standards finalized in 2020,California’s ZEV program, EPA’s baseline (i.e., those finalized in 2020) fleetwide GHGstandards, the “Framework Agreements” made between California and 5 major manufacturers,and buyers’ willingness to pay for a portion of the fuel savings expected to occur over vehicles’lifetimes.Although NHTSA and EPA took separate actions in this round of rulemaking for a variety ofreasons, NHTSA sought to coordinate its action with EPA’s to the greatest extent possible givenour statutory and programmatic differences. To NHTSA’s knowledge, the proposed CAFE andGHG standards for MY 2026 represent roughly equivalent levels of stringency and may serve asa coordinated starting point for subsequent standards. While the proposed CAFE and GHGstandards for MYs 2024-2026 are different, this is largely due to the difference in the “start year”for the revised regulations – EPA is proposing to revise standards for MY 2023, while EPCA’slead time requirements prevent NHTSA from proposing revised standards until MY 2024. Thedifferences in what the two agencies’ standards require become smaller each year, untilalignment is achieved.While NHTSA’s and EPA’s programs differ in certain other respects, like programmaticflexibilities, those differences are not new in this proposal. Some parts of the programs areharmonized, and others differ, often as a result of statute. Since NHTSA and EPA beganregulating together under President Obama, differences in programmatic flexibilities have meantthat manufacturers have had (and will have) to plan their compliance strategies considering boththe NHTSA standards and the EPA standards and assure that they are in compliance with both,but they can still build a single fleet of vehicles to accomplish that goal. NHTSA is proposingCAFE standards that increase at 8 percent per year over MYs 2024-2026 because that is whatAs in prior analyses, today’s analysis exercises the CAFE Model using inputs that extend the explicit compliancesimulation through MY 2050 – many years beyond the last year for which we propose to issue revised standards.This has been done because interactions between the new and used vehicles markets impact benefits and costs overthe lives of vehicles produced in the rulemaking timeframe.4
NHTSA has tentatively concluded is maximum feasible in those model years, under the EPCAfactors, and is confident that industry would still be able to build a single fleet of vehicles tomeet both the NHTSA and EPA standards. For purposes of this PRIA, we have only attemptedto report costs and benefits for the proposed NHTSA CAFE standards, and not also EPA’sproposed standards. We refer readers to EPA’s documents for more information about theirproposal and its effects, and note that costs and benefits of the two programs will largely overlap,since manufacturers will take many actions that respond to both programs simultaneously.EPCA, as amended by EISA, contains a number of provisions governing how NHTSA must setCAFE standards. EPCA requires that CAFE standards be set separately for passenger cars andlight trucks 5 at the “maximum feasible average fuel economy level that the Secretary decides themanufacturers can achieve in that model year,” 6 based on the agency’s consideration of fourstatutory factors: technological feasibility, economic practicability, the effect of other standardsof the Government on fuel economy, and the need of the United States to conserve energy. 7EPCA does not define these terms or specify what weight to give each concern in balancing them– such considerations are left within the discretion of the Secretary of Transportation (delegatedto NHTSA) based upon current information. Accordingly, NHTSA interprets these factors anddetermines the appropriate weighting that leads to the maximum feasible standards given thecircumstances present at the time of promulgating each CAFE standard rulemaking.As stated above, NHTSA is proposing standards for passenger cars and light trucks that theagency tentatively concludes represent maximum feasible CAFE standards for MYs 2024-2026,pursuant to its statutory authority. While the actual standards being proposed are footprint-basedtarget curves, NHTSA estimates that the proposed standards would require, on an averageindustry fleet-wide basis, roughly 48 miles per gallon (mpg) in Model Year 2029.NHTSA projects that under these proposed standards, required technology costs would increaseby 79.6 billion over the lifetimes of vehicles through MY 2029. If those costs are passed on toconsumers as average increases in MSRP, we estimate that per-vehicle costs paid by U.S.consumers for new vehicles would increase by roughly 1,000, on average, as compared to if thebaseline standards were retained; but concurrently, fuel savings for those vehicles would increasesignificantly, by roughly 1,200, undiscounted, on average. Overall total discounted benefitsattributable to the proposal vary from 121 billion at a 3 percent discount rate (2.5 percentdiscount rate for social cost of greenhouse gas) to 76 billion at a 7 percent discount rate (3percent discount rate for social cost of greenhouse gas) 8. Total discounted benefits are 110.549 U.S.C. 32902(b)(1).49 U.S.C. 32902(a).749 U.S.C. 32902(f).8Climate benefits are based on changes (reductions) in CO2, CH4, and N2O emissions and are calculated using fourdifferent estimates of the social cost of carbon (SC-CO2), methane (SC-CH4), and nitrous oxide (SC-N2O) (modelaverage at 2.5 percent, 3 percent, and 5 percent discount rates; 95th percentile at 3 percent discount rate). Weemphasize the importance and value of considering the benefits calculated using all four estimates. We show twoprimary estimates for climate benefits in this rule for presentational purposes (model average at 2.5 and 3 percentdiscount rates). The full range of climate benefits is shown in Chapter 7 of the PRIA. As discussed in the TechnicalSupport Document: Social Cost of Carbon, Methane, and Nitrous Oxide Interim Estimates under Executive Order13990 (IWG 2021), a consideration of climate benefits calculated using discount rates below 3 percent, including 2percent and lower, are also warranted when discounting intergenerational impacts.56
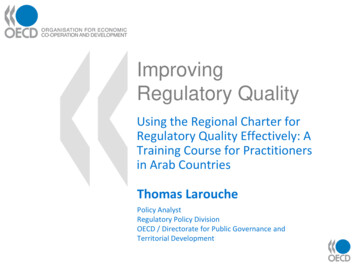
billion at a 3 percent discount rate (3 percent discount rate for the social cost of greenhouse). Itis important to stress that these estimates could change – sometimes dramatically – with differentassumptions. For example, if estimates of future fuel prices or the social cost of greenhouse gasare too low, corresponding input revisions could significantly increase net benefits. Similarly, ifNHTSA’s assumption about a rebound effect of 0.15 is too high, net benefits will increase,whereas if it is too low, net benefits would decrease. And NHTSA’s assumption that vehiclesales will decline because consumers may only value 30 months of fuel savings produces slightincreases in costs associated with safety. If that assumption is incorrect, net benefits outweighcosts by a somewhat larger margin. It is also worth stressing that, while net benefits areestimated to be higher under less stringent alternatives, NHTSA believes for purposes of thisproposal that the maximum feasible standards are not likely to be ones that leave benefits on thetable, as discussed in more detail in Section VI of the accompanying NPRM preamble.The results of this analysis are set forth in the rest of this document that follows. Note that forreaders seeking to compare these results to those set forth in the 2020 final rule andaccompanying documentation, not only have many inputs and modeling approaches changedsince that rulemaking, but also the directionality of many outputs may appear different, becausein today’s action we are proposing to raise CAFE stringency from a baseline rather thandecrease it.Table 1-1 – Estimated Present Value of Benefits and Costs of Preferred Alternative for Model Years 2023through 2026, 3% Discount Rate for All Costs and Benefits Besides GHGs (2.5% discount rate for ClimateBenefits) (billions in 2018 ) 9MYCostBenefitNet Benefits2023 5.6 3.5- 2.12024 8.9 13.6 4.72025 10.7 21.2 10.52026 12.2 27.5 15.3Sum 37.4 65.8 28.4NHTSA and EPA estimate benefits, costs, and net benefits using similar methodologies andachieve similar results, however different accounting approaches may give the false appearanceof significant divergences. Table 1-1 presents NHTSA’s results using comparable accounting toEPA’s preamble Table 5. EPA also presents cost and benefit information in its RIA overcalendar years 2021 through 2050. The numbers most comparable to those presented in EPA’sRIA are those NHTSA developed to complete its Environmental Impact Statement (EIS) usingClimate benefits are based on changes (reductions) in CO2, CH4, and N2O emissions and are calculated using fourdifferent estimates of the social cost of carbon (SC-CO2), methane (SC-CH4), and nitrous oxide (SC-N2O) (modelaverage at 2.5 percent, 3 percent, and 5 percent discount rates; 95th percentile at 3 percent discount rate). Weemphasize the importance and value of considering the benefits calculated using all four estimates. We show oneprimary estimate in this table for climate benefits for presentational purposes (model average at 2.5 percent discountrate). The full range of climate benefits is shown in Chapter 7 of the PRIA. As discussed in the Technical SupportDocument: Social Cost of Carbon, Methane, and Nitrous Oxide Interim Estimates under Executive Order 13990(IWG 2021), a consideration of climate benefits calculated using discount rates below 3 percent, including 2 percentand lower, are also warranted when discounting intergenerational impacts.9
an identical accounting approach. This is because the EIS analysis is not constrained byNHTSA’s statutory limitations, such as those in 49 U.S.C. 32902(h) prohibiting consideration offull vehicle electrification during the rulemaking timeframe, or consideration of the trading ortransferring of overcompliance credits. 10 NHTSA’s EIS analysis estimates 312 billion in costs, 443 billion in benefits, and 132 billion in net benefits using a 3% discount rate over calendaryears 2021 through 2050 (2.5% discount rate for climate benefits). 11,12 NHTSA describes itscost and benefit accounting approach in Section V of the NPRM.2. Baseline and Alternatives ConsideredAgencies typically consider regulatory alternatives in proposals as a way of evaluating thecomparative effects of different potential ways of accomplishing their desired goal. ExecutiveOrders 12866 and 13563, as well as OMB Circular A-4, encourage agencies to evaluateregulatory alternatives in their rulemaking analyses. 13 This does not amount to a requirementthat agencies evaluate the widest conceivable spectrum of alternatives. Rather, the range ofalternatives must be reasonable and consistent with the purpose and need of the action.Alternatives analysis begins with a “No-Action” alternative, typically described as what wouldoccur in the absence of any regulatory action. OMB Circular A-4 states that the “baseline shouldbe the best assessment of the way the world would look absent the proposed action. The choiceof an appropriate baseline may require consideration of a wide range of potential factors,including: evolution of the market, changes in external factors affecting expected benefits and costs, changes in regulations promulgated by the agency or other government entities, and the degree of compliance by regulated entities with other regulations. 14The No-Action Alternative for this proposal differs in a variety of ways from the No-ActionAlternative for the 2020 final rule. First, in the 2020 final rule, the No-Action AlternativeAs the EIS analysis contains information that NHTSA is statutorily prevented from considering, the agency doesnot rely on this analysis in regulatory decision-making.11See Chapter PRIA 6.5 for more information regarding NHTSA’s estimates of annual benefits and costs usingNHTSA’s standard setting analysis. See Tables B-7-25 through B-7-30 in Appendix II of the PRIA for a moredetailed breakdown of NHTSA EIS analysis.12See Draft Supplemental Environmental Impact Statement Docket No. NHTSA-2021-0054.13NEPA also requires agencies to compare the potential environmental impacts of their proposed actions to those ofa reasonable range of alternatives. Regulations regarding implementation of NEPA require agencies to “rigorouslyexplore and objectively evaluate all reasonable alternatives, and for alternatives which were eliminated from detailedstudy, briefly discuss the reasons for their having been eliminated.” 40 CFR 1502.14.14OMB Circular A-4, “General Issues, 2. Developing a Baseline.” Available rs a004 a-4/.10
represented the most stringent CAFE standards under consideration; in this proposal, the NoAction Alternative represents the least stringent CAFE standards under consideration. Thismeans that for readers seeking to compare results between this PRIA and the 2020 FinalRegulatory Impact Analysis (FRIA), most of the incremental effects shown in this PRIA are in adirection that is opposite those in the 2020 FRIA.Second, the No-Action Alternative in this proposal includes two elements (new to this rule) inthe baseline, in line with the Circular A-4 guidance noted above: NHTSA has included California’s ZEV mandate as part of the No-Action Alternative.NHTSA has already proposed to rescind the 2019 “SAFE I” rule, 15 and EPA hasreopened consideration of whether to grant California a waiver to consider its ZEVmandate. 16 Additionally, California reports that overcompliance with the ZEV mandatehas been widespread even under circumstances where California was not legallyenforcing the mandate, suggesting that vehicle manufacturers are seeking to meet itwhether or not a waiver of preemption is in place. It is therefore reasonably foreseeablethat manufacturers selling vehicles in California and in the Section 177 states will beproducing sufficient advanced technology vehicles at levels that would comply with theZEV mandate during the timeframe of this rulemaking. NHTSA has included the agreements made between California and BMW, Ford, Honda,VWA, and Volvo, because these agreements by their terms are legally binding contracts,even though they were entered into voluntarily. 17 NHTSA did so by including EPA’sbaseline GHG standards in its analysis, and introducing more stringent GHG targetfunctions during MYs 2022-2026, but treating only these five manufacturers as subject tothese more stringent target functions. Because a significant portion of the marketvoluntarily adopted the California framework, presumably because the manufacturerswho joined believed it could be met, and because that adoption is legally binding onceentered into, it is reasonable to assume that it will occur as expected during therulemaking timeframe, and thus, reasonable to include in the No-Action Alternative.Also, as in past analyses, NHTSA’s analysis further assumes that, beyond any technologyapplied in response to CAFE standards, EPA GHG standards, California/OEM agreements, andZEV mandates applicable in California and the Section 177 states, manufacturers could alsomake any additional fuel economy improvements estimated to reduce owners’ estimated averagefuel outlays during the first 30 months of vehicle operation by more than the estimated increasein new vehicle price.NHTSA accomplished much of this through expansion of the CAFE Model after the priorrulemaking. The previous version of the model had been extended to apply to GHG standards aswell as CAFE standards but had not been published in a form that simulated simultaneouscompliance with both sets of standards. As discussed at greater length in the current CAFE86 Fed. Reg. 25980 (May 12, 2021).86 Fed. Reg. 22421 (Apr. 28, 2021).17See lean-cars.1516
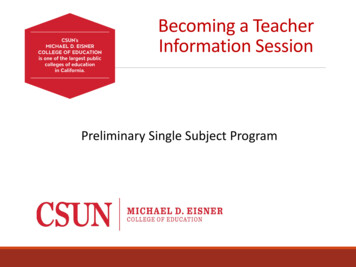
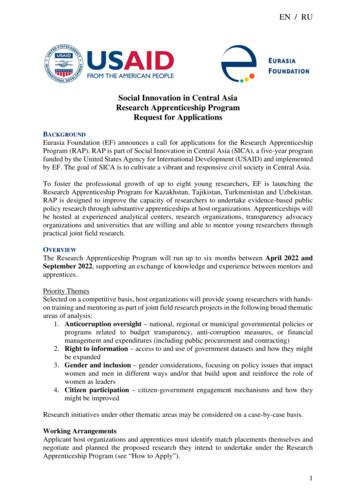
Model documentation, the updated version of the model simulates all the followingsimultaneously:1. Compliance with CAFE standards2. Compliance with GHG standards applicable to all manufacturers3. Compliance with alternative GHG standards applicable to a subset of manufacturers4. Compliance with ZEV mandates5. Further fuel economy improvements applied if sufficiently cost-effective for buyersInclusion of these actions in the No-Action Alternative means that they are necessarily includedin each of the Action Alternatives. That is, the impacts of all the alternatives evaluated in thisproposal are against the backdrop of these State actions and actions to which automakers haveformally committed voluntary. This is important to remember, because it means that automakerswill be taking actions to improve fuel economy even in the absence of new CAFE standards, andthat costs and benefits attributable to those actions are therefore not attributable to possible futureCAFE standards.Besides the No-Action Alternative, the proposal also includes three “Action Alternatives.” Theproposed standards may, in places, be referred to as the “preferred alternative,” which is NEPAparlance, but NHTSA intends “proposal” and “preferred alternative” to be used interchangeablyfor purposes of this rulemaking. Each of the Action Alternatives is more stringent than the NoAction Alternative during MYs 2024-2026, as mentioned above. These alternatives are specifiedbelow, with Alternative 1 being the least stringent in MY 2026, Alternative 3 being the moststringent, and Alternative 2 falling between Alternatives 1 and 3 in terms of MY 2026stringency.2.1 Alternative 1Alternative 1 would increase CAFE stringency for MY 2024 by 9.14% for passenger cars and11.02% for light trucks and increase stringency in MYs 2025 and 2026 by 3.26% per year forboth passenger cars and light trucks. NHTSA calculates that the stringency of Alternative 1 ineach of MYs 2024-2026 is equivalent to fuel economy standards harmonized with the averagestringency of the California framework agreement applied to all manufacturers in those modelyears. NHTSA calculated the stringency values using the spreadsheet shown in Figure 2-1,assuming manufacturers would achieve a one percent reduction in stringency each model yearunder the California framework through the application of ZEV vehicle multipliers. Thespreadsheet applies a normalized stringency value of 100 percent in MY 2021 for both CO2standards and CAFE standards.
/yCARB CO2 Reductions20212022Overall Fleet Average Required CO2 3.7% per year100.0096.30Overall Fleet Average Required CO2 2.7% per year100.0097.30Offset Through BEV1.00BEV Vehicle Multiplier2.00Percentage of Fleet BEV (for 1%/y effective .214.391.502.93Calculation of Equivalent CAFE Stringency202120222023% CAFE fuel consumption offset for BEV fleet % (85%)0.430.82CAFE stringency (FC % of 2021)100.0096.8893.85Equivalent annualized gure 2-1 – Stringency Value CalculationsInformed by these calculations, NHTSA defined Alternative 1 by applying the CAFEharmonized stringency increases in MYs 2024-2026, resulting in the coefficients listed in Table2-1 and Table 2-2.Table 2-1 – Characteristics of Alternative 1 – Passenger Cars202420252026a (mpg)56.1558.0460.00b 10.001360.00132c (gpm per s.f.)d (gpm)Table 2-2 – Characteristics of Alternative 1 – Light Trucks202420252026a (mpg)46.1747.7349.34b (mpg)27.7328.6729.63c (gpm per s.f.)0.0004360.0004220.000408d (gpm)0.003770.003650.00353NHTSA has omitted the graphical representations of these coefficients (for this and otheralternatives) from this PRIA for brevity; they may be found in Chapter 1 of the accompanyingTechnical Support Document (TSD). For purposes of this analysis, the coefficients themselvesare what the CAFE Model uses directly to estimate manufacturer responses to different levels ofCAFE stringency.Under this alternative, the minimum domestic passenger car standard (MDPCS) is as shown inTable 2-3.
Table 2-3 – Alternative 1 – Minimum Domestic Passenger Car Standard20242025202644.9 mpg46.5 mpg48.0 mpgNHTSA considered this alternative as a way to evaluate the effects of industry-wide CAFEstandards approximately equivalent to the fuel savings that would result from standardsharmonized with the California framework agreement as applied to signatory OEMs’ productionfor the U.S. market. 182.2 Alternative 2 – Preferred AlternativeAlternative 2 would increase CAFE stringency at 8 percent per year, which NHTSA calculateswould result in total lifetime fuel savings from vehicles produced during MYs 2021-2029 similarto total lifetime fuel savings that would occur if the fuel economy standards harmonized with theCalifornia framework agreement had applied to all manufacturers during MYs 2021-2026.Table 2-4 – Characteristics of Alternative 2 – Passenger Cars202420252026a (mpg)55.4460.2665.50b (mpg)41.4845.0849.00c (gpm per s.f.)0.0004050.0003720.000343d (gpm)0.001440.001330.00122Table 2-5 – Characteristics of Alternative 2 – Light Trucks202420252026a (mpg)44.4848.3552.56b (mpg)26.7429.0731.60c (gpm per s.f.)0.0004520.0004160.000382d (gpm)0.003950.003640.00334Under this alternative, the MDPCS is as shown in Table 2-6.CAFE standards defining this alternative reflect the fact that EPCA does not provide a basis for CAFE standardsto include “multipliers” applicable to PHEV and/or BEV production volumes, as well as the fact that EPCA’streatment of BEV energy consumption is different from the “0 grams/mile” treatment for purposes of determiningcompliance with GHG emissions standards.18
Table 2-6 – Alternative 2 – Minimum Domestic Passenger Car Standard20242025202644.4 mpg48.2 mpg52.4 mpgNHTSA considered this alternative as a way to evaluate the effects of CAFE standardsharmonized with the California framework agreement has been applied to all vehiclemanufacturers when the framework began.2.3 Alternative 3Alternative 3 would increase CAFE stringency at 10 percent per year, which NHTSA calculateswould result in total lifetime fuel saving from vehicles produced during MYs 2021-2029 similarto total lifetime fuel savings that would have occurred if NHTSA had promulgated final CAFEstandards for MYs 2021-2025 at the augural levels announced in 2012 and, in addition, ifNHTSA had also promulgated MY 2026 standards that reflected a continuation of that averagerate of stringency increase (4.48% for passenger cars and 4.54% for light trucks).Table 2-7 – Characteristics of Alternative 3 – Passenger Cars202420252026a (mpg)56.6762.9769.96b 10.001270.00114c (gpm per s.f.)d (gpm)Table 2-8 – Characteristics of Alternative 3 – Light Trucks202420252026a (mpg)45.4750.5356.14b (mpg)27.3430.3833.75c (gpm per s.f.)0.0004420.0003980.000358d (gpm)0.003870.003480.00313Under this alternative, the MDPCS is as shown in Table 2-9.Table 2-9 – Alternative 3 – Minimum Domestic Passenger Car Standard20242025202645.4 mpg50.4 mpg56.0 mpg
NHTSA considered this alternative as a way to evaluate the effects of CAFE standards thatwould return to a fuel consumption trajectory exemplified by the standards announced in 2012.The following chapter in this PRIA contains information about how the CAFE Model simulatesmanufacturer responses to the regulatory alternatives described above, and then calculateseconomic, environmental, and other effects that could occur as a result of those manufacturerresponses.3. Simulating Alternatives with the CAFE Model3.1 Overall Purpose and Structure of the CAFE ModelOver time, NHTSA’s analyses have expanded to address an increasingly wide range of types ofimpacts. Today’s analysis involves, among other things, estimating how the application ofvarious combinations of technologies could impact vehicles’ costs and fuel economy levels (andCO2 emission rates); estimating how vehicle manufacturers might respond to standards byadding fuel-saving technologies to new vehicles; estimating how changes in new vehicles mightimpact vehicle sales and operation; and estimating how the combination of these changes mightimpact national-scale energy consumption, emissions, highway safety, and public health. Inaddition, the EIS accompanying today’s notice addresses impacts on air quality and climate, andthe effects that those changes in impacts h
Preliminary Regulatory Impact Analysis: Proposed Rulemaking for Model Years 2024-2026 Light-Duty Vehicle Corporate Average Fuel Economy Standards . (PRIA) has been prepared to assess the potential and anticipated consequences of proposed and alternative Corporate Average Fuel Economy (CAFE) standards for passenger cars and light trucks for .